báo cáo hóa học:" Research Article Optimization of Hierarchical Modulation for Use of Scalable Media" doc
Bạn đang xem bản rút gọn của tài liệu. Xem và tải ngay bản đầy đủ của tài liệu tại đây (1.61 MB, 12 trang )
Hindawi Publishing Corporation
EURASIP Journal on Advances in Signal Processing
Volume 2010, Article ID 942638, 12 pages
doi:10.1155/2010/942638
Research Article
Optimization of Hierarchical Modulation for Use of
Scalable Media
Yongheng Liu
1
and Conor Heneghan
2
1
Department of Electronic and Electrical Engineering, University College Dublin, Dublin, Ireland
2
Communication Digital Signal Processing Group, National Univer sity of Ireland, Dublin, Ireland
Correspondence should be addressed to Yongheng Liu,
Received 2 August 2009; Revised 3 January 2010; Accepted 13 January 2010
Academic Editor: Ling Shao
Copyright © 2010 Y. Liu and C. Heneghan. This is an open access article distributed under the Creative Commons Attribution
License, which permits unrestricted use, distribution, and reproduction in any medium, provided the original work is properly
cited.
This paper studies the Hierarchical Modulation, a transmission strategy of the approaching scalable multimedia over frequency-
selective fading channel for improving the perceptible quality. An optimization strategy for Hierarchical Modulation and
convolutional encoding, which can achieve the target bit error rates with minimum global signal-to-noise ratio in a single-user
scenario, is suggested. This strategy allows applications to make a free choice of relationship between Higher Priority (HP) and
Lower Priority (LP) stream delivery. The similar optimization can be used in multiuser scenario. An image transport task and a
transport task of an H.264/MPEG4 AVC video embedding both QVGA and VGA resolutions are simulated as the implementation
example of this optimization strategy, and demonstrate savings in SNR and improvement in Peak Signal-to-Noise Ratio (PSNR)
for the particular examples shown.
1. Introduction
Recent developments in media source coding have evolved
from consideration not only of compression efficiency in
terms of rate-distortion curves, but also on methods for
providing easy-to-use scalability features. Scalability refers to
the ability of the media delivery system to easily provide a
range of spatial, temporal, and quality profiles in response to
changing system conditions or user demands. For example,
a person viewing a sports event on a mobile phone may
be content to view a QCIF (176
× 144 pixels) resolution
level at 25 fps, whereas a person with access to an HDTV
may wish for a 50 fps, 720 p (1280
× 720 pixels) version of
the same media. Such demands can be met using scalable
video and audio coding, where lower resolution or lower
quality signals can be reconstructed from partial bit streams.
This allows simpler delivery of digital media, as networks
and terminals can autonomously adapt to issues such as
network heterogeneity and error-prone environments (e.g.,
wireless fading channels) [1]. Scalability allows the removal
of parts of the bitstream, while achieving a rate-distortion
(R-D) performance with the remaining partial bitstream
(at any supported spatial, temporal, or SNR resolution),
that is, comparable to a “single-layer” approach [2], that is,
nonscalable H.264/MPEG-4 AVC coding (at that particular
resolution) [3].
However, in order to take maximum advantage of
scalable coding, we need to ensure that scalability is treated at
a system level, so that all layers of the communication stack
can make intelligent decisions about how to use scalability.
For example, in real-time audio-visual traffic, consecutive
packets carry data of different importance for the user
perceived quality. Header information is of vital importance,
whereas texture information (in video coding) can tolerate
some errors. So, although data may be lost due to congestion
or poor wireless channel conditions, the class of data lost will
have the largest impact on user experience [4]. Nevertheless,
many current media transmission systems assume all data
from higher layers is equal in importance, and rely upon the
higher layers to provide the additional redundancy which can
help protect more important information. However, it can
be agreed that scalable media codecs often have the inherent
2 EURASIP Journal on Advances in Signal Processing
property that some data is more important than others,
and exploiting that knowledge may enhance overall system
performance.
One strategy that could be employed is to use time-
slicing of data with different priorities; however in [5],
Cover proved that if a sender wants to send information
simultaneously to several receivers, given specific channel
conditions, superimposing high-rate information on low-
rate information may achieve higher bandwidth efficiency
than the time-sharing strategy.
This has led to the concept of an alternative approach
for dealing with different streams of information at the
physical layer of a system, namely, hierarchical modulation.
Hierarchical Modulation (known also as embedded or mul-
tiresolution modulations) is one of the ways to implement
the superimposition of multichannel signals, which uses
constellations with nonuniformly spaced signal points. Many
researchers have shown interest in this strategy [6–8].
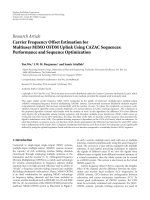
Normally, two or more separate data streams are modulated
onto one single constellation symbol stream, as shown in
Figure 1. The two classes of data can also be treated using
channel coding with different code rates in order to cope with
channel noise and fading. By tuning the code rate, a tradeoff
of bit rate and bit error probability can be achieved. This
concept was studied further in the early nineties for digital
video broadcasting systems [8, 9], and has gained more
interest recently with the demand to support multimedia
services by simultaneous transmission of different types
of traffic, each with its own quality requirement [10–12];
and a possible application in the DVB-T standard [13]
in which hierarchical modulations can be used on OFDM
sub-carriers. A two-level hierarchical modulation scheme
is an optional transmission feature of the DVB-T system,
in which the data to broadcast is split into two parts: a
high priority (HP) stream with a strong protection against
errors, and a low priority (LP) one with less protection.
Receivers with “good” reception conditions (e.g., closer to
the transmitter and/or with higher antenna gains) can receive
both streams, while those with poorer reception conditions
may only receive the “High Priority” stream. Broadcasters
can target two different types of DVB-T receiver with two
completely different services. Typically, the LP stream is of
a higher bit rate, but lower robustness than the HP one. For
example, a broadcast could choose to deliver HDTV in the LP
stream. The implementation of hierarchical modulation in
the Digital Video Broadcast standard for terrestrial broadcast
(DVB-T) in Europe [13] is a typical two services for two
users scenario. Its main purpose is to provide two types of
service (HDTV and SDTV), to carry multiple programs, and
to increase capacity [14, 15].
Scalable coding interacts naturally with hierarchical
modulation. Since the packets encoded by scalable codecs
can be divided into different classes of priority, a simple
scheme would create two classes such as “base information”
and “refinement information” according to their contribu-
tion to the quality/temporal/spatial resolution of the media.
The packets belonging to the base level can be allocated to
the base bits of the hierarchial constellation, meanwhile the
refinement packets can be assigned to the refinement bits of
2d
1
2d
2
d
1
Real
Imaginary
Figure 1: A 16-QAM constellation used in Hierarchical Modula-
tion.
the constellation. The user who is able to decode the base
bits of the hierarchical constellation can achieve the lower
resolution. Furthermore, if a user is able to decode both
the base bits and the refinement bits, a higher resolution
is achieved. The enhancement layer cannot reconstruct a
higher resolution alone. It has to reuse the information of
the lower resolution embedded in the base layer. In order to
provide two different resolutions using a nonscalable codec,
the media must be encoded twice and the media packets
for different resolutions cannot reuse the information from
each other. Since the base layer packets encoded by a scalable
codec can be reused by the enhancement layer packets, the
scalable codec is more efficient than the nonscalable codec
in providing multiresolution media simultaneously. In this
case, the source packets contributing to the low resolution
are allocated to the base bits of the hierarchical constellation
and the packets which only contribute to the high resolution
are carried by the refinement bits. The users close to the
stationareabletogetallpacketsdecodedandreceiveahigh
resolution program. Due to reduced radio signal attenuation,
the users far away from the station will probably not be able
to decode the refinement bits, but they can still decode the
packets for low resolution with acceptable quality.
Note however that the flexibility introduced by hier-
archical modulation does not come without a price. In
[16], Jiang and Wilford illustrated that a penalty of slightly
reduced SNR in base layer bits is introduced by hierarchical
modulation. This penalty has equal impact on both scalable
and nonscalable codec in a hierarchical system.
However, as we shall see in Section 2, hierarchical
modulation also imposes a second performance penalty,
namely, for a given choice of hierarchial constellation, and
fixed target bit error rates of the two streams, the system will
almost certainly be operating at a higher overall SNR than is
needed to satisfy the target BERs.
In this paper, we will show how the constellation can
be dynamically adapted at the physically layer in order to
remove this performance penalty. This adaptation can be
EURASIP Journal on Advances in Signal Processing 3
done at a session level, or even with finer granularity (e.g., at
a one-second interval) in response to the changing dynamics
of the transmitted bit-streams.
The paper is presented as follow. In Section 2 we discuss
the basic analytical tools for calculating bit error rates in a
sample hierarchical system. A simulation of the single-user
scenario, a simulation of the multiuser scenario and their
results are described in Sections 3 and 4, separately. Section 5
concludes this paper.
2. Error Rate Analysis and Optimization in
Hierarchical Modulation
As introduced above, hierarchical modulation is a physical
layer modulation technique in which the received signal
constellations can be treated in two (or more) parts, by first
making coarse decisions about the constellation location,
followed by a refined decision on the exact location. Figure 1
shows a 16-QAM constellation diagram to illustrate hier-
archical modulation. The data carried by this constellation
is broken into two classes: a low priority (LP) and high
priority (HP) class. The bits from the HP stream are
used to select the quadrant of the constellation point, and
the LP stream is used to choose the exact constellation
point. The notations d
1
and d
2
represent the intra- and
interconstellation group distances, respectively. The ratio k
=
d
1
/d
2
is an important parameter, as it defines the achievable
error rates of the system in the presence of noise. When k is
equal to 1, the constellation reverts to a standard 16-QAM
constellation. When k is larger than 1, the HP stream is more
heavily protected against noise than the LP stream. This is
compatible with the typical definition of constellation ratio
in DVB-T/DVB-H standard [13].
Before assigning the HP and LP streams to Hierarchical
Modulation constellation points, we can decrease the bit
error probability of the streams by using standard coding
techniques such as convolutional coding. A high-rate code
is suitable for the LP bit stream because of its lower bit error
rate demand. Using different rates of code in the HP and LP
bit streams is helpful in achieving arbitrary target bit error
rates in the Physical Layer.
Exact (in M) BER expressions for uniform M-QAM over
an additive white Gaussian noise (AWGN) channel have been
developed in [17, 18] based on signal-space concepts and a
recursive algorithm, respectively. Exact expressions for the
BER of 16-QAM and 64-QAM in nonfading and frequency
flat fading channels were derived in [19]. The exact and
generic (in M) expression for the BER of uniform square
QAM in the presence of AWGN channel was obtained in [20].
For uncoded hierarchical constellation scenarios, an
approximate BER expression is described in [9, 10]for
4/16-QAM, 4/64-QAM and in [10] for multicast M-PSK.
Reference [21] obtains exact and generic expressions in M
for the BER of the 4/M-QAM (square and rectangular) con-
stellations over additive white Gaussian noise (AWGN) and
fading channels. Over the AWGN channel, these expressions
can be described by a weighted sum of complementary error
functions.
00 01 11 10
2d
2
d
1
d
1
2d
2
2d
1
Figure 2: 4-PAM constellation.
In the analysis and simulations which follow, we assume
two bit streams, separately fed into convolutional encoders
with code rates R
1
and R
2
, which are then gray-coded
and modulated onto a 16-QAM constellation. After the
encoding and modulation, the two streams are converged
into one symbol sequence and transmitted through an
AWGN channel. In the receiver the symbols contaminated
by noise are demodulated using a Maximum-Likelihood-
Sequence-Estimation technique (Viterbi).
In order to determine the performance of this hier-
archical modulated scheme, we carry out an analysis of
the error probability for the uncoded case. An exact bit
error probability expression has been derived in [21]. In
this section, the expression will be further developed into a
simpler form. This will allow us to minimize the overall SNR
which satisfies the target BERs. For the sake of clarity, we will
start the analysis from the original step.
Asdescribedin[22], the 16-QAM constellation is
equivalent to two 4 PAM signals on quadrature carriers.
Since the signals in the phase-quadrature components can
be perfectly separated at the demodulator, the probability of
error for QAM can be easily determined from the probability
of error for PAM. Therefore, the probability of a bit error for
the M-ary QAM is
P
M
=
1
2
P
i,
√
M
+ P
q,
√
M
,(1)
where P
i,
√
M
and P
q,
√
M
are the error probabilities of the
√
M-ary PAMs with one-half the average power in each
quadrature signal of the equivalent QAM system. It should
be emphasized here that the error probability discussed here
is bit error, which is different from the symbol error in [22].
The signal points for the unevenly spaced gray-encoded
4-PAM constellation are described in Figure 2.
The error probability for the bits contained in the HP
stream is
P
H
=
1
2
1
2
P
(
|r −s
m
| >d
1
−d
2
)
+
1
2
P
(
|r −s
m
| >d
1
+ d
2
)
,
(2)
where r is the received symbol contaminated by white
Gaussian noise with zero-mean and variance σ
2
n
= (1/2)N
0
,
and s
m
is the transmitted symbol (i.e., r = s
m
+n). We assume
4 EURASIP Journal on Advances in Signal Processing
that each symbol is equiprobable. Given this AWGN channel,
the error probability can be given generically as
P
=
1
2
P
(
|r −s
m
| >d
)
=
1
2
2
πN
0
∞
d
e
−x
2
/N
0
dx
= Q
⎛
⎝
2d
2
N
0
⎞
⎠
.
(3)
The average bit energy is
ε
b
= d
2
1
1+
1
(k +1)
2
=
d
2
2
(k +1)
2
+1
,(4)
where k
= d
1
/d
2
and d
1
= d
2
+ d
1
.Let
A
= (1 + k)
2
,
B
= A +1.
(5)
Using (1)–(5), we obtain the error probability for the HP
bit of 4-PAM as
P
H
=
1
2
⎡
⎢
⎣
Q
⎛
⎜
⎝
2ε
b
(
k +2
)
2
BN
0
⎞
⎟
⎠
+ Q
⎛
⎝
2ε
b
k
2
BN
0
⎞
⎠
⎤
⎥
⎦
. (6)
From the same argument, we can determine the error
probability for the LP bit of the 4-PAM constellation as
P
L
= Q
2ε
b
BN
0
+
1
2
Q
⎛
⎝
4ε
b
2k
2
+5k +4
BN
0
⎞
⎠
−
1
2
Q
⎛
⎝
4ε
b
2k
2
−5k +4
AN
0
⎞
⎠
.
(7)
Assume that the distances between the corresponding
signal points in the Imaginary component and the Quadra-
ture component are same:
P
i,
√
M
= P
q,
√
M
. (8)
By substituting the error probabilities for the PAM-
system, we can obtain the corresponding QAM-system BERs
as a function of k:
P
HM
=
1
2
⎡
⎢
⎣
Q
⎛
⎜
⎝
2ε
b
(
k +2
)
2
BN
0
⎞
⎟
⎠
+ Q
⎛
⎝
2ε
b
k
2
BN
0
⎞
⎠
⎤
⎥
⎦
,
P
LM
= Q
2ε
b
BN
0
+
1
2
Q
⎛
⎝
4ε
b
2k
2
+5k +4
BN
0
⎞
⎠
−
1
2
Q
⎛
⎝
4ε
b
2k
2
−5k +4
AN
0
⎞
⎠
.
(9)
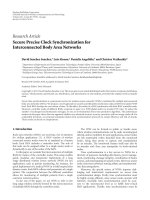
Figure 3 uses the expressions derived above to calculate
the BER rates for the LP and HP streams using a fixed 16-
QAM constellation with k
= 1, and typical convolutional
0246810
10
−7
10
−6
10
−5
10
−4
10
−3
BER(log10)
E
b
/N
0
(dB)
1/2 encode, higher 2 bits
2/3encode,lower2bits
k
= d
1
/d
2
= 1
BER2
BER1
SNR1 SNR2
HP
LP
Hierarchical streams in AWGN channel
Figure 3: Bit error rate curves for a convolutional coded hierarchi-
cal modulation scheme, with a fixed value of k
= 1.
codes used on both streams. In this example, the target BER
is chosen as 1e
− 6 for the HP data and 1e − 4 for the
LP stream. It illustrates the potential penalty of operating
a fixed hierarchical modulation scheme. In this case, at an
SNR of 4.1, we satisfy the LP BER, but we actually exceed
the target BER for the HP bit. In a sense, we are therefore
transmitting more signal power than is necessary to meet the
system requirements.
2.1. Optimization of Hierarchical Modulation for AWGN
Channel. From (9) we can derive the Signal-to-Noise Ratio
(SNR) for low priority bits and high priority bits as a
function of space ratio k and the target bit error rate for high
priority bits and low priority bits:
ε
b
N
0
HM
= f
HM
(
P
HM
, k
)
,
ε
b
N
0
LM
= f
LM
(
P
LM
, k
)
.
(10)
The overall SNR required by the transmission of both
high priority bits and low priority bits is the bigger one of
the SNR described by (10). Thus, given target bit error rates
for high priority bits and low priority bits,
P
HM
= BER
HM
,
P
LM
= BER
LM
,
(11)
the optimization of the hierarchical modulation can be
described by the following equation:
min
k∈R, k>0
max
ε
b
N
0
HM
,
ε
b
N
0
LM
. (12)
Since the Q function in (9) does not have an expression
with finite number of coefficients, it is difficult to get an exact
EURASIP Journal on Advances in Signal Processing 5
0 5 10 15 20 25
10
−12
10
−10
10
−8
10
−6
10
−4
10
−2
10
0
Bit error probability (log10)
E
b
/N
0
(dB)
k
= 0.5, HP
k
= 0.5, LP
k
= 1, HP
k
= 1, LP
k
= 1.5, HP
k
= 1.5, LP
k
= 2, HP
k
= 2, LP
The bit error probability for hierarchical 16-QAM according to k
Figure 4: Bit error probability versus SNR per bit for various k
values.
expression for (10). There are several approximations pro-
posed in [23–26]. However, all these approximations are
suitable for a specific range of the independent variable. For
example, when the independent variable x is smaller and far
away from 1 (x
1), an approximation of Q function is
derived from the Maclaurin series:
Q
(
x
)
=
1
2π
x −
1
6
x
3
+
1
40
x
5
−
1
336
x
7
+
1
3456
x
9
+ ···
.
(13)
The objective of the optimization is to find out an
optimum number k given (k>0, k
∈ R), which leads to a
minimum overall SNR. Thus the above approximation of Q
function is not suitable. In this section, we first analyze the
property of (10)byaidoftheBERversusSNRcurve.Then,
a realistic method is used to calculate the tabulation of the
overall SNR versus the space ratio k and the target BER for
high priority bits and low priority bits.
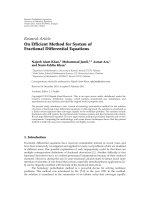
Figure 4 is drawn according to (9). It gives the BER curves
versus global E
b
/N
0
for various values of k. It illustrates along
with the increment of k, the BER curve for HP bits moves
backward while the BER curve for LP bits moves forward
along the SNR axis. That is, for a fixed BER value, the SNR
for HP bits monotonically decreases as k increases, and the
SNR for LP bits monotonically increases in response to k.As
k increases, the SNR for HP and LP bits cross; thus, for any
target bit error rate, the gap between SNR for HP bit and the
SNR for LP bits equals zero for some value of k. Because the
overall SNR is the bigger on of the SNR for high priority bits
and the SNR for low priority bits, we conclude that we get
the minimum overall SNR when the SNR for HP is equal to
the SNR for LP which meets the target BER.
BER for HP = 1e −7
BER for LP
= 1e −4
The gap between SNRs as a function of k
0.511.522.53
0
1
2
3
4
5
6
7
8
9
Gap of SNR for HP and SNR for LP (dB)
k = d
1
/d
2
Figure 5: SNR Gap versus k curve.
0.511.522.53
12
12.2
12.4
12.6
12.8
13
13.2
Minimum SNR according to target BERs (dB)
k = d
1
/d
2
Target bit error rate:
High priority: 1e
−7
Low priority: 1e
−4
Channel type: AWGN
Minimum SNR for space ratio of hierarchical 16-QAM
Figure 6: SNR versus k curve.
Given the BER formulae in (9), we can easily estimate the
required E
b
/N
0
to meet the target Bit Error Rates. Through
tracking the gap between these SNRs per bit in response to
k, we can find the k corresponding to the minimal gap. An
example is shown in Figures 5 and 6, where the target BERs
are 1
× 10
−7
and 1 × 10
−4
. Figure 5 shows that the k which
produces a zero-gap is about 1.4, and Figure 6 shows that the
corresponding SNR per bit is approximately 11.4 dB.
Figure 7 shows the comparison of the required SNR per
bit for k
= 1 (normal 16-QAM) and k = 1.4(Optimized
Hierarchical Modulation) in order to achieve the desired
BERs, and shows that about 2 dB savings can be achieved by
optimization.
2.2. Optimization of Hierarchical Modulation for Flat R ayleigh
Fading Channel. Since an OFDM system is employed in
the simulation, the multipath Rayleigh fading channel is
converted to a flat Rayleigh fading channel for a specific
6 EURASIP Journal on Advances in Signal Processing
Ta rg et B ER :
HP: 1e
−7
LP: 1e
−4
Channel: AWGN
16 QAM
SNR
O
SNR
N
SNR
O
SNR
N
0 2 4 6 8 10 12 14 16 18 20
10
−8
10
−7
10
−6
10
−5
10
−4
10
−3
10
−2
10
−1
Bit error rate (log 10)
E
b
/N
0
(dB)
k = 1.4, LP, 1/2encode
k
= 1, LP, 1/2encode
k
= 1, HP, 1/2encode
k
= 1.4, HP, 1/2encode
k
= 1.4, LP
k
= 1, LP
k
= 1, HP
k
= 1.4, HP
Comparison of normal and optimum hierarchical modulation
Figure 7: Comparison of required SNR per bit for k = 1andk =
1.4.
subcarrier, given that the cyclic prefix length is longer
than the number of taps used by the multipath fading
channel. In this section, the bit error probability of high
priority bits and low priority bits over flat Rayleigh fading
channel are deployed and the optimization of the hierarchical
modulation over flat Rayleigh fading channel is explained.
In the simulation of this paper we employed a frequency-
selective fading channel. That is, we simulated an indoor
small scale multiple reflective paths radio environment and
there is no line-of-sight component. There is relatively
slow motion between the transmitter and the receiver. The
mathematical model of the multipath radio channel is
expressed by (14):
H
(
nT
s
)
=
N−1
k=0
a
k
h
(
nT
s
−kT
s
)
. (14)
In the equation above, T
s
denotes the sample period and
h(nT
s
− kT
s
) simulates multipath delay components of the
fading channel. The coefficient a
k
represents the attenuation
of the kth path. Each h(nT
s
−kT
s
) can be modeled by
h
n
(
t
)
= x
n
(
t
)
+ jy
n
(
t
)
,
(15)
in which the x
n
(t)andy
n
(t) are independent and identical
distributed (i.i.d.) Gaussian random variable with mean μ
=
0andvarianceσ
2
. The magnitude |h
n
(t)|has Rayleigh power
density function (PDF) described by
p
(
r
)
=
r
σ
2
e
−r
2
/2σ
2
, r ≥ 0.
(16)
In one subcarrier of the OFDM symbol, the multipath
Rayleigh Fading channel is converted to a single path
channel:
H
(
nT
s
)
= ah
(
nT
s
)
,
(17)
or in normalized continuous version,
H
(
t
)
= h
(
t
)
.
(18)
The system channel model is described by
y
(
t
)
= h
(
t
)
x
(
t
)
+ n,
(19)
in which y(t) is the received signal, x(t) is the transmitted
signal, h(t) is the complex flat Rayleigh fading component
and n is Additive White Gaussian Noise (AWGN) with mean
0andvarianceσ
2
0
. When the received signal is equalized in
the receiver, the flat Rayleigh fading component is estimated
by the receiver and used to divide (19). The following
equation is derived from (19):
y
(
t
)
= x
(
t
)
+
n
h
(
t
)
.
(20)
Equation (20) indicates that by taking into account
the flat Rayleigh Fading component h(t) the generic error
probability over AWGN channel as described by (3)becomes
P
= Q
⎛
⎜
⎝
|h|
2
2d
2
N
0
⎞
⎟
⎠
, (21)
in which
|h| is a Rayleigh distribution random variable and
|h|
2
is chi-square random distributed with two degrees of
freedom, if the variance of Re(h)andIm(h)is1,whichisan
assumption without loss of generality. Thus, the following
equation is used to calculate the generic error probability
over flat Rayleigh fading channel:
P
h
=
∞
0
1
2
erfc
γ
p
γ
dγ,
(22)
in which γ
=|h|
2
d
2
/N
0
and erfc(x) is called complementary
error function. Complementary function has the following
relation with Q function:
erfc
(
x
)
=
2
√
π
∞
x
2
−t
2
dt = 2Q
(
2x
)
. (23)
The PDF for chi-square distributed random variable with
two degrees of freedom is described by
p
γ
=
1
2d
2
/N
0
e
−γ/(2d
2
/N
0
)
.
(24)
By introduction of (24)to(22) the generic bit error
probability over flat Rayleigh fading channel is derived as
P
h
=
1
2
⎛
⎝
1 −
2b
2
/N
0
2b
2
/N
0
+1
⎞
⎠
. (25)
EURASIP Journal on Advances in Signal Processing 7
From (25), (1), (4), (5), and (6), we can derive the bit
error probability of high priority bits and low priority bits for
Hierarchical Modulation over flat Rayleigh fading channel:
P
HM,h
=
1
2
−
1
4
2ε
b
(k +2)
2
/BN
0
2ε
b
(k +2)
2
/BN
0
+1
−
1
4
2ε
b
k
2
/BN
0
2ε
b
k
2
/BN
0
+1
,
P
LM,h
=
1
2
−
1
2
2ε
b
/BN
0
2ε
b
/BN
0
+1
−
1
4
4ε
b
2k
2
+5k +4
/BN
0
4ε
b
(
2k
2
+5k +4
)
/BN
0
+1
+
1
4
4ε
b
2k
2
−5k +4
/AN
0
4ε
b
(
2k
2
−5k +4
)
/AN
0
+1
.
(26)
From (26) we can derive the Signal-to-Noise Ratio (SNR)
for low priority bits and high priority bits as a function of
space ratio k and the target bit error rate for high priority
bits and low priority bits over flat Rayleigh fading channel:
ε
b
N
0
HM,h
= f
HM,h
(
P
HM
, k
)
,
ε
b
N
0
LM,h
= f
LM,h
(
P
LM
, k
)
.
(27)
The optimization of the hierarchical modulation over flat
Rayleigh fading channel can be described by the following
equation:
min
k∈R,k>0
max
ε
b
N
0
HM,h
,
ε
b
N
0
LM,h
. (28)
Similar to the situation described in Section 2.1,itis
difficult to get an exact expression for (27). We can employ
a realistic method to calculate the tabulation of the overall
SNR versus space ratio k. On the other hand, we can analyze
the feature of the relation between overall SNR and space
ratio k by drawing the flat Rayleigh fading version of Figures
5 and 6. Figure 8 shows the gap between the required SNR
for high priority bits and the required SNR for low priority
bits, in order to meet the target average BER for high priority
bits and low priority bits over flat Rayleigh fading channel.
Figure 9 shows the local minimum overall SNR required for
the target average BER versus space ratio k over flat Rayleigh
fading channel. In the given example, the target average BERs
for HP and LP are 10
−7
and 10
−4
. The local optimum k
value is approximately k
min
= 37.07. The corresponding local
minimum SNR is (E
b
/N
0
)
min
= 17.72 dB. In practice, when
the space ratio k
3, it implies that the hierarchical 16-
QAM constellation is degraded into a 4-QAM constellation.
This means, in a flat Rayleigh fading channel, the low priority
bits of a 16-QAM hierarchical constellation is very easy to
be distorted and sensitive to channel noise. In order to
conquer the flat fading distortion, a convolutional channel
coding method is employed in the simulation. The impact of
channel coding is discussed in the following sections.
The gap between SNRs as a function of k
over flat Rayleigh fading channel
0 10203040 50
10
−2
10
−1
10
0
10
1
10
2
Gap of SNR for HP and SNR for LP
Space ratio k
Figure 8: SNR Gap versus k curve over flat Rayleigh fading channel.
The target ber for high priority bits is 1e
− 7 and the target ber for
low priority bits is 1e
−4.
01020304050
17.6
17.7
17.8
17.9
18
18.1
18.2
18.3
Minimum SNR according to target BERs
Space ratio k = d
1
/d
2
SNR
min
k
min
Target bit error rate:
High priority: 1e
−7
Low priority: 1e
−4
Channel type: flat Rayleigh fading channel
Minimum SNR for space ratio of
hierarchical 16-QAM over flat Rayleigh fading channel
Figure 9: SNR versus k curve over flat Rayleigh fading channel. The
overall SNR gets minimum value of 17.72 dB when the space ratio
k
= 37.07.
2.3. Analysis of Packet Error Rate over AWGN Channel. The
previous analysis is based on bit error rate. In practice, higher
layers may be packet-oriented, so that package error rate
is the more important parameter. We can make a simple
mapping from BER to expected PER, under some simple
assumptions. Assuming that the probability of decoding one
bit wrongly (P
b
) is a stationary uncorrelated process, we can
consider the decoded bit stream as a Poisson process. This
yields the relationship between BER and PER:
P
p
= 1 − e
−P
b
L
,
(29)
in which, P
p
is PER, P
b
is BER and L is the package length.
8 EURASIP Journal on Advances in Signal Processing
0 5 10 15 20
10
−4
10
−3
10
−2
10
−1
10
0
Package error rate (log 10)
E
b
/N
0
(dB)
Target package error rate:
High priority: 1e
−3
Low priority: 1e
−1
Package length: 1024 bits
Channel type: AWGN
Constellation: 16-QAM
k
= 1, HP
k
= 1, LP
k
= 1.2, HP
k
= 1.2, LP
Comparison of normal and optimized hierarchical QAM
Figure 10: Package error rate versus SNR per bit.
Using (9)–(29), we find that for a fixed k, the required
SNR will increase in response to increased packet length.
Thepacketlengthisaffected by the tradeoff between
source coding efficiency and packet error rate. Given a fixed
packet length, we can achieve the corresponding optimum
space ratio k.
Figure 10 shows a comparison of SNR per bit for k
=
1 (Normal 16-QAM) and k = 1.2 (optimized Hierarchical
Modulation) for a desired package error rate. In this case,
about 1 dB power saving is achieved by optimization.
2.4. Impact of Coding on Performance. Analytical results to
date have been based on uncoded bit error rates. In practice,
the performance of coded hierarchical modulation systems is
of more practical interest. The effect of coding will shift the
BER curve to the left by the coding gain.
For the HP and LP streams, the two BER curves will in
general be shifted by different amounts (since coding gain is
a function of the code, and the SNR). However, the coding
gain is fixed for a given code rate and SNR, given fixed
target BERs. Thus, we can apply a known correction factor
to the optimum space ratio k in the case of encoded bits. For
example, Table 1 gives the coding gain difference between the
shifts of HP and LP BER curves for the case where a rate
R
= 1/2 is used in both streams. Hence, we can iteratively
determine the optimum space ratio in the case of rate 1/2
encoders and 16-QAM Hierarchical modulations.
Figure 11 shows the coding gain of 1/2 convolutional
coded hierarchical method for specific targe bit error rate for
high periority and low priority stream.
3. Single-User Scenario Simulation and Results
As a proof-of-concept of the use of the Optimum Hierar-
chical Modulation scheme for single user in scalable video
Coding gain difference = gain 2 − gain 1
02468101214
10
−8
10
−6
10
−4
10
−2
10
0
BER
E
b
/N
0
(dB)
HP, no code
LP, no code
LP, 1/2coded
HP, 1/2coded
Gain 1
Gain 2
Figure 11: Comparison of coded and uncoded BERs versus SNR
perbit(16-QAMmodulated).
Table 1: Coding gain of BER curve according to space ratio k at
BER of 10
−4
and 10
−7
.
k(d
1
/d
2
)
0.5 1 1.5 2 2.5 3
Difference in
Coding Gain
(dB)
8.3 2.5
−1.1 −3.6 −5.6 −6.9
delivery, we send a still image through an AWGN single
carrier channel.
The convolutional code of rate 1/2 and 16-QAM Hier-
archical Modulation is employed for transmission. The data
bits with higher priority and lower priority are convolutional
coded and padded with parity bits. The coded bits with
high priority are used to select the base bits in 16-QAM
constellation and the coded bits with low priority are used
to select the refinement bits in the constellation. The average
distances of the base bits and the refinement bits can be tuned
in order to give an optimized overall image quality (all save
the E
b
/N
0
under the same quality).
We employ a specific example of a scalable still image
encoder. The 64
× 64 pixels image is processed by a
progressive encoder called the Embedded Zero-tree Wavelet-
Spatial Orientation Tree (EZW-SOT) [27]. An embedded
code represents a sequence of binary decisions that distin-
guish an image from the all gray image. The embedded
coding possesses the property that all the bits are ordered
in importance in the bit stream. The importance of the
bits can be determined by the precision, magnitude, scale,
and spatial location of the wavelet coefficients. For example,
there are several real numbers described by 4 digits—
a
· bcd. The digit a is the most significant digit of each
number and the d is the least significant digit. Thus, the
numbers can be stored by a new order in significance, say,
a1, a2, ,b1, b2, , c1, c2, , d1, d2, Using embedded
coding, a decoder can stop decoding at any position and
EURASIP Journal on Advances in Signal Processing 9
0123456789
10
−6
10
−4
10
−2
10
0
BER versus SNR for normal 16-QAM
Bit error rate (log 10)
E
b
/N
0
(dB)
High priority
Low priority
(a)
0123456789
0
20
40
60
PSNR when k
= 1
Peak signal-to-noise ratio
E
b
/N
0
(dB)
(b)
Figure 12: BER and PSNR curve for Hierarchical Modulation of
k
= 1.
an optimized quality of the same image will be achieved.
A discrete wavelet transform provides a multiresolution
presentation of the image. The wavelet coefficients can be
embedded coded according to their significance. The zero-
tree coding provides a binary map, which can indicate the
positions of the significant wavelet coefficients.
Since the coded bits are ordered in importance, it is
possible to partition the bits in any position arbitrarily.
The encoded bit stream is then divided into two-priority
classes, with target BERs of 1
× 10
−3
and 1 × 10
−5
.Inafirst
simulation, we choose a space ratio k
= 1(conventional
16-QAM modulation). The BER of transmission and PSNR
of the resulting decoded image are shown in Figure 12.In
the simulations we assume no retransmission of any data.
In order to avoid the crash of the decoder, the first data
packet which contains the header information for decoding
is assumed to be perfectly received. In simulation 2, we chose
the optimum space ratio k
= 1.3 for the coding. The result
of simulation 2 is shown in Figure 13.Inbothcases,R
= 1/2
convolutional codes are used for both LP and HP bitstreams.
To achieve a desired value of PSNR
= 30 dB (at which it is
hard to perceive the quality difference between the decoded
image and the original one), simulation 1 has to provide an
SNR per bit greater than 5.3 dB, and simulation 2 only needs
to provide an SNR per bit of 3.8 dB, so that 1.5 dB is saved.
4. Two Users Scenario Simulation and Results
In the single-user hierarchical modulation scenario, the
two or more data channels mapped to the base bits and
refinement bits of the constellation points are used to carry
0123456789
10
−6
10
−4
10
−2
10
0
BER versus SNR for optimum hierarchical modulation (k = 1.3)
Bit error rate (log 10)
E
b
/N
0
(dB)
(a)
0123456789
0
20
40
60
PSNR versus SNR when k
= 1.3
Peak signal-to-noise ratio
E
b
/N
0
(dB)
(b)
Figure 13: BER and PSNR curve for Optimum Hierarchical
Modulation of k
= 1.3.
the data belonging to different priority levels of one service
aiming at one user. As an alternative to the single user case,
in the two users case, the two users are assumed to receive
the data carried by the hierarchical constellation points
and collect the part useful to them. In our simulation, we
transmitted an H.264 scalable coded video trailer in which
two different resolution sizes are embedded, a VGA (640
×
480 pixels) size and a QVGA (320 × 240 pixels) size. The
video packets used for decoding the VGA and the QVGA
versions are carried by the two different data channels of the
hierarchical constellation. All the data packets are encoded
using a convolutional code with a rate of 1/2 before being
mapped to the constellations. Assuming the video signal is
transmitted in an indoor wireless environment, one user is
close to the transmitter and has good average E
b
/N
0
, the
other is relatively far from the transmitter and relatively bad
average E
b
/N
0
. The user in a good receiving condition is able
to decode most of the data packets and is able to watch
the VGA version of the trailer. The user in bad receiving
condition cannot obtain enough data packets for decoding a
VGA trailer due to the wireless loss, but can decode a QVGA
size video with acceptable quality.
According to the scalability in the spatial domain, the
video data packets are classified into the base layer packets
and the refinement layer packets in resolution. The base layer
resolution packets bearing a QVGA sample of the original
pictures, that can be used to reconstruct a QVGA size of
the original video. The refinement layer packets in resolution
carry the refinement information which can be used together
with the base layer packets to reconstruct a full VGA sample
of the video, as shown in Figure 14.
The bit rate of the refinement layer packets is approxi-
mately twice that of the bit rate of the base layer packets. A
4/64-QAM hierarchical constellation is employed, as shown
10 EURASIP Journal on Advances in Signal Processing
VGA (640 ×480)
QVGA
(320
×240)
Base layer
Base layer
+
refinement layer
Base layer
Refinement layer
···
···
Figure 14: The H.264 scalable encoded video composes of two
embedded resolutions.
Base bits
Refinement
bits
2d
1
2d
1
2d
2
Figure 15: The 4/64-QAM hierarchical constellation modulated by
two sequences of data bits.
in Figure 15. Each bit from the base layer packets is used to
select the four quadrants of a 4/16-QAM constellation and
each two bits from the refinement layer packets are used to
choose one of the constellation points inside the quadrant
selected by the base bit. The 2d
1
and 2d
2
represent the
intra- and interconstellation group distances, respectively.
The ratio of d
1
and d
2
, k = d
1
/d
2
can be tuned to change the
BER performance of the base bits and the refinement bits.
Figure 16 shows the PSNR performance of the VGA
version of the H.264 scalable video decoded by the “good
condition” user with the different values of the space ratio
k
= 1, 2, 4. We employ slow multipath fading channel for
the simulations. The fading channel is modeled by the sum
of a series of delayed taps, with each tap is generated by a
Rayleigh process. The coefficients of each delayed tap are
calculated according to the model A in [28]. The PSNR
performance of the QVGA version of the H.264 scalable
video decoded by the “bad condition” user is shown in
Figure 17. When E
b
/N
0
is below 25 dB, increasing the space
PSNR performance for VGA resolution with different k
20 25 30 35 40
26
28
30
32
34
36
38
Peak signal to noise ratio (dB)
E
b
/N
0
(dB)
k
= 1
k
= 2
k
= 4
Figure 16: The PSNR performance for VGA resolution with
different space ratio k. The priority of each data packet is labeled
and aware of by the MAC layer.
ratio k can improve the PSNR performance significantly
for both VGA and QVGA versions. This can be explained
because a bigger k means more protection for the high
priority level data channel or the base layer packets in spatial
domain. The base layer packets contribute more to the overall
PSNR quality than the enhancement layer packet. That is,
abiggerk protects from the loss of base layer packets,
while a smaller k will cause more loss of base layer packets,
reducing the PSNR performance more significantly than the
loss of enhancement layer packets. With the E
b
/N
0
increasing,
in the VGA scenario, using k
= 1offers the best PSNR
performance. This is because in the good channel condition,
given that very few base layer packets are lost, using k
= 1
means relatively strong protection for the enhancement layer
packets, and less loss of enhancement layer packets provide
higher performance.
To evaluate the overall quality performance received by
the two users, we calculated the average PSNR performance
of the VGA and QVGA versions. In this calculation we
assumed that the two users’ perceptive quality are equally
important. According to the definition of PSNR,
PSNR
= 10 log
10
I
2
MSE
,
(30)
the Mean Squared Error (MSE) is described by
MSE
=
I
2
10
PSNR/10
.
(31)
Thus, the average MSE of the VGA and the QVGA version
of the video trailer is described by
MSE
ave
=
MSE
1
+MSE
2
2
=
I
2
/10
PSNR
1
/10
+ I
2
/10
PSNR
1
/10
2
.
(32)
EURASIP Journal on Advances in Signal Processing 11
PSNR performance for QVGA resolution with different k
20 25 30 35 40
26
28
30
32
34
36
38
Peak signal to noise ratio (dB)
E
b
/N
0
(dB)
k
= 1
k
= 2
k
= 4
Figure 17: The PSNR performance for QVGA resolution with
different space ratio k. The priority of each data packet is labeled
and aware of by the MAC layer.
From (31)and(32) the average PSNR of the VGA and
QVGA version of the video is derived to
PSNR
ave
= 10 log
I
2
MSE
ave
=
10 log
2 ∗ 10
(PSNR
1
+PSNR
2
)/10
10
PSNR
1
/10
+10
PSNR
2
/10
.
(33)
The average PSNR performance of the VGA and QVGA
versions is shown in Figure 18.
NotethatatlowE
b
/N
0
using k = 4 provides the
best overall PSNR performance (approximately 6 dB gain in
PSNR at E
b
/N
0
of 20 dB). When the E
b
/N
0
is increasing, using
k
= 2 provides a better PSNR performance at the E
b
/N
0
in the range of 29 dB and 35 dB. When the E
b
/N
0
is larger
than 35 dB, using k
= 4offers the best PSNR performance.
Assuming that the E
b
/N
0
can be estimated and known by
the transmitter and the receiver, a hierarchical constellation
scheme which can provide the best PSNR performance by
using a selection of k values is shown in Figure 19.
5. Conclusion
This paper proposed an optimized hierarchical modulation
strategy directed by cross-layer transport priority informa-
tion for both single user scenario and two users scenario. In
the one user scenario, the hierarchical modulation combined
with a convolutional code is designed to achieve the objective
bit error rates of two data channels with different priority
level by an overall minimum signal to noise ratio. In the
two-user scenario, the hierarchical modulation strategy, the
video codec scalability in spatial domain is considered and
an optimized strategy is proposed for the best perceivable
20 25 30 35 40
26
28
30
32
34
36
38
Peak signal to noise ratio (dB)
Overall PSNR performance for two users with different k
E
b
/N
0
(dB)
k
= 1
k
= 2
k
= 4
Figure 18: The overall PSNR performance for both VGA and
QVGA resolutions with different space ratio k. The priority of each
packet is labeled by and aware of by the MAC layer.
1
2
3
4
k
20 30 35 40
k
= 4
k
= 2
k
= 1
E
b
/N
0
(dB)
Figure 19: A hierarchical constellation scheme for the best overall
PSNR performance using a selection of k value.
quality of the scalable video transmission. The optimization
strategy can be implemented in the timescale of 1 ms to
10 ms. The simulation results show 1.5 dB gain in E
b
/N
0
in
the single user scenario and 6 dB gain in PSNR (perceivable
quality of the scalable video) in two user scenario. Hierarchi-
cal modulation is proved to be a promising candidate for the
transmission system for scalable digital media.
Acknowledgment
The authors would like to thank Krishna Sankar because
the inspirations about how to calculate the generic bit error
probability over flat Rayleigh fading channel is from his web
site />12 EURASIP Journal on Advances in Signal Processing
References
[1] J R. Ohm, “Advances in scalable video coding,” Proceedings of
the IEEE, vol. 93, no. 1, pp. 42–56, 2005.
[2] A. Lallet, C. Dolbear, J. Hughes, and P. Hobson, “Review of
scalable video strategies for distributed video applications,”
in Distributed Imaging IEE European Workshop, vol. 1999, pp.
2/1–2/7, London, UK, 1999.
[3] H. Schwarz and D. Marpe, “D2.2:documentation of the Open-
Loop SNR-Scalable Video Coder,” M-PIPE, September 2005,
/>synopsis.htm.
[4] M. van der Schaar, S. Krishnamachari, S. Choi, and X. Xu,
“Adaptive cross-layer protection strategies for robust scalable
video transmission over 802.11 WLANs,” IEEE Journal on
Selected Areas in Communications, vol. 21, no. 10, pp. 1752–
1763, 2003.
[5] T. M. Cover, “Broadcast channels,” IEEE Transactions on
Information Theory, vol. 18, pp. 2–14, 1972.
[6] L F. Wei, “Coded modulation with unequal error protection,”
IEEE Transactions on Communications, vol. 41, no. 10, pp.
1439–1449, 1993.
[7] C. E. W. Sundberg, W. C. Wong, and R. Steele, “Logarithmic
PCM weighted QAM transmission over gaussian and Rayleigh
fading channels,” IEE Proceedings, vol. 134, no. 6, pp. 557–570,
1987.
[8] K. Ramchandran, A. Ortega, K. M. Uz, and M. Vetterli,
“Multiresolution broadcast for digital HDTV using joint
source/channel coding,” IEEE Journal on Selected Areas in
Communications, vol. 11, no. 1, pp. 6–23, 1993.
[9] M. Morimoto, H. Harada, M. Okada, and S. Komaki, “A study
on power assignment of hierarchical modulation schemes for
digital broadcasting,” IEICE Transactions on Communications,
vol. E77-B, no. 12, pp. 1439–1449, 1994.
[10] M. Morimoto, M. Okada, and S. Komaki, “A hierarchical
image transmission system in a fading channel,” in Proceedings
of the 4th IEEE International Conference on Universal Personal
Communications (ICUPC ’95), pp. 769–772, Tokyo, Japan,
November 1995.
[11] M. B. Pursley and J. M. Shea, “Nonuniform phase-shift-
key modulation for multimedia multicast transmission in
mobile wireless networks,” IEEE Journal on Selected Areas in
Communications, vol. 17, no. 5, pp. 774–783, 1999.
[12] M. B. Pursley and J. M. Shea, “Adaptive nonuniform phase-
shift-key modulation for multimedia traffic in wireless net-
works,” IEEE Journal on Selected Areas in Communications, vol.
18, no. 8, pp. 1394–1407, 2000.
[13] “DVB-T standard: ETS 300 744, digital broadcasting systems
for television, sound and data services; framing structure,
channel coding and modulation for digital terrestrial televi-
sion,” The European Telecommunications Standards Institute,
vol. 1.5.1, no. EN300, p. 744, 2004.
[14] C. Nokes and J. Mitchell, “Protential benefits of hierarchical
modes of the DVB-T specification,” in Proceedings of the IEE
Colloquium on Digital Television—Where Is It and Where Is It
Going? pp. 10/1–10/6, London, UK, 1999.
[15] P. Marsden, “Some thoughts on the use of hierarchical
modulation in dvb-t,” BBC Research and Development Whiter
Paper WHP 028, April 2002.
[16] H. Jiang and P. A. Wilford, “A hierarchical modulation for
upgrading digital broadcast systems,” IEEE Transactions on
Broadcasting, vol. 51, no. 2, pp. 223–229, 2005.
[17] J. Lu, K. B. Letaief, J. C I. Chuang, and M. L. Liou, “M-PSK
and M-QAM BER computation using signal-space concepts,”
IEEE Transactions on Communications, vol. 47, no. 2, pp. 181–
184, 1999.
[18] L L. Yang and L. Hanzo, “A recursive algorithm for the error
probability evaluation of M-QAM,” IEEE Communications
Letters, vol. 4, no. 10, pp. 304–306, 2000.
[19] M. P. Fitz and J. P. Seymour, “On the bit error probability of
QAM modulation,” International Journal of Wireless Informa-
tion Networks, vol. 1, no. 2, pp. 131–139, 1994.
[20] D. Yoon, K. Cho, and J. Lee, “Bit error probability of M-
ary quadrature amplitude modulation,” in Proceedings of IEEE
Vehicular Technology Conference (VTC ’00), vol. 5, pp. 2422–
2427, Boston, Mass, USA, September 2000.
[21] P. K. Vitthaladevuni and M S. Alouini, “BER computation of
4/M-QAM hierarchical constellations,” IEEE Transactions on
Communications, vol. 47, no. 3, pp. 228–239, 2001.
[22] J. G. Proakis, Digital Communications
, McGraw-Hill, New
York, NY, USA, 2001.
[23] S. Rappaport, “Computing approximations forthe generalized
Q function and its complement,” IEEE Transactions on
Information Theory, vol. 17, no. 4, pp. 497–498, 1971.
[24] P. Borjesson and C. E. Sundberg, “Simple approximations of
the error function Q(x) for communications applications,”
IEEE Transactions on Communications, vol. 27, no. 3, pp. 639–
643, 1979.
[25] S. A. Dyer and J. S. Dyer, “Approximations to error functions,”
IEEE Instrumentation and Measurement Magazine, vol. 10, no.
6, pp. 45–48, 2007.
[26] P. Van Halen, “Accurate analytical approximations for error
function and its integral,” Electronics Letters, vol. 25, no. 9, pp.
561–563, 1989.
[27] J. Shapiro, “Embedded image coding using zerotrees of wavelet
coefficients,” IEEE Transactions on Signal Processing, vol. 41,
no. 12, pp. 3445–3462, 1993.
[28] J. Medbo, “Channel models for hiperlan/2 in different indoor
scenarios,” ETSI BRAN 3ERI085B, March 1998.