Báo cáo hóa học: " Research Article Determining Number of Independent Sources in Undercomplete Mixture" potx
Bạn đang xem bản rút gọn của tài liệu. Xem và tải ngay bản đầy đủ của tài liệu tại đây (533.34 KB, 5 trang )
Hindawi Publishing Corporation
EURASIP Journal on Advances in Signal Processing
Volume 2009, Article ID 694850, 5 pages
doi:10.1155/2009/694850
Research Article
Determining Number of Independent Sources in
Undercomplete Mixture
Ganesh R. Naik and Dinesh K. Kumar
School of Electrical and Computer Engineering, RMIT University, GPO Box 2476V, Melbourne, VIC 3001, Australia
Correspondence should be addressed to Ganesh R. Naik,
Received 14 March 2009; Revised 28 July 2009; Accepted 2 September 2009
Recommended by Shoji Makino
Separation of independent sources using independent component analysis (ICA) requires prior knowledge of the number of
independent sources. Performing ICA when the number of recordings is greater than the number of sources can give erroneous
results. To improve the quality of separation, the most suitable recordings have to be identified before performing ICA. Techniques
employed to estimate suitable recordings require estimation of number of independent sources or require repeated iterations.
However there is no objective measure of the number of independent sources in a given mixture. Here, a technique has been
developed to determine the number of independent sources in a given mixture. This paper demonstrates that normalised
determinant of the global matrix is a measure of the number of independent sources, N, in a mixture of M recordings. It has
also been shown that performing ICA on N randomly selected recordings out of M recordings gives good quality of separation.
Copyright © 2009 G. R. Naik and D. K. Kumar. This is an open access article distributed under the Creative Commons Attribution
License, which permits unrestricted use, distribution, and reproduction in any medium, provided the original work is properly
cited.
1. Introduction
Blind Source Separation (BSS) consists of estimating the
original signals s, from a finite set of observations x, when
x is a result of mixing the original signals s. The estimation
is done without any prior knowledge of the sources (or
components) or the transmitting media. Independent Com-
ponent Analysis (ICA) [1–4]hasbecomeawidelyaccepted
technique to solve the BSS problem with applications in
medicine, communications, and image processing [5–7].
It is based on the assumption that the components are
independent and immobile.
There are two major issues associated with BSS; (i)
estimation of number of independent components (ICs) and
(ii) separation of the ICs. For conceptual and computational
simplicity, most ICA algorithms assume that the number of
components, N, is equal to the number of recordings,M,and
all of these components are independent. This results in a
square mixing matrix. This simplifies the estimation of the
mixing matrix A and the unmixing matrix W because square
matrices are invertible. However, for number of applications
this assumption is not accurate. If N is greater than M,
then the situation is referred to as “over-complete” while
when N is less than M, it is referred to as “undercomplete.”
In the overcomplete situation, performing ICA can result
in incorrect separation and poor quality [8], [9]. Bofill
and Zibulevsky [10] have developed techniques to identify
the number of ICs in a mixture for the over-complete
situation. While undercomplete situation has not been
studied extensively, it is often encountered for applications
such as sensor networks where the numbers of sensors may
often exceed the number of components such as in sensor
networks for environmental or defense monitoring, or when
the components are not independent [9, 11, 12].
Standard ICA techniques assume N
= M.Inan
undercomplete situation, N<M, but ICA algorithms are
inherently based on the assumption that N
= M and the
algorithm attempts to estimate more number of ICs than
actually exist. This can result in poor quality of separation.
To overcome this shortcoming, the number of recordings,
M, has to be reduced prior to the use of ICA. One method
for removing the redundant and dependent recordings is
to perform principal component analysis (PCA) on the
data matrix X and retain the N principal components
(PCs) from M recordings. This approach is based on prior
assumption of the number of ICs to be N which may be
2 EURASIP Journal on Advances in Signal Processing
only a guess in the true BSS situation. An improvement to
what previously mentioned has been proposed by Vrins et
al. [13] and is called selection PCA (sPCA). In sPCA, PCA
is preceded by selecting a subset of the mixtures from the
available ones using mutual information criterion. Although
the results using sPCA are better than using PCA, this does
not overcome the fundamental issue which is the need for
guessing the value of N. It requires the prior assumption
of the number of ICs and incorrect assumption can lead to
erroneous results.
Stone and Porrill [14] proposed an alternative approach
based on the maximisation of joint entropy of the output
and using correlation between output and input to recover
the ICs for undercomplete situation. This technique is an
iterative approach that minimises the correlation between
the inputs and outputs. However it requires the user to
identify a threshold of this value or assume the value of N.
Using the iterative approach, one IC is extracted at a time
until the correlation is below a prespecified threshold. This
is obviously a slow process and requires manual supervision
and not suitable for automation.
From the above, it is evident that for successful imple-
mentation of ICA when M>N(undercomplete), the
number of ICs has to be determined before attempting
IC separation. This paper proposes a new measure to
identify the number of ICs. Once the number of ICs,
N, is known, and based on the assumption of stationary
sources and linear mixing, randomly selecting N recordings
as an input to ICA is proposed to separate the ICs in
an undercomplete situation. The technique is a two-step
approach. In the first step ICA is performed on all the M
recordings to generate the global matrix, G. The determinant
of this matrix is used for obtaining K, the estimate of the
number of ICs, N, in the given M recordings. The next
step requires randomly selecting K out of M recordings and
performing ICA on these K recordings. A comparison of the
experimentally determined K with prior known N indicates
that the technique is a very good measure of the number
of independent sources in the recordings. A comparison of
this approach with the rank, R,ofG indicates that R is not
suitable for estimating N. The results also indicate that there
is a significant improvement of quality of separation of the
ICs when this approach is used.
2. Global Matrix Parameters of ICA
The hypothesis of this research is that the determinant of
the Global matrix, G, based on ICA performed on the M
recordings can be used to identify dependence between the
components. When using synthetic data, the mixing matrix,
A, is known, and G is the product of the mixing matrix A
and estimated unmixing matrix W,orG
= W ∗ A. In real
situations, when A is not known, G can be estimated from
the product of the unmixing matrix of subband, p and the
inverse of the unmixing matrix of subband, q [6]:
G
pq
= W
p
×W
−1
q
. (1)
If the number of recordings, M
= N (number of ICs), and
the separation is accurate, then G will be sparse and in ideal
case, G
= I, unity matrix (but for ICA order ambiguity). The
mixing matrix and the unmixing matrix would be square and
of size M
×M. Based on the independence criterion, the |G|
(determinant of G) would be unity after normalization, G
= 1(normofG)[15].
When M>N, then the mixing matrix is a rectangular
matrix of size M
× N, denoted by A
1
.However,when
ICA estimates the unmixing matrix, it estimates a square
matrix of size M
×M. This unmixing matrix, denoted by W,
corresponds to the mixing matrix, A of size M
×M. There are
(M
− N) extra columns in the matrix, A compared with A
1
.
The extra columns correspond to the nonexistent sources, s
i
and the elements of these columns will be zero. Because of the
iterative nature of ICA, the elements of these columns will be
approximately zero and not exactly zero. When a matrix has
one or more zero columns, its determinant is zero, and hence
the determinant of the mixing matrix
|A|≈0. Since G is a
product of W and A,andwhen
|A|≈0 =⇒ |G|≈0. (2)
In real situations, the number of sources is not known,
and only the number of recordings, M, is known. If
|G|≈
0 indicates that either |A|≈0or|W|≈0. |W|≈0isa
trivial outcome and thus can be ignored, and hence
|G|≈0
indicates
|A|≈0. When |A|≈, there is no true inverse of
A which means that there is no good estimate of W and the
estimation of s
= A
−1
x would be erroneous. The obvious
outcome when ICA is used in such a situation would be that
the quality of separation would be poor.
From the above, it can be stated that if
|G|≈0, then
|A|≈0. This indicates that one or more column of |A|
are zero columns, and the mixing matrix is rectangular
matrix, A
1
of size M × N,withM
/
=N. Based on the earlier
assumption that this is not an overcomplete issue, this
indicates that M>N. Thus
|G|≈0 indicates that M>N
while
|G|≈1 would indicate that M = N.However,ICA
is associated with scaling ambiguity. To overcome this, the
normalized values of
|G|, G have been considered in this
research.
Experimental results indicate that when M
= N (the
number of sources and the number of recordings are same)
G≈1 while when M>NG≈0. The results
also indicate that
G becomes closer to zero with an
increase in the difference, M
− N. G is an indicator of
the number of ICs, with the smaller value of
G indicating
less independence between the estimated sources, and if
there is only one IC,
G is nearly zero. The experimental
results indicate a close relationship of
G with the number
of dependent components in a mixture and can be used
to obtain K, the estimate of N in the given M number of
recordings.
G falls is a narrow range for a given number
of dependent sources in a mixture, and this range is not
sensitive to the number of recordings M. A comparison of the
experimentally obtained K with N indicates that K is indeed
a very good estimate of N.
The step mentioned above uses ICA to estimate the
numberofICs,andanotherstepisrequiredtoseparate
the ICs from the mixture. Based on the assumption of
EURASIP Journal on Advances in Signal Processing 3
Table 1: Criterion of mixing sources to generate the four record-
ings.
Criterion Sources
Recordings for
i
= 1toM
M independent
components (all
independent)
Four
independent
audiofiles
s
1
, s
2
, s
3
,ands
4
(N = M)
x
i
=
a
i,1
s
1
+ a
i,2
s
2
+
a
i,3
s
3
+ a
i,4
s
4
,
for i
= 1to4
M −1
independent
and one
dependent
components
Three
independent
audiofiles s
1
, s
2
,
and s
3
(N = M −1)
x
i
=
a
i,1
s
1
+ a
i,2
s
2
+
a
i,3
s
3
+ a
i,4
s
1
,for
i
= 1to4
M-2
independent
and two
dependent
components
Two
independent
audiofiles s
1
and
s
2
(N = M −2)
x
i
=
a
i,1
s
1
+ a
i,2
s
2
+
a
i,3
s
2
+ a
i,4
s
1
,for
i
= 1to4
N=1, all
dependent
components
Only one
independent
audiofile s
1
(N = 1)
x
i
=
a
i,1
s
1
+ a
i,2
s
1
+
a
i,3
s
1
+ a
i,4
s
1
,for
i
= 1to4
0.0001
0.001
0.01
0.1
1
G
1234
Dependency levels
M
= 4
M
= 6
M
= 8
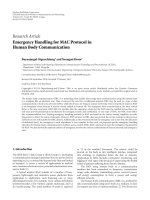
Figure 1: Logarithmic plot G against dependency levels.Depen-
dency level 1 corresponds with N
= M, 2 corresponds with N =
M − 1, 3 corresponds with N = M − 2, and 4 corresponds with
N
= 1.
linearity of the mixing matrix, any (randomly selected) K
out of M recordings should be suitable for estimating the
original signals s without any need for assuming that all the
components are independent. This eliminates the need to use
PCA, correlation, or other methods to remove the redundant
recordings. While this methodology is suitable for being used
with all ICA techniques, this paper reports the use of FastICA
[3, 16] to estimate the ICs from the mixture.
3. Methodology
Two sets of experiments were conducted. The first exper-
iment was for determining the relationship between the
G and the number of ICs, N, given M recordings, and
M>N. The second experiment was conducted to test
the hypothesis that once the number of ICs, N, is known,
ICA can be used to separate any N recordings to get
good estimate of the original signals. Each experiment was
repeated 10 times. The details of the experiments are given
below.
Experiment 1. Experiments were conducted using M syn-
thetically mixed recordings according to Table 1,withM
=
four, six, and eight and with N number of independent
audiofiles, N
= two, four, six, and eight. Using FastICA,
M
× M global matrix, G, was generated and the |G| was
computed. The above was repeated ten times while the
mixing conditions (matrix) were unchanged. Even though
the recordings were unchanged, due to the iterative nature
of ICA the outcome was different for each repetition.
|G|was
normalized using Frobenius Norm to obtain
G.Frobenius
norm is widely used matrix norm and is based on the square
root of the sum of squares. It can be computed by several
equations such as
A
F
=
m
i=1
n
j=1
a
ij
2
=
trace
(
A
∗
A
)
=
min(m,n)
i=1
σ
2
i
,
(3)
where A
∗
denotes the conjugate transpose of A, σ
i
are the
singular values of A,andthetraceofasquarematrixA
is the sum of the elements on the main diagonal. The
Frobenius norm is submultiplicative and is very useful
for numerical linear algebra. This norm is often easier to
compute than induced norms and provides the most effective
normalization values.
The values of the mixing equations parameters (a
i,j
)were
in the range 0.4 to 0.9 and these values were changed for
each repeat. These experiments were repeated for the three
values of M and for the conditions of independency (N
=
M), single dependency (N = M − 1), double dependency
(N
= M − 2), and total dependency cases (N = 1), with the
simulation conditions shown in Table 1. Five sigma rule is
indicative of high precision and was applied to identify the
range
G corresponding to each condition. These values
have been tabulated in Ta ble 3 and were used to estimate K
for the second experiment.
Experiment 2. Experiments were conducted where M num-
ber of recordings with N number of independent sources
were separated using FastICA. The experiments were con-
ducted for M
= 4, 6, and 8 and for N = M (all independent)
and M
− 2 (dependent). The global matrix was estimated
using (1). The estimate of the numbers of ICs, K, was
obtained based on
G (see Ta ble 2), and K − N = error
in estimation was computed. The rank of the matrix, R, was
also computed and compared with the value of N.
4 EURASIP Journal on Advances in Signal Processing
Table 2: Average and standard deviation of G for the four criterions.
Criterion Average G
M = 4 M = 6 M = 8Average
Independent 0.558
±0.024 0.462 ±0.02 0.38 ±0.016 0.467
Single dependency 0.057
±0.02 0.048 ±0.002 0.03 ±0.002 0.045
Double dependency 0.0077
±0.0007 0.004 ±0.0001 0.003 ±0.0002 0.0049
All dependent 0.0007
±7E-05 0.0004 ±2E-05 0.0003 ±1E-05 0.000467
Table 3: Normalized determinant conditions of global matrix for source dependency.
Dependency levels Source de pendency G conditions
1 N = M (all independent sources) 1 > G > 0.3
2 N
= M −1 (one dependent source) 0.08 > G > 0.03
3 N
= M −2 (two dependent sources) 0.008 > G > 0.003
4 N
= 1 (all dependent sources) 0.0008 > G > 0003
The next step was the random selection of N out
of the M recordings. Experiments were conducted where
the source separation using FastICA was done on the
M number of recordings and this was repeated with N
number of recordings. Signal to Interference Ratio (SIR) [6]
was computed to determine the quality of separation. The
average of the results of each repetition was computed and
this has been reported.
4. Results and Observations
Experiment 1. The values of G have been tabulated in
Ta ble 2 for all the four dependence categories and for M
= 4,
6, and 8. These values have been plotted on a log-scale plot
in Figure 1. It is observed that as the dependency increases
between sources, the value of
G decreases logarithmically
for all M (4, 6, and 8).
Statistical analysis was conducted to determine the
significance of the experimental outcomes. A result is
statistically significant if it is unlikely to have occurred
by chance. Statistical significance is the probability of
incorrectly rejecting the null hypothesis (Type I error, or
false positive determination). This decision can be made
by testing the value of P to be less than the significance
level. P-values of .05 correspond to a 5% chance of incorrect
rejection. While there is no definite rule for determining
the threshold for the value of P, .05 is the most commonly
used threshold for similar works and has been used in this
research. The results of statistical analysis of the data indicate
that the relationship between M and
G is significant
(P<.05).
From Ta ble 2 it is also observed that there is a small
reduction in the value of
G with increase in M. Statistical
analysis on each of the data sets demonstrates that this
relationship is not significant (P>.05). The range of
G
values corresponding to the source dependency conditions
based on the five-sigma rule has been tabulated in Table 3 .
These conditions were applied to the experiment 2 to
estimate the K values.
Results—Experiment 2. For the different values of M and
dependency conditions, error in the estimated value of ICs
has been tabulated in Ta bl e 4. For comparison, the error
based on rank of the matrix has also been tabulated. The
error based on the proposed technique, K
− N, error based
on the rank of the matrix, R
− N, average and standard
deviation of the
G and SIR of the separated signals (in dB)
have been tabulated in Tab le 4(a). Ta b le 4(a) has the results
when ICA was performed on all M recordings and M>N
and Table 4(b) has the results when ICA was performed on
only N randomly selected recordings. From Tabl e 4(a) it is
observed that estimate of N based on K resulted in an average
error of 1, much smaller than error based on the rank of the
matrix, R, which was 2.8. From Tabl e 4(a), it is also observed
that the average SIR value for M recordings is 11.21 dB
(range 9.1 dB to 13.8 dB) and average
G is 0.02436 (SD
0.00195) when ICA was performed on all M recordings and
M>N.
From Ta b le 4(b), it can be observed that when ICA is
performed on N recordings, there is a marked improvement
in the quality of separation, and the SIR is 18.02 dB (range
17.32 dB to 19.84 dB) and
G is 0.461 (SD 0.00048). The
estimate of N is not relevant in this table. From Tables 4(a)
and 4(b), it is also observed that the higher the quality of
separation of the outcomes, the higher the value of
G.
While the value of
G was 0.004 when SIR was 9.1 dB, G
was 0.496 when SIR was 19.8 dB.
5. Conclusion
Successful use of independent component analysis (ICA)
to separate the independent components (ICs) requires
the number of ICs to be prior determined. Without this
information, the outcome of ICA can result in poor quality
of separation. This paper has proposed and verified the use
of
G (G is the global matrix generated by ICA) to identify
the number of ICs in a given mixture. The results indicate
that this method can also be used to determine the quality of
separation.
EURASIP Journal on Advances in Signal Processing 5
Table 4
(a) Error in estimated number of ICs using G, and using rank of the matrix, Mean and Standard deviation of G and mean SIR when ICA is
performed on all the M recordings for different undercomplete situation.
MNK − NR−N G Mean SIR
42020.0077 ±0.0007 11 dB
64020.0061
±0.0001 11.8 dB
62240.004
±0.00142 9.1 dB
86120.048
±0.00043 13.8 dB
84240.056
±0.0032 10.34 dB
Average 3.6 1 2.8 0.02436
±0.00195 11.21 dB
(b) Error in estimated number of ICs using G, and using rank of the matrix, Mean and Standard deviation of G and mean SIR when ICA is
performed on N number of randomly selected recordings.
MNK − NR−N G Mean SIR
42000.485 ±0.00012 19 dB
64000.452
±0.00032 18.51 dB
62000.496
±0.000273 19.84 dB
86000.384
±0.00104 17.32 dB
84000.418
±0.00016 18.02 dB
Average 0 0 0.461 18.54 dB
This paper has proposed a two-step approach of source
separation when the number of sources is not known. The
first step requires running ICA on the M recordings and
determining the number of ICs, N in M recordings based
on determinant value of G. The second step is to run ICA
again, this time on a random selection of N out of the
M recordings. The results indicate a marked improvement
of the quality of separation compared to using ICA on
all M recordings. This technique is not based on any
assumptions regarding the number of ICs in the mixture.
In the present form, this is based on the commonly held
assumptions related to the applicability of ICA; that is, (i)
the mixing matrix is linear and stationary and (ii) the noise
level is low. This outcome of this research can be directly
applied for blind source separation problems, where the
number of sources is not known. The measure of quality of
separation is very relevant in situations where it is difficult
to estimate the quality of separation, such as in biosignal
applications.
References
[1] P. Comon, “Independent component analysis, a new concept?”
Signal Processing, vol. 36, no. 3, pp. 287–314, 1994.
[2] A. J. Bell and T. J. Sejnowski, “An information-maximization
approach to blind separation and blind deconvolution,”
Neural Computation, vol. 7, no. 6, pp. 1129–1159, 1995.
[3] A. Hyv
¨
arinen, K. Karhunen, and E. Oja, Independent Compo-
nent Analysis, John Wiley & Sons, New York, NY, USA, 2001.
[4] J F. Cardoso, “Infomax and maximum likelihood for blind
source separation,” IEEE Signal Processing Letters, vol. 4, no.
4, pp. 112–114, 1997.
[5] C. J. James and C. W. Hesse, “Independent component analysis
for biomedical signals,” Physiological Measurement, vol. 26, no.
1, pp. R15–R39, 2005.
[6] A. Cichocki and S. Amari, Adaptive Blind Signal and Image
Processing, John Wiley & Sons, New York, NY, USA, 2002.
[7]S.Makeig,A.J.Bell,T.P.Jung,andT.J.Sejnowski,
“Independent component analysis of electroencephalographic
data,” in Advances in Neural Informations Processing System,
vol. 8, pp. 145–151, 2001.
[8] M. S. Lewicki and T. J. Sejnowski, “Learning overcomplete
representations,” Neural Computation, vol. 12, no. 2, pp. 337–
365, 2000.
[9] T W. Lee, M. S. Lewicki, M. Girolami, and T. J. Sejnowski,
“Blind source separation of more sources than mixtures using
overcomplete representations,” IEEE Signal Processing Letters,
vol. 6, no. 4, pp. 87–90, 1999.
[10] P. Bofill and M. Zibulevsky, “Underdetermined blind source
separation using sparse representations,” Signal Processing, vol.
81, no. 11, pp. 2353–2362, 2001.
[11] S I. Amari, “Natural gradient learning for over- and under-
complete bases in ICA,” Neural Computation, vol. 11, no. 8,
pp. 1875–1883, 1999.
[12] M. Joho, H. Mathis, and R. H. Lambert, “Overdetermined
blind source separation: using more sensors than source
signals in a noisy mixture,” in Proceedings of 2nd International
Conference on Independent Component Analysis (ICA ’02),pp.
81–86, Helsinki, Finland, June 2002.
[13] F. Vrins, J. A. Lee, M. Verleysen, V. Vigneron, and C. Jutten,
“Improving independent component analysis performances
by variable selection,” in Proceedings of the 13th Workshop on
Neural Networks for Signal Processing, pp. 359–368, 2003.
[14] J. V. Stone and J. Porrill, “Undercomplete independent
component analysis for signal separation and dimension
reduction,” Tech. Rep., Department of Psychology, University
of Shefield, 1998.
[15] C. D. Meyer, Matrix Analysis and Applied Linear Algebra,
Cambridge University Press, Cambridge, UK, 2000.
[16] A. Hyv
¨
arinen, “Fast and robust fixed-point algorithms for
independent component analysis,” IEEE Transactions on Neu-
ral N etworks, vol. 10, no. 3, pp. 626–634, 1999.