Báo cáo hóa học: "Research Article Comparative Study of Local SAD and Dynamic Programming for Stereo Processing Using Dedicated Hardware" ppt
Bạn đang xem bản rút gọn của tài liệu. Xem và tải ngay bản đầy đủ của tài liệu tại đây (4.69 MB, 18 trang )
Hindawi Publishing Corporation
EURASIP Journal on Advances in Signal Processing
Volume 2009, Article ID 914186, 18 pages
doi:10.1155/2009/914186
Research Article
Comparative Study of Local SAD and Dynamic Programming for
Stereo Processing Using Dedicated Hardware
John Kalomiros
1
and John Lygouras
2
1
Department of Informatics and Communications, Technological Educational Institute of Serres, Terma Magnisias, 62124 Serres, Greece
2
Section of Electronics and Information Systems Technology, Department of Electrical Engineering & Computer Engineering,
School of Engineering, Democritus University of Thrace, 67100 Xanthi, Greece
Correspondence should be addressed to John Kalomiros,
Received 13 July 2009; Revised 2 October 2009; Accepted 30 November 2009
Recommended by Liang-Gee Chen
The processing results of two stereo accelerators implemented in reconfigurable hardware are presented. The first system
implements a local method to find correspondences, the sum of absolute differences, while the second uses a global approach
based on dynamic programming. The basic design principles of the two systems are presented and the systems are tested using
a multitude of reference test benches. The resulting disparity maps are compared in terms of rms error and percentage of bad
matches, using both textured and textureless image areas. A stereo head is developed and used with the accelerators, testing their
ability in a real-world experiment of map reconstruction in real-time. It is shown that the DP-based accelerator produces the best
results in almost all cases and has advantages over traditional hardware implementations based on local SAD correlation.
Copyright © 2009 J. Kalomiros and J. Lygouras. This is an open access article distributed under the Creative Commons Attribution
License, which permits unrestricted use, distribution, and reproduction in any medium, provided the original work is properly
cited.
1. Introduction
Real-time stereo vision is used in robot navigation, object
recognition, environmental mapping, virtual reality, and so
forth. The purpose of stereo processing algorithms is to find
corresponding points in images acquired by a system of two
or multiple cameras. Once reliable correspondences between
image pixels are established, the problem of depth extraction
is solved by triangulation [1].
Stereo algorithms can be classified into either local or
global methods of correspondence [2]. Local methods match
one small region around a pixel of interest in one image with
a similar region in the other image by searching along epipo-
lar lines. Typical similarity metrics used in local methods
are the normalized cross-correlation (NCC), and the sum of
squared differences (SSD) with its variation the sum of abso-
lute differences (SAD), which is often used for computational
efficiency. SSD and SAD find correspondences by minimiz-
ing the sum of squared or absolute intensity differences in
small windows along epipolar lines. Local methods can be
efficient but they are sensitive to noise and to local ambigui-
ties, like occlusion regions or regions of uniform intensity.
Global methods compute disparities over a whole scan
line or a whole image by minimizing a global cost function.
They provide a best solution for the correspondence problem
and minimize wrong matches at regions difficult to be
matched locally [3]. They compute dense disparity maps
of good quality but are computationally expensive and are
seldom applied in real-time implementations. Commonly
used global algorithms for stereo matching are based on
dynamic programming (DP) [4, 5]. The method consists of
two phases, the cost matrix building phase and the back-
tracking phase, where the actual disparities are computed.
Real-time dense stereo is difficult to be achieved with
general purpose serial processors and is often implemented
using dedicated hardware, like Digital Signal Processors
(DSPs), Graphics Processing Units (GPUs), and Application
Specific Integrated Circuits (ASICs). Several systems are pro-
totyped targeting Field Programmable Gate Arrays (FPGAs).
Gate arrays are reconfigurable devices and represent an
efficient solution for accelerating complex image processing
functions, because they are based on a structure of small logic
circuits that allows parts of an algorithm to be processed in
parallel.
2 EURASIP Journal on Advances in Signal Processing
This paper presents the basic design and processing
results obtained by two different hardware accelerators
dedicated to stereo matching. Both systems are implemented
using Field Programmable Gate Arrays (FPGAs). The first
is a stereo processor based on correlations between local
windows, using the typical SAD metric. The other is based
on global matching, applying a hardware-efficient variation
of a dynamic programming (DP) algorithm. The choice
to parallelize and comparatively evaluate SAD and DP in
hardware is straightforward. SAD employs a hardware-
friendly metric of similarity and exploits the intrinsic
parallelism of comparisons between local windows [6, 7].
The main processing pipeline can be also used in order to
implement other local methods of correspondence based on
data-parallel window correlation. On the other hand, DP
is a method commonly used for semiglobal optimization
along a whole scanline. Its recursive cost plane computations
are challenging to map in hardware because they lack
inherent parallelism. When implemented in software the DP
algorithm produces better disparity maps than SAD but it is
much slower and difficult to perform in real-time. Although
DP is more demanding than SAD to parallelize, it can be
more straightforward and less expensive than other global
methods like belief propagation or graph cuts.
A novel technique is presented in this paper for the
parallelization of DP cost matrix computations within a
predetermined disparity range. In both SAD and DP systems,
matching is performed along epipolar lines of the rectified
stereo pair. In both systems, matching cost is aggregated
within a fixed 3
× 3 window using the intensity difference
metric. In addition to plain SAD a hardware implementation
of left-right consistency check is presented and a hardware
median filter is used to enhance the disparity map. The sys-
tem implementing dynamic programming is also enhanced
by incorporating interscanline support. Both systems can
process images in full VGA resolution and are able to produce
8-bit dense disparity maps with a range of disparities up to
64 levels. Both hardware designs are appropriate for real-time
stereo processing, nominally producing hundreds of frames
per second. However, they differ considerably in their basic
design principles and in the quality of the final disparity
maps.
For the assessment of the systems a hardware/software
platform is developed, which is suitable to prototype and
test image processing functions. The assessment of the two
systems is performed using a number of reference images
from the “Middlebury set”, by comparing to the ground
truth. A carefully adjusted stereo head developed in the
laboratory is also used for real-time scene reconstruction, by
extracting appropriate image features from the stereo pair.
The paper is organized as follows. In Section 2 a descrip-
tion of SAD and the proposed version of dynamic pro-
gramming stereo algorithm is given. The hardware design of
both systems is presented. In Section 3 the hardware/software
platform used to prototype and assess the accelerators is
presented. In Section 4 many reference images are processed
and the results produced by the hardware accelerators are
compared. The quality of the disparity maps is evaluated in
termsofbadmatchesandrmserrorbycomparingtothe
ground truth. Regions with rich texture as well as textureless
regions of the images are used for this purpose. In Section 5
the two systems are compared in a real-world mapping
experiment. Section 6 is a comparison with other systems
found in the literature and Section 7 concludes the paper.
2. Hardware Principles of SAD and DP Stereo
2.1. SAD Algorithm and Hardware Principles. SAD represents
a wide range of techniques that find correspondences by
comparing local windows along epipolar lines in left and
right images of the stereo pair [2]. It has been implemented
in recent [6, 7] and early hardware systems for real-time
stereo [8, 9] and has the advantage of a particularly simple
and hardware-friendly metric of similarity, namely, the sum
of absolute differences:
u,v
I
1
u + x, v + y
−I
2
u + x + d, v + y
.
(1)
I
1
and I
2
refer to intensities in the left and right image, (x, y)
is the central pixel in the first image, (x + d, y) is a point on
the corresponding scanline in the other image displaced by d
with respect to its conjugate pair, and u, v are indices inside
the window. The point that minimizes the above measure
is selected as the best match. This metric reduces hardware
requirements only to additions and subtractions between
intensities in the local windows.
While this method requires laborious search along
epipolar lines in serial software implementations, it can be
parallelized easily in hardware, allocating parallel compar-
isons between local windows to a number of processing
elements. The block diagram of our system is shown in
Figure 1. Window-level parallelism is applied across 32 and
up to 64 levels of disparity, as shown in Figure 1,fora
3
× 3 window. The main processing element is shown in
Figure 2 for a simplified case where comparisons are between
3-pixels in line1 of image1 and 3-pixels on the same line
in image2. The shift between pixels and lines in order to
form appropriate windows is achieved using delay lines. For
example, a shift of a whole scanline between pixels in a
rectangular window needs a 640-pixel-deep shift register,
for an image with resolution 640
× 480. A number of D
processing elements are needed for D-levels of disparity.
After the D SADvaluesareproducedinparallel,
their minimum value is found, using an array of parallel
comparators that produce the minimum SAD in one clock
cycle. A fully parallel implementation of this stage needs
D
×D comparators and demands a lot of hardware resources.
However, it can also be implemented in several stages
grouping together a number of SAD values and pipelining
their output to the next stage of minimum derivation. This
hardware derivation of minimum values is central in our
implementation of SAD and is also used efficiently in our
implementation of DP.
A tag index numbered from 0 to D is attributed at
each pixel in the search region. Among all D pixels in
the search region one pixel wins, corresponding to the
minimum SAD value. The tag index of the winning pixel is
EURASIP Journal on Advances in Signal Processing 3
Image left
Image right
3
×3
window
line buffer
3
×3
window
64-pixel-
deep
line buffer
.
.
.
SAD0
SAD1
SAD63
Parallel
minimum
f (min)
0
1
2
.
.
.
63
[0
···63]
Disparity
Figure 1: Parallel comparisons between 3 ×3 windows in left and right image, in a hardware implementation of the SAD algorithm.
Image1 [7 : 0]
Image2 [7 : 0]
1
2
i 7:0
i 7:0
1
z
1
z
1
z
1
z
[Line 1a]
−
+
+
−
+
+
−
+
+
| a |
|
a |
|
a |
o9 : 0
+
+
+
+
Output
1
SAD[9 : 0]
Figure 2: A simplified version of the basic processing element in the parallel computation of SADs.
derived and equals the actual disparity value. Details of this
implementation can be found in [10].
2.2. Left-Right Consistency Check. An enhancement of the
above system was designed in order to implement left-
right consistency check. Pixels passing the consistency check
are high confidence matches while those failing the test
are considered bad matches or belong to occluded regions.
SAD-based left-right consistency check can be implemented
in hardware using an additional block for minimum SAD
computations, as shown in Figure 3. Blocks in the first row
output disparities with reference to the right image of the
stereo pair. Each right pixel B is compared with all left pixels
A
–C
hosted in the delay line, as shown in Figure 4(a).
Blocks in the lower stages of Figure 3 output disparities with
respect to the left image. In order to compare a left pixel
with all candidate right pixels in the range of disparities it
is imperative to mirror scanlines and reverse their ordering,
as shown in Figure 4(b). In this way all candidate right pixels
C–A are hosted in the delay line when left pixel B
arrives for
comparison.
The mirroring effect can be produced using on-chip
RAM memory. Each N-pixel-wide scanline is written into
memory in the first N clock cycles and is read out of memory
in a Last-In First-Out (LIFO) manner. LIFO-1 memory
blocks in Figure 3 are implemented as pairs of dual-port
RAM blocks. An even scanline is read from RAM-2 while
an odd scanline is written in RAM-1 at the same time. RAM
blocks alternate their read/write state every next scanline. In
this way, streaming scanlines are mirrored at the output of
LIFO-1 blocks at clock rate.
In order to compensate for the mirroring function
applied in the input stage of the lower left- right comparison
blocks, a LIFO-2 memory block is used at the output of the
right-left comparison blocks. In this way both disparity maps
are in phase.
Median filtering of the output disparity maps can
substantially improve the final result. Figure 5 shows part of
our hardware mapping of a 3
× 3 median filter designed for
this purpose. Pixels are ordered by pairwise comparisons in
nine subsequent steps and the median is selected.
The final consistency check between left-and right-
referenced disparity images is performed by a comparator
unit, as shown in Figure 6. The 32-pixel active range of
left-referenced disparities is hosted in a taps unit, while a
multiplexer selects the disparity element corresponding to
the current right-referenced disparity value. Left and right
disparities are compared and if found equal, the disparity
4 EURASIP Journal on Advances in Signal Processing
Right scanline
Left scanline
SAD1
LIFO-1
RAM 1
RAM 2
RAM 1
RAM 2
Disp-right
Left
Right
LIFO-2
RAM 1
RAM 2
SAD 2
Median
filter
Median
filter
Consistency
check
Disp-out
Figure 3: Block diagram of the SAD-based system with left-right consistency check.
ABC
Right
A
B
C
Left
32 p
tt
−32
(a)
ACB
Right
C
B
A
Left
(b)
Figure 4: (a) Pixel B on the right scanline is compared for similarity
with 32-pixels A
–C
of the left scanline stored in the delay line. (b)
Scanlines are mirrored for consistency check: Pixel B
on the left
scanline is compared with all 32-pixels C–A on the right scanline.
max
min
max
min
max
min
max
min
max
min
max
min
max
min
max
min
max
min
max
min
···
Median
e
d
c
b
a
.
.
.
a
b
max
min
a
b
<
Selection
0
1
0
1
max
min
Figure 5: Ordering circuit for the implementation of a median
filter. Elements shown in blue are redundant for the selection of the
median.
value is put out. If the two values differ, we transmit
the last left-referenced disparity value in order to correct
occlusion boundaries or bad matches. Significant corrections
at occlusion boundaries are found using this method.
Processing results using the SAD hardware accelerator are
presented in Section 4.
2.3. DP Algorithm and Hardware Principles. Dynamic pro-
gramming for stereo is mathematically and computationally
more complex than local correlation methods, since stereo
correspondence is derived as a globally optimum solution
for the whole scanline [4]. Our hardware system is designed
as a fully parallel implementation of a variation of the
Cox method for maximizing likelihood [5]. The algorithm
is developed in two phases, namely, the cost plane build-
ing phase and the backtracking phase. The cost plane is
computed as a two-dimensional matrix of minimum costs,
one cost value for each possible correspondence I
i
↔ I
j
between left and right image intensity values, along a scan
line. One always proceeds from left to right, as a result of
the ordering constraint [11]. This procedure is shown in
Figure 7, where each point of the 2D cost function is derived
as the minimum transition cost from the three neighbouring
cost values. Transition costs result from previous costs,
adding a matching or occlusion cost, s
ij
or occl, according
to the following recursive procedure:
C
(
i,0
)
= i × occl, (2)
C
(
0, i
)
= i × occl, (3)
C
i, j
=
min
C
i −1, j −1
+ s
ij
, C
i −1, j
+occl, C
i, j −1
+occl
.
(4)
In the above equations, the matching cost s
ij
is min-
imized when there is a match between left and right
intensities. The following dissimilarity measure was used
based on intensity differences:
s
ij
=
I
l
(
i
)
−I
r
j
2
σ
2
,
(5)
EURASIP Journal on Advances in Signal Processing 5
1
Disparities
right
2
Disparities
left
[Clock]
d
ena
7:0 4:0
BusConversion
Shift taps
31 taps
MUX
t0
t1
t2
t3
t4
t5
t6
t7
t8
t9
t10
t11
t12
t13
t14
t15
t16
t17
t18
t19
t20
t21
t22
t23
t24
t25
t26
t27
t28
t29
t30
Sel [4 : 0]
0
1
2
3
4
5
6
7
8
9
10
11
12
13
14
15
16
17
18
19
20
21
22
23
24
25
26
27
28
29
30
31
Multiplexer
z
−1
Delay
Comparator
a
b
==
Sel [0 : 0]
0MUX
1
Mplx
1
Consist
disp
Figure 6: Implementation of the left-right consistency check.
where σ represents the standard deviation of pixel noise.
Typical values are σ
= 0.05–0.12 for image intensities in the
range [0, 1]. In our implementation we calculate s
ij
within
afixed3
×3 window applied in both images. The occlusion
cost occl is the cost of pixel j in the right scanline being
skipped in the search for a matching pixel for i and in our
tests takes a value occl
= 0.2.
According to (2)–(4), the cost matrix computation is a
recursive procedure in the sense that for each new cost C(i, j)
the preceding costs on the same row and column are needed.
In turn, previous costs need their precedent costs, rendering
the parallel computation of costs an intractable task. In order
to parallelize the cost matrix computation in hardware, we
design a novel variation of the cost matrix computations,
using an adequate slice of the cost matrix along the diagonal
of the cost plane, as shown in Figure 7. Working along the
diagonal allows a subset of D cost states to result in parallel
from the preceding subset of cost states, in step with the input
stream of left and right image scanlines. Figure 7 shows a slice
along the diagonal supporting a maximum disparity range of
9-pixels. Starting from a known initial state (here C
1A
,C
00
,
C
2A
,C
2B
,C
2C
,C
2D
,C
2E
,C
2F
,C
2G
) lying on the axes and
given by (2)and(3)), it is possible to calculate all states in the
slice, up to the end of the cost plane, following the diagonal.
This computation is performed at each computation cycle
by setting as a next input the output computed in the
previous step. Figure 8 shows the cost matrix computation
more analytically. By taking three input states together and
adding occlusion or matching costs, the processing element
computes the cost of the diagonal, vertical and horizontal
path to each adjacent point. These costs are taken together
and the minimum value is produced by an appropriate
parallel-computation stage. Tag values are attributed to all
three possible paths. A tag “1” is attributed to the vertical
path, a tag “0” is attributed to diagonal paths, while a tag
value “
−1” is attributed to the horizontal path.
Wining tags at each point are stored in RAM memory
and are read in reverse order during backtracking, in order
to follow backwards the optimum path. RAM is written
during the cost-computation phase and is read during the
backtracking stage. The same LIFO RAM blocks used in
Figure 3 for mirroring the scanlines are also used here in
order to implement the backtracking stage. A number of
D RAM blocks are needed, where D represents the useful
disparity range (nine in the case of the state machine in
Figure 8). Each RAM block has a depth of N cells, where N
represents the length of scanline. All RAM cells are only 2-bit
wide, since they store the values
−1, 0, 1.
Stored tag values are used to calculate the change in the
disparity value per pixel during the backtracking phase. The
following rules are applied for the disparity computations
during backtracking.
Starting at the end of the cost plane (N, N), corre-
sponding stored tags are examined. The case of tag
= “1”
6 EURASIP Journal on Advances in Signal Processing
C
19
C
29
C
18
C
28
C
17
C
27
C
37
C
16
C
26
C
36
C
15
C
25
C
35
C
45
C
55
C
14
C
24
C
34
C
44
C
54
C
13
C
23
C
33
C
43
C
53
C
12
C
22
C
32
C
11
C
21
C
00
C
1A
C
1B
C
1C
C
2G
C
2F
C
2E
C
2D
C
2C
C
2B
C
2A
Right scanline
Left scanline
Figure 7: Cost plane and a slice along the diagonal. Nine states are
computed in parallel in this example.
corresponds to skipping a pixel in the left scanline and
to a unit increase in disparity. The case of tag
= “−1”
corresponds to skipping a pixel in the right scanline and
means a unit decrease in disparity, while the case of tag
= “0” matches pixels (i, j) and therefore leaves disparity
unchanged. Beginning with zero disparity, the minimum
cost path is followed backwards from (N, N), and the
disparity is tallied, until point (1, 1) is reached.
The above rules have been mapped in hardware by
arranging tag values in vertical columns corresponding to
the columns of the cost matrix in Figure 7. The main idea
is shown in Figure 9,whereeachcolumnofD tag values
corresponds to one pixel of disparity. All elements in a col-
umn are indexed starting from the bottom on the diagonal.
Entry and exit indices in the columns of Figure 9 trace the
path of minimum cost. In the proposed implementation D
parallel stages are used and DP backtracking rules are applied
to find the “exit” index for each column in one clock cycle.
This index is derived as the minimum of all indices in the
column that correspond to a tag value that is either “0” or
“
−1”. Upon exiting the previous column we enter the next by
moving either diagonally one step to the bottom (in the case
of tag
= 0) or horizontally (tag =−1). If we consider exit
to be the index of the exit point from the (i
−1)
th
column
and entry to be the index of the entry point to the i
th
column,
then the change in disparity at pixel i
th
is found using the
equation:
d
= exit −entr y.
(6)
Starting with d
= 0, the system tracks disparities adding d
at each step.
A block diagram of the overall system is shown in
Figure 10.
2.4. Interscanline Support in the DP Framework. The system
described above uses a two-dimensional cost plane and
optimizes scanlines independently. The problem can expand
as a search for optimal path in a 3D search space, formed as a
stack of cost planes from adjacent scanlines. The cost of a set
of paths is now defined as the sum of the costs of individual
paths.
A system with support from adjacent scanlines is imple-
mented and cost states are computed using in the place of (4)
the following relation:
C
i, j
=
min
⎧
⎨
⎩
1
k
max
k
max
1
C
k
i −1, j
+occl
,
1
k
max
k
max
k=1
C
k
i, j −1
+occl
,
1
k
max
k
max
k=1
C
k
i −1, j −1
+ s
kij
⎫
⎬
⎭
,
(7)
where k is the scanline index and k
max
is the maximum
number of adjacent scanlines contributing in the cost-
computation.
Just like in the case of using windows for cost aggregation,
the underlying hypothesis here is that adjacent points on the
same image column are connected and belong to the same
surface or object boundary. This additional interscanline
constraint provides more global support and can result in
better matching.
In order to provide support from one adjacent scanline,
the proposed system buffers the preceding scanline in a delay
line and streams both current and former scanlines through
the cost-building state machine. The cost-computation stage
is now enhanced according to (7)inordertoproduce
cost states for both streaming scanlines. Minimum cost-
computation and memory stages are implemented by the
same circuits as in the plain system. More scanlines can be
added by expanding the design in the same way.
Processing results using the DP hardware accelerator are
shown in Section 4.
3. Hardware/Software Codesign For
System Assessment
In order to assess the performance of the stereo accelerators
described in Section 2 a host/coprocessor architecture is
EURASIP Journal on Advances in Signal Processing 7
+occl
+occl
+occl
+occl
+occl
+occl
+occl
+occl
+occl
+occl
+occl
+occl
+occl
+occl
+occl
+occl
+occl
+occl
+occl
+occl
+occl
+occl
+occl
+occl
+occl
+occl
Initial
states
Next states
after one iteration
C
2G
+2occl
C
1A
+2occl
States
afterfouriterations
C
2H
+2occl
C
43
+2occl
C
2G
C
2F
C
2E
C
2D
C
2C
C
2B
C
2A
C
00
C
1A
C
2G
C
2F
C
2E
C
2D
C
2C
C
2B
C
2A
C
11
C
1A
C
2G
C
2E
C
2C
C
12
C
21
+s
+s
+s
+s
+s
+s
+s
+s
+s
C
2H
C
17
C
16
C
26
C
25
C
35
C
34
C
44
C
34
C
18
C
17
C
27
C
26
C
36
C
35
C
45
C
44
C
54
+s
+s
+s
+s
+s
Figure 8: Initial state and successive derivation of next states with a nine-state processing element.
9
8
9
8
7
6
5
4
3
2
1
9
8
7
6
5
4
3
2
1
−1
0
−1
1
1
1
−1
−1
−1
0
−1
0
−1
1
0
1
1
1
i
i
−1
Columns
Figure 9: Tag values (−1, 0, 1) arranged in columns and indexed
from 1 to D (here D
= 9) for the backtracking stage. Arrows indicate
exit and entry in successive columns.
developed. On the coprocessor side a Cyclone II FPGA pro-
totyping board, made by Altera Corporation, is used. This
boardfeaturesaCycloneII2C35medium-scaleFPGAdevice
with a total capacity of 33000 logic elements and 480000 bits
of on-chip memory. Apart from the stereo accelerator, we
use a Nios II embedded processor for data streaming and
control operations and a number of peripheral controllers in
order to interface with external memory and communication
channels. A block diagram of the embedded system is shown
in Figure 11.
On the host part a vision system is implemented,
appropriate for a spectrum of industrial applications. The
host computer features an on-board high speed USB 2.0
controller and a NI 1408 PCI frame grabber. The host
application is a LabVIEW virtual instrument (VI) that
controls the frame grabber and performs preprocessing of
the captured images. The frame grabber can support up to
five industrial cameras performing different tasks. In our
system, the VI application captures a pair of frames with
resolution up to 640
× 480-pixels from two parallel CCIR
analog B&W CCD cameras (Samsung BW-2302). Figure 12
is a picture of the stereo head along with the accelerator
board.
The LabVIEW host application communicates with the
USB interface and transmits a numeric array out of the
captured frames. An advantage of using LabVIEW as a basis
for developing the host application is that it includes a
VISION library able to perform fast manipulation of image
data.
When the reception of the image array is completed at the
hardware board end, the system loads the image data to the
dedicated stereo accelerator and sends the output to a VGA
monitor. Alternatively, the output is sent back to the host
application via the USB 2.0 channel for further processing.
The procedure is repeated with the next pair of captured
frames.
8 EURASIP Journal on Advances in Signal Processing
Left scanline
Right scanline
Input
pixel
buffer
Initial
states
Previous
states
Clocks
Cost-plane
computation
Next states
Min-cost
tag values
−1, 0,1
Rd/wr
RAM 1
RAM 2
LIFO MEM
Backtracking
Column
buffer
Backtracking
rules
Δd
=
exit-entry
Disparities
Figure 10: Block diagram of the stereo system based on dynamic programming.
FPGA
Input buffer
DDR2
Accelerator
SRAM
buffer
DMA
Nios II
data streaming
control
DMA
SLS-USB20
IP core
Host computer
labVIEW
Figure 11: Hardware platform for the evaluation of the processors: system-on-a-chip and communication with host.
Typical images captured in the laboratory and the
resulting depth maps produced by hardware are presented in
Section 4.
4. Evaluation of SAD and DP Systems
Both SAD and DP accelerators are able to process up to 64
levels of disparity and produce 640
× 480 8-bit depth maps
at clock rate. Using appropriate pipelining between stages
the SAD processor can be clocked at 100 MHz which is the
maximum frequency allowed by the on-board oscillator. The
system outputs disparity values at a rate of 50 Mpixels/s and
processes a full VGA frame at a nominal time of 6.1 ms. This
is equivalent to 162 frames/s. The DP-based system has more
strict timing requirements because it uses feedback loops,
as for example in the cost matrix computation stage. The
higher possible frequency for our present implementation
is 50 MHz. A pair of 640
× 480 images is processed at
12.28 ms, which is equivalent to 81 frames/s or 25 Mpixels/s.
However, in a “normalized” sense both accelerators have the
same disparity throughput, since hardware optimization can
potentially resolve the timing issue. The reported throughput
of 50 Mpps is high and suitable for demanding real-time
applications, like navigation or environmental mapping.
Ta bl e 1 presents timing requirements and nominal frame
rates for both systems. In practice, apart from the accelerator
throughput, the frame rate depends also on the camera type
and other system parts.
EURASIP Journal on Advances in Signal Processing 9
Figure 12: The stereo head with the FPGA board.
Ta bl e 2 shows the average resources required from a
Cyclone II EP2C35 FPGA device in order to implement
the designs presented in Section 2 as FPGA processors. The
number of logic elements (LE) is given, along with necessary
on-chip memory bits. The table refers to the plain processors
and their enhancements described in Sections 2.2 and 2.4,
that is, SAD-based left-right consistency check and interscan-
line support for DP processing. In addition to the resources
needed for plain SAD implementation, left-right consistency
check requires RAM memory for the implementation of
the LIFO mirroring blocks. The DP accelerator requires on-
chip memory for the storage of minimum cost tag values,
but can be implemented with fewer logic elements than
SAD, allowing for larger disparity range. Nios II processor
and peripheral controllers require an additional overhead
of about 7000 LEs and 160000 bits of embedded memory.
In the last column of Tab l e 2 the equivalent gate count is
given and can be used for comparison with ASIC stereo
implementations. Gate count is inferred from the fitting
result of the design compiler and represents maximum
resource utilization within each logic element.
Increasing the range of disparities increases proportion-
ally the necessary resources for both SAD and DP archi-
tectures. Applying block reusing techniques could optimize
resource usage, but on the expense of processing speed.
Increasing image resolution has little effect on the resources
needed for SAD, since only two image lines are stored in on-
chip memory, in order to form the 3
× 3 window. However,
in our present DP system, increasing the length of scanline
increases proportionally the memory needed for the storage
of tag values.
Depth maps produced by the proposed SAD and DP
hardware systems are evaluated using a variety of reference
stereo datasets, produced in the laboratory by Scharstein and
Szeliski [12, 13]. Pixel-accurate correspondence information
is acquired using structured light and is available for all
datasets. Also, the reference image series available from the
Tsukuba University [14] is used in this evaluation.
First, processing results are presented using the plain
version of the SAD and DP accelerators, without their
enhancements. As it is explained in Section 2,inbothcases
the same intensity difference metric is used and matching
cost is aggregated within a 3
× 3 window. Both systems are
mapped in hardware using comparable resources. They both
represent a fully parallel version of the underlying algorithm
and produce disparities at clock rate. Also, they are assessed
using the same FPGA platform. Comparative results are
shown in Figure 13.EachrowofFigure 13 presents the left
image of the reference pair, the ground truth and the depth
maps produced by the plain SAD and DP hardware systems,
without their enhancements.
The main weaknesses of the two types of algorithms
become evident in their FPGA implementation. As shown in
Figure 13, in most cases SAD depth maps contain noise spots,
especially in image areas of low light intensity. Processing
results from the DP hardware show horizontal streaks caused
by the horizontal transmission of errors along epipolar lines.
This is because of the weak correlation between scanlines
in the DP system, since this processor does not yet include
interscanline support. In general, DP global matching is
more accurate and produces fine detail as compared to SAD.
However, in some images there is better object segmentation
in the depth map produced by the SAD accelerator, as in the
case of “bowling” and “sawtooth” images (Figure 13).
The quality measures proposed by Scharstein and Szeliski
[15] which are based on known ground truth data d
T
(x, y)
are used for further evaluation. The first measure is the
RMS (root-mean-squared) error between the disparity map
d
A
(x, y) produced by the hardware accelerator and the
ground truth map:
R
=
⎛
⎝
1
N
x,y
d
A
x, y
−d
T
x, y
2
⎞
⎠
1/2
,
(8)
where N is the total number of pixels in the area used for
the evaluation. RMS error is measured in disparity units.
The second measure is the percentage of bad matching pixels,
which is computed with respect to some error tolerance δ
d
:
B
=
1
N
(x,y)
d
A
x, y
−
d
T
x, y
>δ
d
.
(9)
For the tests presented in this paper a disparity error
tolerance δ
d
= 1isused.
The above measures are computed over the whole depth
map, excluding image borders, where part of the image is
totally occluded. They are also computed over selected image
regions, namely, textureless regions and regions with well-
defined texture. In this way conclusive statistics are collected
for both hardware processors, based on a variety of existing
test benches.
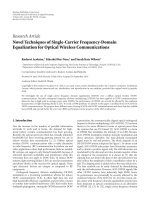
Figure 14 is a comparative plot that presents the above
statistical measures calculated over the whole image, for the
10 EURASIP Journal on Advances in Signal Processing
Table 1: Processing speeds for the SAD and DP accelerators.
Type of implementation Image resolution Maximum achieved frequency (MHz) Normalized throughput (Mpps) Frame rate(fps)
SAD 640 × 480 100 50 162
DP 640
×480 50 50 81
Table 2: Typical resources needed for implementing SAD and DP systems in FPGA.
Type of implementation Image resolution Levels of disparity Logic elements Memory bits
9-bit embedded
multipliers
Equivalent gate
count
SAD 320 × 240 32 12200 12176 — 290000
SAD 640
×480 64 24300 27200 — 594000
SAD + consistency check 320
×240 32 23900 37760 — 630000
Median filter 320
×240 — 676 5088 — 33500
DP 320
×240 33 9300 71792 33 530000
DP 640
×480 65 21500 270240 66 1600000
DP with support from
two adjacent scanlines
320
×240 33 15573 75088 66 740000
Nios II processor +on
chip memory
— — 2000 120000 — 520000
Other controllers — — 5000 40000 — 260000
SAD and DP hardware accelerators. The quality measures for
textured regions are presented in Figure 15. The statistics of
textureless regions are presented in Figure 16.Wedefinetex-
tureless regions as image areas where the average horizontal
intensity gradient is below a given threshold.
The error statistics presented in Figures 14, 15, 16
confirms in quantitative terms that the global matching
performed by the DP hardware accelerator produces more
reliable disparity maps than the block matching method used
by the SAD processor. This appears to be true for both types
of measures (R and B)andfordifferent kinds of image
regions.
Next, results were obtained using the enhanced accel-
erators. First, the system performing SAD-based left-right
consistency check was tested, using the “Tsukuba” and
“cones” reference images. As explained in Section 2.2, the
system produces consistent disparities with respect to the
right image and replaces occlusions with the last measured
left disparity. Figures 17(b) and 17(d) on the right are the
depth maps produced by the system shown in Figure 3, while
Figures 17(a) and 17(c) show for comparison the depth map
produced by the plain SAD processor, shown in Figure 1.
Matching at occlusion boundaries is visibly improved and the
overall depth map contains less noise due to median filtering
and replacement of bad matches.
The result produced by the enhanced version of the DP
accelerator is shown in Figures 18(b) and 18(d), while the
output of the plain DP system is shown for comparison
in Figures 18(a) and 18(c). As explained in Section 2.4,
this system has a multiple cost-computation stage, where
the cost planes of three adjacent scanlines are processed in
parallel and minimum cost is produced according to (7).
Taking into account a correlation between scanlines reduces
the horizontal streaking effect that is inherent in the line-
based global optimization. Attenuation of horizontal streaks
is mainly visible around object boundaries, as can be seen
in the “cones” depth map. Incorporating support from more
scanlines can further improve the result, however it expands
the design and can only be achieved by migrating to more
dense devices.
Next, the quality measure given by (9) is used for the
evaluation of the depth maps of Figures 17 and 18.The
measures are applied over the whole image and the statistics
presented in Figure 19 are obtained. The result reflects the
visible improvements in the depth maps.
Some discussion is needed concerning the robustness
of the above measures. RMS error and percentage of bad
matches obviously depend on the available ground truth
maps and the image area where they are applied. They
represent an indication rather than definitive evidence of
how “good” a stereo system is. Real stereo sensors work in
the absence of ground truth and by processing a familiar real
scene they can provide subjective evidence of the quality of a
stereo system. In addition to the evaluation presented above,
the stereo head shown in Figure 12 was used to capture and
process real scenes. A typical result is shown in Figure 20.
A captured image is followed by depth maps produced
by the plain and enhanced SAD and DP-based processors.
These results provide an additional quality measure for
the proposed systems. As shown in Figure 20,depthmaps
produced by the SAD processors are dominated by noise
spots, although median filtering and left-right consistency
check can improve the result. The DP-based system produces
smooth depth maps, accurate in most parts of the image.
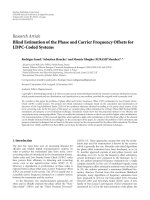
EURASIP Journal on Advances in Signal Processing 11
BooksArtTsukubaConesBowlingSawtooth
(a) (b) (c) (d)
Figure 13: Processing of reference datasets. From top to bottom: Books, Art, Tsukuba, Cones, Bowling, and Sawtooth data-sets. (a) Reference
test image, (b) ground truth, (c) processing by the SAD accelerator, and (d) processing by the DP accelerator.
Although some streaking effect is blurring object boundaries,
the overall subjective result is satisfactory. Object boundaries
can be refined by the same left-right consistency check
described in the case of the SAD processor, with substantial
cost in gate resources.
Migrating to larger FPGA devices can allow incorporat-
ing left-right consistency check as well as more interscanline
support in the DP framework. However, the cost and perfor-
mance of such a system should be compared with the cost of
implementing other global techniques for stereo processing.
12 EURASIP Journal on Advances in Signal Processing
Books Art Cones Bowling Tsukuba Sawtooth
SAD HW
DP HW
0
2
4
6
8
10
(a) Total image (rms error)
Books Art Cones Bowling Tsukuba Sawtooth
SAD HW
DP HW
0
0.1
0.2
0.3
0.4
0.5
0.6
0.7
0.8
(b) Total image (bad matches)
Figure 14: Error statistics computed over the whole image. (a) rms
error, (b) percentage of bad matching pixels.
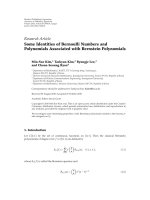
Books Art Cones Bowling Tsukuba Sawtooth
SAD HW
DP HW
0
0.5
1
1.5
2
2.5
3
3.5
4
4.5
(a) Textured regions (rms error)
Books Art Cones Bowling Tsukuba Sawtooth
SAD HW
DP HW
0
0.05
0.1
0.15
0.2
0.25
0.3
(b) Textured regions (bad matches)
Figure 15: Errors computed in textured regions for the various
data-sets. (a) rms error, (b) percentage of bad matching pixels.
5. Real-Time Scene Reconstruction with
SAD and DP Systems
In this paragraph the two systems are tested using a technique
for real-time scene reconstruction, with the movable stereo
head. A pair of gray-scale, 8-bit, left and right video
sequences is captured, and the depth map is produced in
real-time using the SAD and DP hardware, alternatively. A
robust feature extraction algorithm is developed in software
and is applied to process the captured frames in the time
between data transfers to and from the FPGA board. The
selected features are projected back to the world reference
frame, using a suitable transformation from image pixel
to real-world. At the end of the video sequence the real
scene is reconstructed by a cloud of points resulting from
the superposition of all projections from all video frames.
The result is noisy and depends on the type of the selected
features, however, it allows the hardware vision system to be
applied and tested in a real-world experiment, suitable for
robot navigation and mapping.
The feature extraction algorithm applied in this experi-
ment can be summarized as follows
(a) Corners are extracted from both left and right video
frames using the cross-section of horizontal and
vertical edges. A thinning procedure is applied and
the result is a pair of binary images with point
features.
(b) For each feature position (u
L
, v
L
) in the left image, we
look for a matching feature in the right image using
as a measure for correspondence the minimization of
the Euclidean distance between features:
E
=
(
u
L
−u
R
−d
)
2
+
(
v
L
−v
R
)
2
,
(10)
where (u
L
, v
L
) is the feature position in the left image,
(u
R
, v
R
) is the feature position in the right image, and
d is the disparity u
L
-u
R
of pixel (u
L
, v
L
), as derived by
the depth map.
The algorithm results in a limited number of matching
features for each video frame. Depending on the error
threshold E allowed in (10) the result can be several tens of
features per frame.
The feature position (u
L
, v
L
) on the image is translated
into a point (X
i
, Y
i
, Z
i
) in the frame of reference of the stereo
head, as shown in Figure 21, applying the relations:
X
i
=
fb
(
u
L
−u
R
)
, (11)
Y
i
=
1
f
X
i
(
u
L
−u
0
)
−
b
2
, (12)
Z
i
=
1
f
X
i
(
v
L
−v
0
)
, (13)
where f is the camera focal length measured in pixels, b is the
“baseline”, that is, the distance between left and right camera
focal axes, and (u
0
, v
0
) is the center of the image measured in
pixels. The focal length for both cameras is measured to be
EURASIP Journal on Advances in Signal Processing 13
Books Art Cones Bowling Tsukuba Sawtooth
SAD HW
DP HW
0
1
2
3
4
5
6
7
8
9
10
(a) Textureless regions (rms error)
Books Art Cones Bowling Tsukuba Sawtooth
SAD HW
DP HW
0
0.1
0.2
0.3
0.4
0.5
0.6
0.7
(b) Textureless regions (bad matches)
Figure 16: Errors computed in textureless regions for the various data-sets. (a) rms error, (b) percentage of bad matching pixels.
(a) (b)
(c) (d)
Figure 17: (b) and (d): Results from the SAD-based left-right consistency check. (a) and (c): Depth maps from the plain SAD system, shown
for comparison.
380-pixels, the baseline is 0.125 m, and the image centers are
positioned on the pixel (160, 120) since the image resolution
here is 320
× 240. No other calibration data are used in this
experiment. The final projection in the real-world frame is
given by a relative translation and rotation:
x
i
, y
i,
z
i
=
R +rot
ϕ
(
X
i
, Y
i
, Z
i
)
,
(14)
where ϕ is the angle between the reference frame of the stereo
head and the world frame.
R is the translation vector between
the camera reference frame, and the world frame. In this
experiment the stereo head is always horizontal.
The above procedure is applied indoors, in a typical
office environment. Figure 22 is a panoramic picture of the
captured scene. The stereo head rotates and traverses a total
arc of about 60 degrees, recording the scene. The experiment
lasts for ten seconds and at the end of this time a 3D cloud
of points is projected in the world frame, reconstructing the
scene according to (11)–(14).
A 3D graph of the resulting cloud of points is shown
in Figure 23(a), as constructed using the DP hardware for
the real-time computation of the depth map. The captured
features correspond to the chairs in the middle and to the two
bookshelves on the opposite and left wall, with respect to the
14 EURASIP Journal on Advances in Signal Processing
(a) (b)
(c) (d)
Figure 18: (b) and (d): Results from the DP system with interscanline support. (a) and (c): Results from the plain DP system shown for
comparison.
ConesTsukuba
Bad matches total image
Plain SAD
SAD + consistency check
Plain DP
DP + inter-scanline support
0
0.05
0.1
0.15
0.2
0.25
0.3
0.35
0.4
Figure 19: Comparison of the plain systems with the enhanced
processors in terms of bad matching pixels.
camera. The desks shown in Figure 22 are not captured in the
video sequence. A cross section presenting the x-z plane side
view is shown in Figure 23(b), where points are stacked along
the bookshelves on the right. The corresponding graphs
constructed using the SAD hardware are shown in Figure 24.
Both DP and SAD techniques produce a reliable map
of the environment, manifesting the main objects in their
approximate positions. It is obvious, however, that the DP
system results in more consistent correspondences and better
localization of features. The SAD map includes a number of
outlier points and presents fewer consistent features and a
more dispersed cloud of points.
Factors that affect the result of the above experiment
are (a) pixel noise due to camera limitations and poor
illumination, (b) the lack of a full calibration of the stereo
head, (c) inaccurate estimation of the camera angle ϕ at
each captured frame and (d) errors in the computation of
the disparity map by the hardware systems. However, error
sources a to c are common in both DP and SAD experiments.
Therefore, the differences in the maps presented in Figures
23 and 24 result solely from the differences in the hardware
accelerators used to produce the disparity maps in real-time.
The mapping technique presented above can be incor-
porated as the measurement part in a fast simultaneous
localization and mapping (Fast SLAM) stochastic procedure
for autonomous robot navigation. In this way, the camera
localization errors can be filtered out and an optimized
solution for simultaneous robot pose and map estimation
can be found in real-time.
6. Comparison with Other
Real-Time Stereo A ccelerators
Hardware acceleration of stereo processing is now established
in many applications and a number of real-time stereo
systems were presented in the literature in recent years.
Several systems were built using FPGA devices, like the Xilinx
Virtex series or the Altera Cyclone and Stratix families. As
already mentioned in Section 1 most such systems are based
on area correlation methods, using techniques like SAD
[6, 7] and rank transforms [16]. Ambrosch and coauthors
have recently implemented SAD-based stereo matching using
FPGAs [17]. They also implemented SAD, rank and census
transform with flexible block size and disparity range by
reusing resources [18]. Their synthesis results show a high
EURASIP Journal on Advances in Signal Processing 15
(a) (b) (c) (d) (e)
Figure 20: Processing of a real image with all types of processors: (a) right captured image, (b) processing with the plain SAD processor, (c)
left-right consistency check with median filtering, and (d) plain DP processor (e) DP with interscanline support.
P
X
Y
C
L
C
R
b
ff
P
L
P
R
u
L
u
R
Figure 21: Top down view of two identical parallel cameras with
focal length f at distance b to each other.
Figure 22: Panoramic view of the office premises where the
mapping experiment was conducted.
resource usage of 106658 logic elements targeting a Stratix
EP2S130 device, due to the high number of aggregations in
a9
× 18 block. Their quality assessment yields 61.12% and
79.85% correct matches for their SAD and census transform,
respectively, while frame rates range to several hundreds.
Darabiha et al. [19] and Masrani and MacLean [20]
implemented phase-based stereo in FPGAs using the equiva-
lent of 70000 logic elements and about 800 Kbits of on-chip
memory. Their system is built with Stratix S80 devices and
supports a maximum disparity range of 128-pixels. A phase-
based implementation is also reported in [21].
Global optimization VLSI architectures are just begin-
ning to emerge. Recently, hardware-efficient algorithms for
realizing belief propagation were proposed. Belief propa-
gation (BP) is an effective technique for solving energy
minimization problems in computer vision. It provides
global optimality and good matching performance when
applied to disparity estimation. However, it has great
computational complexity and requires huge memory and
bandwidth. Cheng et al. [22] propose a tile-based BP
algorithm in order to overcome the memory and bandwidth
bottlenecks. In a related article, Liang et al. [23] implemented
the tile-based approach as well as a method for parallel
message construction on a dedicated VLSI chip. The chip
uses UMC 90 nm technology and consists of 2.5 M gates
(10 M transistors). It processes VGA images with 64-pixels
maximum disparity at 27 frames per second.
The problem of mapping in hardware belief propagation
for global stereo estimation is also addressed by Park and
Jeong [24]. They implement a BP algorithm using a Xilinx
XC2vp100 FPGA chip. They process 16 disparity levels
and image resolution 256
× 240 at 25 frames per second,
using 9564 slices (approximately 20000 LE) and more than
10 Mbits of memory partitioned in on-chip RAM blocks and
external SRAM.
An FPGA implementation of a dynamic programming
maximum likelihood algorithm has been presented by
Sabihuddin and MacLean [25]. They use external memory
for the two N
× N stereo images and reduce the N
2
cost
matrix elements to 2N necessary elements. The partial cost
matrix is stored in a 2N
× 16 bits RAM, while index values
attributed to winning costs are stored in additional N
2
×
2 bits on-chip memory. Exhaustive data processing occurs
sequentially over all the pixels in the image scanline. Their
design is much more complex and resource demanding than
ours and can achieve 30 fps applying several optimizations.
Software implementations of DP algorithms can achieve
real-time matching at video rate by using coarse to fine
approaches and exploiting the MMX assembly of contem-
porary CPUs [26]. In a similar recent trend, real-time
performance of complex stereo algorithms has been boosted
by the use of commodity graphics hardware [27]. Recent
16 EURASIP Journal on Advances in Signal Processing
−2.8
−1.4
0
x
0.5
−0.425
−1.35
−2.275
−3.2
y
1.1
2.2
z
(a)
1.1
2.2
z
(b)
Figure 23: (a) Mapping result using the DP processor. (b) Side view (x-z plane) of the office premises, with the book shelves visible on the
right.
−2.8
−1.4
0
x
0.5
−0.425
−1.35
−2.275
−3.2
y
1.1
2.2
z
(a)
1.1
2.2
z
(b)
Figure 24: (a) Mapping using the SAD processor. (b) x-z plane of the map in (a).
advances exploit the parallel computational power within
Graphics Processing Units (GPUs) which greatly exceeds
that of CPUs. Local methods of stereo correspondence are
more straightforward to implement using GPU [28, 29],
however, several attempts have been made to map global
techniques on the parallel programming model used by
graphics units [30]. Methods based on belief propagation
have produced the best results on GPUs [31], but they are
computationally intensive and not very appropriate for real-
time performance. Attempts to parallelize dynamic program-
ming on graphics units have appeared in the literature and
they offer a good balance between quality and speed [32, 33].
In this respect, our proposed method to parallelize dynamic
programming could be applied using parallel threads on a
graphics unit, thus offering an alternative implementation.
Using commodity graphics cards for stereo acceleration can
be a flexible and cheap solution for PC-oriented applications,
however, using dedicated hardware like our system is faster
and more suitable for autonomous systems equipped with
vision sensors.
In Tables 1 and 2 of the present article processing speeds
and resource usage were presented for our own SAD and
DP implementations on reconfigurable hardware. These
data compare favorably with implementations reported in
the aforementioned literature. The strong point of both
SAD and DP architectures compared in this article is their
EURASIP Journal on Advances in Signal Processing 17
full parallelism, resulting in one output disparity pixel at
every clock count. Window-based parallelism is inherent
in correlation methods like SAD and has been exploited by
other systems too. In the case of the proposed DP system,
parallelism is achieved by means of a novel state machine
allowing cost-computation of D states along the diagonal of
the cost plane in one clock cycle. In this way, both systems
evaluated in this article can perform in real-time and their
normalized throughput is 50 Mpps. As shown in Ta bl e 1
when clocked at 100 and 50 MHz, respectively, they are able
to process 162 and 81 fps, in full VGA resolution (640
×480)
and by these standards both systems compare favorably with
other systems in the literature.
The overall quality of the depth maps produced by
the DP hardware system is superior compared to SAD-
based implementations for comparable chip size. As shown
in Section 5 the disparities computed by the DP hardware
accelerator can be used successfully by a robotic system in
order to reconstruct a map of its environment in real-time.
7. Conclusion
A comparative evaluation is presented of two different
stereo processing systems implemented in reconfigurable
hardware. A description of their hardware design is given.
The two systems implement, respectively a method of local
correlation using the measure of the Sum of Absolute Dif-
ferences (SAD) and a maximum likelihood global technique
based on Dynamic programming (DP) which optimizes
the computation of disparities over the whole scan line.
Enhancements of the two systems are also implemented in
hardware, namely SAD-based left-right consistency check
and interscanline support based on dynamic programming.
Numerous test benches are used and depth maps are
computed and compared to ground truth. The quality of the
depthmapsismeasuredintermsofrmserrorandpercentage
ofbadmatches,inregionsrichwithtextureaswellasin
textureless regions of the image. The DP hardware processor
is shown to produce fewer errors in almost all tests. Cost-
computation using interscanline support minimizes errors
present in the form of horizontal streaks.
Both processors are tested in a real-world 3D mapping
experiment, using a video sequence in real-time. They are
both able to map the scene, however, the DP processor
produces the best results.
The present study shows that accelerating global tech-
niques like dynamic programming with dedicated hardware
can be a substantial improvement over traditional local
correlation methods and can result in better real-time stereo
vision systems in automotive, robotic, or other industrial
applications.
Acknowledgment
J. Kalomiros wishes to acknowledge financial support pro-
vided by the Research Committee of the Technological
Educational Institute of Serres, Greece, under Grant 71/13/7-
10-2009.
References
[1] E. R. Davies, Machine Vision: Theory, Algorithms, Practicalities,
Elsevier, San Diego, Calif, USA, 3rd edition, 2004.
[2]M.Z.Brown,D.Burschka,andG.D.Hager,“Advancesin
computational stereo,” IEEE Transactions on Pattern Analysis
and Machine Intelligence, vol. 25, no. 8, pp. 993–1008, 2003.
[3] S. Birchfield and C. Tomasi, “Depth discontinuities by pixel-
to-pixel stereo,” in Proceedings of the IEEE International
Conference on Computer Vision (ICCV ’98), pp. 1073–1080,
Mumbai, India, 1998.
[4] Y. Ohta and T. Kanade, “Stereo by intra- and inter-scanline
search using dynamic programming,” IEEE Transactions on
Pattern Analysis and Machine Intelligence, vol. 7, no. 2, pp. 139–
154, 1985.
[5]I.J.Cox,S.L.Hingorani,S.B.Rao,andB.M.Maggs,“A
maximum likelihood stereo algorithm,” Computer Vision and
Image Understanding, vol. 63, no. 3, pp. 542–567, 1996.
[6] Y. Miyajima and T. Maruyama, “A real-time stereo vision
system with FPGA,” in Field Programmable Logic and Applica-
tions, vol. 2778 of Lecture Notes in Computer Sc ience, pp. 448–
457, Springer, Berlin, Germany, 2003.
[7] M. Hariyama, Y. Kobayashi, H. Sasaki, and M. Kameyama,
“FPGA implementation of a stereo matching processor based
on window-parallel-and-pixel-parallel architecture,” IEICE
Transactions on Fundamentals of Electronics, Communications
and Computer Sciences (Japan), vol. E88-A, no. 12, pp. 3516–
3521, 2005.
[8] O. Faugeras, B. Hotz, H. Matthieu, et al., “Real time
correlation-based stereo: algorithm, implementations and
applications,” INRIA Technical Report 2013, INRIA, Lyon,
France, 1993.
[9] J. A. Webb, “Implementation and performance of fast parallel
multi-baseline stereo vision,” in Proceedings of the DARPA
Image Understanding Workshop, pp. 1005–1012, Washington,
DC, USA, April 1993.
[10] J. A. Kalomiros and J. Lygouras, “Hardware implementation of
a stereo co-processor in a medium-scale field programmable
gate array,” IET Computers and Digital Techniques, vol. 2, no.
5, pp. 336–346, 2008.
[11] A. L. Yuille and T. Poggio, “A generalized ordering constraint
for stereo correspondence,” Tech. Rep. A.I. Memo 777, AI Lab,
MIT, Cambridge, Mass, USA, 1984.
[12] D. Scharstein and R. Szeliski, “High-accuracy stereo depth
maps using structured light,” in Proceedings of the IEEE
Computer Society Conference on Computer Vision and Pattern
Recognition (CVPR ’03), vol. 1, pp. 195–202, Madison, Wis,
USA, 2003.
[13] May 2009, />[14] Y. Nakamura, T. Matsuura, K. Satoh, and Y. Ohta, “Occlusion
detectable stereo—occlusion patterns in camera matrix,” in
Proceedings of the IEEE Computer Society Conference on
Computer Vision and Pattern Recognition (CVPR ’96), pp. 371–
378, 1996.
[15] D. Scharstein and R. Szeliski, “A taxonomy and evaluation of
dense two-frame stereo correspondence algorithms,” Interna-
tional Journal of Computer Vision, vol. 47, no. 1–3, pp. 7–42,
2002.
[16] J. Woodfill and B. Von Herzen, “Real-time stereo vision on
the PARTS reconfigurable computer,” in Proceedings of the
5th Annual IEEE Symposium on FPGAs for Custom Computing
Machines, pp. 201–210, Napa Valley, Calif, USA, April 1997.
18 EURASIP Journal on Advances in Signal Processing
[17] K. Ambrosch, M. Humenberger, W. Kubinger, and A.
Steininger, “SAD-based stereo matching using FPGAs,” in
Embedded Computer Vision, Part II, B. Kisacanin, S. Bhat-
tacharyya, and S. Chai, Eds., Springer, London, UK, 2009.
[18] K. Ambrosch, W. Kubinger, M. Humenberger, and A.
Steininger, “Flexible hardware-based stereo matching,”
EURASIP Journal on Embedded Systems, vol. 2008, Article ID
386059, 12 pages, 2008.
[19] A. Darabiha, J. Rose, and W. J. MacLean, “Video-rate stereo
depth measurement on programmable hardware,” in Proceed-
ings of the IEEE Computer Society Conference on Computer
Vision and Pattern Recognition (CVPR ’03), vol. 1, pp. 203–210,
Madison, Wis, USA, June 2003.
[20] D. K. Masrani and W. J. MacLean, “A real-time large disparity
range stereo-system using FPGAs,” in Proceedings of the 4th
IEEE International Conference on Computer Vision Systems
(ICVS ’06), pp. 13–20, January 2006.
[21] J. D
´
ıaz,E.Ros,S.Mota,E.M.Ortigosa,andB.delPino,“High
performance stereo computation architecture,” in Proceedings
of the International Conference on Field Programmable Logic
and Applications (FPL ’05), pp. 463–468, Tampere, Finland,
August 2005.
[22] C C. Cheng, C K. Liang, Y C. Lai, H H. Chen, and L G.
Chen, “Analysis of belief propagation for hardware realiza-
tion,” in Proceedings of the IEEE Workshop on Signal Processing
Systems (SiPS ’08), pp. 152–157, Washington, DC, USA,
2008.
[23] C K. Liang, C C. Cheng, Y C. Lai, L G. Chen, and H H.
Chen, “Hardware efficient belief propagation,” in Proceedings
of the IEEE Computer Society Conference on Computer Vision
and Pattern Recognition (CVPR ’09), pp. 80–87, Miami, Fla,
USA, June 2009.
[24] S. Park and H. Jeong, “High-speed parallel very large scale
integration architecture for global stereo matching,” Journal of
Electronic Imaging, vol. 17, no. 1, Article ID 010501, 2008.
[25] S. Sabihuddin and W. J. MacLean, “Maximum likelihood
stereo correspondence using field programmable gate arrays,”
in Proceedings of the 5th International Conference on Computer
Vision Systems (ICVS ’07), Bielefeld University, Bielefeld,
Germany, March 2007.
[26] S. Forstmann, Y. Kanou, J. Ohya, S. Thuering, and A. Schmitt,
“Real-time stereo by using dynamic programming,” in Pro-
ceedings of the IEEE Computer Society Conference on Computer
Vision and Pattern Recognition Workshops (CVPRW ’04), vol.
3, p. 29, Washington, DC, USA, June 2004.
[27] S. Rogmans, “A generic framework for implementing real-
time matching algorithms on the graphics processing unit,”
Barco Awards, pp. 1–10, 2007.
[28] M. Gong, R. Yang, L. Wang, and M. Gong, “A performance
study on different cost aggregation approaches used in real-
time stereo matching,” International Journal of Computer
Vision, vol. 75, no. 2, pp. 283–296, 2007.
[29] F. Tombari, S. Mattoccia, L. Di Stefano, and E. Addimanda,
“Classification and evaluation of cost aggregation methods for
stereo correspondence,” in Proceedings of the 26th IEEE Confer-
ence on Computer Vision and Pattern Recognition (CVPR ’08),
pp. 1–8, June 2008.
[30] J. Gibson and O. Marques, “Stereo depth with a unified
architecture GPU,” in Proceedings of the IEEE Computer
Society Conference on Computer Vision and Pattern Recognition
Workshops (CVPRW ’08), pp. 1–6, June 2008.
[31] A. Klaus, M. Sormann, and K. Karner, “Segment-based
stereo matching using belief propagation and a self-adapting
dissimilarity measure,” in Proceedings of the 18th International
Conference on Pattern Recognition (ICPR ’06), vol. 3, pp. 15–
18, 2006.
[32] J. Congote, J. Barandiaran, I. Barandiaran, and O. Ruiz,
“Realtime dense stereo matching with dynamic programming
in CUDA,” in Proceedings of the 19th Spanish Congress of
Graphical Informatics (CEIG ’09)
, pp. 231–234, San Sebastian,
Spain, September 2009.
[33] L. Wang, M. Liao, M. Gong, R. Yang, and D. Nister, “High-
quality real-time stereo using adaptive cost aggregation and
dynamic programming,” in Proceedings of the 3rd International
Symposium on 3D Data Processing, Visualization, and Trans-
mission (3DPVT ’06), pp. 798–805, Washington, DC, USA,
2006.