Báo cáo hóa học: "Research Article Spectral Correlation of Multicarrier Modulated Signals and Its Application for Signal Detection" ppt
Bạn đang xem bản rút gọn của tài liệu. Xem và tải ngay bản đầy đủ của tài liệu tại đây (1.8 MB, 14 trang )
Hindawi Publishing Corporation
EURASIP Journal on Advances in Signal Processing
Volume 2010, Article ID 794246, 14 pages
doi:10.1155/2010/794246
Research Article
Spect ral Correlation of Multicarrier Modulated Signals and
Its Application for Signal Detection
Haijian Zhang, Didier Le Ruyet (EURASIP Member), and Michel Terr
´
e
Electronics and Communications Laboratory, CNAM, 75141 Paris, France
Correspondence should be addressed to Haijian Zhang,
Received 31 January 2009; Revised 15 September 2009; Accepted 21 October 2009
Academic Editor: Ying-Chang Liang
Copyright © 2010 Haijian Zhang et al. This is an open access article distributed under the Creative Commons Attribution License,
which permits unrestricted use, distribution, and reproduction in any medium, provided the original work is properly cited.
Spectral correlation theory for cyclostationary time-series signals has been studied for decades. Explicit formulas of spectral
correlation function for various types of analog-modulated and digital-modulated signals are already derived. In this paper, we
investigate and exploit the cyclostationarity characteristics for two kinds of multicarrier modulated (MCM) signals: conventional
OFDM and filter bank based multicarrier (FBMC) signals. The spectral correlation characterization of MCM signal can be
described by a special linear periodic time-variant (LPTV) system. Using this LPTV description, we have derived the explicit
theoretical formulas of nonconjugate and conjugate cyclic autocorrelation function (CAF) and spectral correlation function (SCF)
for OFDM and FBMC signals. According to theoretical spectral analysis, Cyclostationary Signatures (CS) are artificially embedded
into MCM signal and a low-complexity signature detector is, therefore, presented for detecting MCM signal. Theoretical analysis
and simulation results demonstrate the efficiency and robustness of this CS detector compared to traditionary energy detector.
1. Introduction
A cyclostationary process is an appropriate probabilistic
model for the signals that undergo periodic transformation,
such as sampling, modulating, multiplexing, and coding
operations, provided that the signal is appropriately modeled
as a stationary process before undergoing the periodic
transformation [1]. Increasing demands on communication
system performance indicate the importance of recognizing
the cyclostationary character of communicated signals. The
growing role of the cyclostationarity is illustrated by abun-
dant works in the detection area and other signal processing
areas. Spectral correlation is an important characteristic
property of wide sense cyclostationarity, and a spectral
correlation function is a generalization of the power spectral
density (PSD) function. Recently, the spectral correlation
function has been largely exploited for signal detection,
estimation, extraction and classification mainly because
different types of modulated signals have highly distinct
spectral correlation functions and the fact stationary noise
and interference exhibit no spectral correlation property.
Furthermore, the spectral correlation function contains
phase and frequency information related to timing param-
eters in modulated signals.
In [1, 2], explicit formulas of the CAF and SCF for
various types of single carrier modulated signals are derived.
The cyclostationary properties of OFDM have been analyzed
in [3, 4], and the formulas of CAF and SCF of OFDM signal
are derived by a mathematic deduce process in [3], whereas
the authors in [4] provide a straightforward derivation
of CAF and SCF for OFDM signal by a matrix-based
stochastic method without involving complicated theory. For
FBMC signals, the second-order syclostationarity properties
of FBMC signal are exploited in [5, 6] for blind joint carrier-
frequency offset (CFO) and symbol timing estimation.
The main objective of this article is to obtain the general
formulas for calculating the CAF and SCF of MCM signals
using a common derivation model. A particularly convenient
method for calculating the CAF and SCF for many types
of modulated signals is to model the signal as a purely
stationary waveform transformed by a Linear Periodically
Time-Variant (LPTV) transformation [7, 8]. Multicarrier
modulated signal can be regarded as a special model with the
multi-input transformed by LPTV transformation and one
2 EURASIP Journal on Advances in Signal Processing
scalar output. By modeling MCM signal into a LPTV system
it is convenient to analyze MCM signal using the known
LPTV theory. With the help of the mature LPTV theory,
herein we derive the explicit formulas for nonconjugate
and conjugate cyclic autocorrelation function and spectral
correlation function of OFDM and FBMC signals, which
are very useful for blind MCM signals detection and
classification.
Cognitive Radio (CR) has recently been proposed as
a possible solution to improve spectrum utilization via
dynamic spectrum access, and spectrum sensing has also
been identified as a key enabling functionality to ensure
that cognitive radios would not interference with primary
users. We are interested in various efficient (low Signal-to-
Noise Ratio, (SNR), detection requirement of licensed signal)
and low-complex methods for the detection of free bands
at the worst situation that we know only few information
about the received signal. Cyclostationary based detector is
efficient and more robust than energy detector [9], which is
highly susceptible to noise uncertainty. In most of practical
situations, it is not very likely that the cognitive radio has
access to the nature of licensed signal, hence rendering noise
estimation impossible. The worse thing is that energy detec-
tor cannot differentiate between modulated signals, noise
and interference. Feature detector such as cyclostationarity
is, therefore, proposed for signal detection in CR context. An
inherent cyclostationary detection method, by detecting the
presence of nonconjugate cyclostationarity in some non-zero
cyclic frequency, is proposed in [3]. Although this detector
exhibits good detection performance, it cannot achieve the
low SNR requirement of CR system specified by FCC. In
addition, the computation of the proposed cyclostationarity
detection algorithm is complex.
Therefore, in order to alleviate the computation com-
plexity and achieve better detection performance for low
SNRlevel,weapplyaconjugatecyclostationaritydetector
by inserting Cyclostationary Signature [10] (CS), which is
realized by redundantly transmitting message symbols at
some predetermined cyclic frequency based on the theoret-
ical spectral analysis and the fact that most of the MCM
signals and noise do not exhibit conjugate cyclostationarity.
Previous works introducing artificially cyclostationarity for
OFDM signal at the transmitter can be found in [10–
12]. In this paper, the signal detection between FBMC
signal and noise is investigated. We implement the spectral
detection of FBMC signal embedded by CS using a low-
complexity conjugate cyclostationarity detector considering
both AWGN and Rayleigh fading environments in the CR
domain. Experimental results are provided to show the
efficiency and the robustness compared to the traditionary
energy detector.
The remainder of this paper is organized as follows:
Section 2 presents the basic definition of spectral correlation.
The fundamental concepts of LPTV system are mentioned
in Section 3. Through the aforementioned theoretical knowl-
edge, Section 4 analyzes and derives the theoretical formulas
of nonconjugate and conjugate cyclic autocorrelation and
spectral correlation functions of OFDM and FBMC signals.
In Section 5, corresponding spectral analysis for FBMC
signalswithCSisinvestigated.Alow-complexityCSdetector
is presented in Section 6. Simulation results are given in
Section 7. Finally, conclusions are drawn in Section 8.
2. Definition of Cyclic Spectral Correlation
A complete understanding of the concept of spectral cor-
relation is given in the tutorial paper [8]. This section is a
very brief review of the fundamental definitions for spectral
correlation.
The probabilistic nonconjugate autocorrelation of a
stochastic process x(t)is
R
x
(
t, τ
)
= E
x
t +
τ
2
x
∗
t −
τ
2
,(1)
where the superscript asterisk denotes complex conjugation.
x(t) is defined to be second-order cyclostationary (in the
wide sense) if R
x
(t, τ) is the periodic function about t with
period T
0
and can be represented as a Fourier series:
R
x
(
t, τ
)
=
α
R
α
x
(
τ
)
e
j2παt
,(2)
which is called periodic autocorrelation function, where the
sum is taken over integer multiples of the fundamental
frequency “1/T
0
”. T h e Four i er co e fficients can be calculated
as
R
α
x
(
τ
)
= lim
T →∞
1
T
T/2
−T/2
R
x
(
t, τ
)
e
−j2παt
dt
,(3)
where α
= integer/T
0
,andR
α
x
(τ) is called the cyclic autocorre-
lation function. The idealized cyclic spectrum function can be
characterized as the Fourier transform
S
α
x
f
=
∞
−∞
R
α
x
(
τ
)
e
−j2πfτ
dτ.
(4)
In the nonprobabilistic approach, for a time-series
x(t) that contains second-order periodicity, synchronized
averaging applied to the lag product time-series “y(t)
x(t + τ/2)x
∗
(t − τ/2)” yields
R
x
(
t, τ
)
lim
N →∞
1
2N +1
N
n=−N
x
t + nT
0
+
τ
2
·
x
∗
t + nT
0
−
τ
2
,
(5)
which is referred to as the limit periodic autocorrelation
function. The nonprobabilistic counterpart of (3)isgivenby
R
α
x
(
τ
)
lim
T →∞
1
T
T/2
−T/2
x
t +
τ
2
x
∗
t −
τ
2
e
−j2παt
dt,
(6)
which is recognized as the limit cyclic autocorrelation func-
tion.Thelimit cyclic spectrum function can be characterized
as the Fourier transform like (4):
S
α
x
f
=
∞
−∞
R
α
x
(
τ
)
e
−j2πfτ
dτ
. (7)
EURASIP Journal on Advances in Signal Processing 3
The limit cyclic spectrum function is also called spectral
correlation function. Fourier transform relation in (7)is
called the cyclic Wiener relation.
In summary, the limit cyclic autocorrelation can be
interpreted as a Fourier coefficient in the Fourier series
expansion of the limit periodic autocorrelation like (2).
If
R
α
x
(τ) ≡ 0forallα
/
=0and
R
x
(τ)
/
=0, then x(t)is
purely stationary.If
R
α
x
(τ)
/
=0onlyforα = integer/T
0
for
some period T
0
, then x(t)ispurely cyclostationary with
period T
0
.If
R
α
x
(τ)
/
=0 for values of α that are not all
integer multiples of some fundamental frequency 1/T
0
, then
x(t)issaidtoexhibit cyclostationary [1]. For modulated
signals, the periods of cyclostationarity correspond to carrier
frequencies, pulse rates, spreading code repetition rates,
time-division multiplexing rates, and so on.
In paper [8], an useful modification of the CAF called
conjugate cyclic autocorrelation function is given as
R
α
x
∗
(
τ
)
= lim
T →∞
1
T
T/2
−T/2
R
∗
x
(
t, τ
)
e
−j2παt
dt,
(8)
with R
∗
x
(t, τ) = E[x(t + τ/2)x(t −τ/2)], and the correspond-
ing SCF called conjugate spect ral correlation function is
S
α
x
∗
f
=
∞
−∞
R
α
x
∗
(
τ
)
e
−j2πfτ
dτ
. (9)
For a noncyclostationary signal, R
α
x
(τ) = R
α
x
∗
(τ) =
S
α
x
( f ) = S
α
x
∗
( f ) = 0forallα
/
=0, and for a cyclostationary
signal, any nonzero value of the frequency parameter α,for
which the nonconjugate and conjugate CAFs and SCFs differ
from zero is called a cycle frequency. Both nonconjugate and
conjugate CAFs and SCFs are discrete functions of the cycle
frequency α and are continuous in the lag parameter τ and
frequency parameter f ,respectively.
3. LPTV System
LPTV is a special case of linear almost-periodically time-
variant (LAPTV), which is introduced in [7]. A linear time-
variant system with input x(t), output y(t), impulse response
function h(t, u), and input-output relation
y
(
t
)
=
R
h
(
t, u
)
x
(
u
)
du
, (10)
is said to be LAPTV if the impulse response function admits
the Fourier series expansion:
h
(
t, u
)
=
σ∈G
h
σ
(
t
−u
)
e
j2πσu
, (11)
where G is a countable set.
By substituting (11) into (10) the output y(t)canbe
expressed in the two equivalent forms
y
(
t
)
=
σ∈G
h
σ
(
t
)
⊗
x
(
t
)
e
j2πσt
, (12)
y
(
t
)
=
σ∈G
g
σ
(
t
)
⊗x
(
t
)
e
j2πσt
, (13)
where “
⊗” denotes convolution operation, and
g
σ
(
t
)
= h
σ
(
t
)
e
−j2πσt
. (14)
From (12) it follows that a LAPTV system performs a
linear time-invariant filtering of frequency-shifted version of
the input signal. For this reason LAPTV is also referred to
as frequency-shift filtering. Equivalently, form (13)itfollows
that a LAPTV system performs a frequency shift of linear
time-invariant filtered versions of the input.
In the special case for which G
≡{k/T
0
}
k∈Z
for some
period T
0
, the system becomes the linear periodically time-
variant (LPTV).
LPTV transformation is defined as follows [8]:
y
(
t
)
=
∞
−∞
h
(
t, u
)
x
(
u
)
du
, (15)
where
x is a L-element column vector input (L is any non-
zero positive integer) and y(t) is a scalar response.
h(t, u) =
h(t + T
0
, u + T
0
) is the periodically time-variant (L-element
row vector) of impulse response functions that specify the
transformation. The function
h(t + τ,t) is periodic in t with
aperiodT
0
for each τ represented by the Fourier series
h
(
t + τ, t
)
=
∞
n=−∞
g
n
(
τ
)
e
j2πnt/T
0
, (16)
where
g
n
(
τ
)
=
1
T
0
T
0
/2
−T
0
/2
h
(
t + τ, t
)
e
−j2πnt/T
0
dt
. (17)
The Fourier transform of function
h(t +τ,t)isdefinedas
a system function:
G
t, f
=
∞
−∞
h
(
t, t
−τ
)
e
−j2πfτ
dτ,
(18)
which can be also represented by a Fourier series:
G
t, f
=
∞
n=−∞
G
n
f +
n
T
0
e
j2πnt/T
0
, (19)
where
G
n
f
=
∞
n=−∞
g
n
(
τ
)
e
−j2πfτ
dτ
. (20)
By substitution of (15)and(16) into the definition of
(3)and(4), it can be shown that the nonconjugate cyclic
autocorrelation and cyclic spectrum of the input
x(t)and
output y(t) of the LPTV system are related by the formulas
R
α
y
(
τ
)
=
∞
n,m=−∞
trace
R
α−(n−m)/T
0
x
(
τ
)
·e
−jπ
(
n+m
)
τ/T
0
⊗
r
α
nm
(
−τ
)
,
(21)
S
α
y
f
=
∞
n,m=−∞
G
n
f +
α
2
S
α−(n−m)/T
0
x
f −
[
n + m
]
2T
0
·
G
T
m
f −
α
2
∗
,
(22)
4 EURASIP Journal on Advances in Signal Processing
where “
⊗” denotes convolution operation, the superscript
symbol “T” denotes matrix transposition, and “
∗”denotes
conjugation.
R
β
x
is the matrix of cyclic cross-correlation of
the elements of the vector
x(t)
R
β
x
(
τ
)
= Lim
T →∞
1
T
T/2
−T/2
x
∗
t +
τ
2
x
T
t −
τ
2
e
−j2πβt
dt,
(23)
and
r
α
nm
is the matrix of finite cyclic cross correlation
r
α
nm
(
τ
)
=
∞
−∞
g
T
n
t +
τ
2
g
∗
m
t −
τ
2
e
−j2παt
dt
. (24)
Formulas (21)and(22) reveal that the cyclic autocor-
relation and spectra of a modulated signal are each self-
determinant characteristics under an LPTV transformation.
The conjugate cyclic autocorrelation and cyclic spectrum
of the input
x(t)andoutputy(t) of the LPTV system are
obtained similarly:
R
α
y
∗
(
τ
)
=
∞
n,m=−∞
trace
R
α−
(
n+m
)
/T
0
x
∗
(
τ
)
·e
−jπ
(
n−m
)
τ/T
0
⊗
r
α
nm
∗
(
−τ
)
,
(25)
S
α
y
∗
f
=
∞
n,m=−∞
G
n
f +
α
2
S
α−(n+m)/T
0
x
∗
f −
[
n
−m
]
2T
0
·
G
T
m
f −
α
2
,
(26)
R
β
x
∗
(
τ
)
= Lim
T →∞
1
T
T/2
−T/2
x
t +
τ
2
x
T
t −
τ
2
e
−j2πβt
dt,
(27)
r
α
nm
∗
(
τ
)
=
∞
−∞
g
T
n
t +
τ
2
g
m
t −
τ
2
e
−j2παt
dt. (28)
4. Spectral Correlation of MCM Signals
Generally, the carrier modulated passband MCM signal c(t)
can be expressed as
c
(
t
)
= Re
y
(
t
)
e
j2πf
c
t
, (29)
whereRedenotestherealpartof
{·}, y(t) is the baseband
envelope of the actual transmitted MCM signal, and f
c
is the
carrier frequency.
If the baseband envelope signal y(t) is cyclostationary,
the spectral correlation function of its corresponding carrier
modulated signal c(t) can be expressed as [13]
S
α
c
f
=
1
4
S
α
y
f − f
c
+ S
α
y
f + f
c
+S
α−2 f
c
y
∗
f − f
c
+ S
α+2 f
c
y
∗
f + f
c
,
(30)
where S
α
y
(s)andS
α
y
∗
(s) are the nonconjugate and conjugate
spectral correlation function of the complex envelope y(t),
e
j−(M/2)(2π/T)t
e
j−(M/2+1)(2π/T)t
e
j(M/2−1)(2π/T)t
a
l
0
a
l
1
a
l
M
−1
p(t)
p(t)
p(t)
×
×
×
x(t)
h(t)
x
0
(t)
x
1
(t)
x
M−1
(t)
y(t)
Figure 1: Baseband OFDM transmitter.
respectively. We can observe that the spectral correlation
of the carrier modulated signal c(t) is determined by the
nonconjugate and conjugate spectral correlation of the com-
plex envelope signal y(t) and is related to the double carrier
frequency, so the problem of spectral analysis correlation
analysis of passband carrier modulated signal can be reduced
to the spectral correlation analysis of the complex baseband
signal.
The spectral correlation analysis of MCM signals is the
theoretical basis for further signal processing. In this section,
we investigate two typical MCM signals: OFDM and FBMC
signals. Other MCM signals share similar spectral correlation
properties with these two signals.
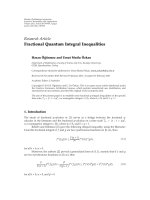
4.1. Spectral Correlation of OFDM Signal Using LPTV.
Figure 1 shows a filter bank based schematic baseband
equivalent of transmultiplexer system, based on the LPTV
theory M parallel complex data streams are passed to M
subcarrier transmission filters. OFDM system is special filter
bank based multicarrier system with the rectangular pulse
filters. The baseband OFDM signal can be expressed as a sum
of M single carrier signals like (15)
y
(
t
)
=
M−1
k=0
∞
l=−∞
a
l
k
p
(
t − lT
s
)
·e
jk(2πt/T
0
)
·e
−jM(π/T
0
)t
=
M−1
k=0
x
k
(
t
)
h
k
(
t
)
,
(31)
where x
k
(t) is the element of the input vector of LPTV system
and h
k
(t) is the element of impulse response of LPTV:
x
k
(
t
)
=
∞
l=−∞
a
k
(
lT
s
)
p
(
t
−lT
s
)
, k
= 0, 1, , M −1,
h
k
(
t
)
= e
j
(
k−M/2
)(
2πt/T
0
)
, k = 0, 1, ,M − 1,
(32)
EURASIP Journal on Advances in Signal Processing 5
for which a
k
is the purely stationary data, T
s
= T
0
+ T
g
is
one OFDM symbol duration, where T
0
is the useful symbol
duration and T
g
is the length of the guard interval where the
OFDM signal is extended cyclically. p(t) is the rectangular
pulse function, and h
k
(t) can be regarded as the periodic
function in t with the period T
0
for k = 0, 1, ,M −1.
Element of input vector x
k
(t) can also be regarded as
an inherent LPTV transformation of data a
k
with the time-
invariant filters p(t):
x
k
(
t
)
= a0
(
t
)
⊗ p
(
t
)
,
(33)
where
a0
(
t
)
=
∞
l=−∞
a
k
(
lT
s
)
δ
(
t
−lT
s
)
.
(34)
Assuming E[a
l,k
a
∗
l,k
] = σ
2
, each entity of matrix
R
α
x
(τ)
and
S
α
x
( f )in(21)and(22)reduceto
R
α
x
k
(
τ
)
= R
α
a0
(
τ
)
⊗r
α
p
(
τ
)
,
S
α
x
k
f
=
S
α
a0
f
·
S
α
p
f
,
(35)
where S
α
p
( f ) is the Fourier transform of r
α
p
(τ)and
r
α
p
(
τ
)
=
∞
−∞
p
t +
τ
2
p
t −
τ
2
e
−j2παt
dt,
R
α
a0
(
τ
)
=
σ
2
T
s
·δ
(
τ
)
, α =
integer
T
s
,
S
α
a0
f
=
σ
2
T
s
, α =
integer
T
s
.
(36)
Other terms corresponding to the LPTV system can be
similarly calculated:
h
(
t, u
)
=
e
j
(
−M/2
)
(2πt/T
0
)
δ
(
t − u
)
,
e
j
(
1−M/2
)
(2πt/T
0
)
δ
(
t − u
)
, ,
e
j
(
M/2−1
)
(2πt/T
0
)
δ
(
t − u
)
,
G
t, f
=
e
j
(
−M/2
)
(2πt/T
0
)
, e
j
(
1−M/2
)
(2πt/T
0
)
, ,
e
j
(
M/2−1
)
(2πt/T
0
)
,
g
n
(
τ
)
=
⎡
⎢
⎢
⎢
⎢
⎣
g
0
n
.
.
.
g
M−1
n
⎤
⎥
⎥
⎥
⎥
⎦
=
⎡
⎢
⎢
⎢
⎢
⎣
δ
(
τ
)
··· 0
.
.
. δ
(
τ
)
.
.
.
0 δ
(
τ
)
⎤
⎥
⎥
⎥
⎥
⎦
,
G
n
f
=
⎡
⎢
⎢
⎢
⎢
⎣
G
0
n
.
.
.
G
M−1
n
⎤
⎥
⎥
⎥
⎥
⎦
=
⎡
⎢
⎢
⎢
⎢
⎣
1 ··· 0
.
.
.1
.
.
.
0 1
⎤
⎥
⎥
⎥
⎥
⎦
,
n
=−
M
2
, ,
M
2
−1forM = 8, 16,
(37)
0.25
0.2
0.15
0.1
0.05
0
2
1
0
−1
−2
αT
s
−1
−0.5
0
0.5
1
τ/T
s
Figure 2: 8-channel nonconjugate cyclic autocorrelation of OFDM
signal.
2.5
2
1.5
1
0.5
0
2
1
0
−1
−2
αT
s
−10
−5
0
5
10
fT
s
Figure 3: 8-channel nonconjugate spectral correlation function of
OFDM signal.
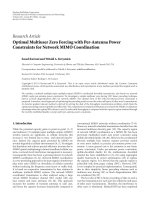
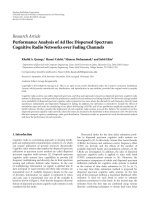
Substituting (31)∼(37) into (21)and(22), the nonconju-
gate cyclic autocorrelated and cyclic spectra of OFDM signal
are transformed into
R
α
ofdm
(
τ
)
=
⎧
⎪
⎪
⎪
⎪
⎪
⎪
⎪
⎪
⎪
⎪
⎨
⎪
⎪
⎪
⎪
⎪
⎪
⎪
⎪
⎪
⎪
⎩
σ
2
T
s
·
sin
[
πα
(
T
s
−|τ|
)
]
πα
·
sin
(
πMτ/T
0
)
sin
(
πτ/T
0
)
, α
=
integer
T
s
, |τ| <T
s
,
0, α
/
=
integer
T
s
,
(38)
S
α
ofdm
f
=
⎧
⎪
⎪
⎪
⎪
⎪
⎪
⎪
⎪
⎪
⎨
⎪
⎪
⎪
⎪
⎪
⎪
⎪
⎪
⎪
⎩
σ
2
T
s
M/2
−1
n=−M/2
P
f +
α
2
−
n
T
0
·
P
∗
f −
α
2
−
n
T
0
, α =
integer
T
s
,
0, α
/
=
integer
T
s
,
(39)
where T
s
is the time length of one OFDM symbol, P( f ) is the
Fourier transform of p(t). The magnitudes of nonconjugate
CAF and SCF of OFDM signal are drawn in graphical terms
as the heights of surfaces above a bifrequency plane in Figures
2 and 3.
6 EURASIP Journal on Advances in Signal Processing
For the conjugate case, according to (25)and(26), the
conjugate cyclic autocorrelation and cyclic spectra of OFDM
signal are transformed into
R
α
ofdm
∗
(
τ
)
=
⎧
⎪
⎪
⎪
⎪
⎪
⎪
⎪
⎪
⎨
⎪
⎪
⎪
⎪
⎪
⎪
⎪
⎪
⎩
1
T
s
M/2
−1
n=−M/2
r
α−(2n/T
0
)
p
(
τ
)
·E
a
l,k
a
l,k
, α =
integer
T
s
, |τ| <T
s
,
0, α
/
=
integer
T
s
,
(40)
S
α
ofdm
∗
f
=
⎧
⎪
⎪
⎪
⎪
⎪
⎪
⎪
⎪
⎪
⎪
⎪
⎪
⎨
⎪
⎪
⎪
⎪
⎪
⎪
⎪
⎪
⎪
⎪
⎪
⎪
⎩
1
T
s
M/2
−1
n=−M/2
P
f +
α
2
−
n
T
0
×
P
∗
f −
α
2
+
n
T
0
·
E
a
l,k
a
l,k
, α =
integer
T
s
,
0, α
/
=
integer
T
s
.
(41)
Consequently, the explicit spectral correlation function
of the carrier modulated OFDM signal can be derived by
substituting (39)and(41) into (30):
S
α
c
ofdm
f
=
⎧
⎪
⎪
⎪
⎪
⎪
⎪
⎪
⎪
⎪
⎪
⎪
⎪
⎪
⎪
⎪
⎪
⎪
⎪
⎪
⎪
⎪
⎪
⎪
⎪
⎪
⎪
⎪
⎪
⎪
⎪
⎪
⎪
⎪
⎪
⎪
⎪
⎪
⎪
⎪
⎪
⎪
⎪
⎨
⎪
⎪
⎪
⎪
⎪
⎪
⎪
⎪
⎪
⎪
⎪
⎪
⎪
⎪
⎪
⎪
⎪
⎪
⎪
⎪
⎪
⎪
⎪
⎪
⎪
⎪
⎪
⎪
⎪
⎪
⎪
⎪
⎪
⎪
⎪
⎪
⎪
⎪
⎪
⎪
⎪
⎪
⎩
M/2−1
n=−M/2
σ
2
T
s
P
f − f
c
+
α
2
−
n
T
0
×
P
∗
f − f
c
−
α
2
−
n
T
0
+
σ
2
T
s
P
f + f
c
+
α
2
−
n
T
0
×
P
∗
f + f
c
−
α
2
−
n
T
0
+
A
T
s
P
f − f
c
+
α
−2 f
c
2
−
n
T
0
×
P
∗
f − f
c
−
α −2 f
c
2
+
n
T
0
+
A
T
s
P
f + f
c
+
α +2f
c
2
−
n
T
0
×
P
∗
f + f
c
−
α +2f
c
2
+
n
T
0
,
α
=
integer
T
s
,
0, α
/
=
integer
T
s
,
(42)
where A
= E[a
l,k
a
l,k
]. Since E[a
l,k
a
l,k
] = 0forMPSK(M
/
=2)
or QAM modulation types, given that a
l,k
is centered and
i.i.d According to (41), it can be seen that the OFDM
signal does not exhibit conjugate cyclostationarity, that is
R
α
ofdm
∗
(τ) = S
α
ofdm
∗
( f ) = 0, for all α, τ, f . The spectral
correlation function of the carrier-modulated signal for
MPSK(M
/
=2) or QAM modulation can be simplified as
S
α
c
ofdm
f
=
⎧
⎪
⎪
⎪
⎪
⎪
⎪
⎪
⎪
⎪
⎪
⎪
⎪
⎪
⎪
⎪
⎪
⎪
⎪
⎪
⎪
⎪
⎪
⎪
⎨
⎪
⎪
⎪
⎪
⎪
⎪
⎪
⎪
⎪
⎪
⎪
⎪
⎪
⎪
⎪
⎪
⎪
⎪
⎪
⎪
⎪
⎪
⎪
⎩
σ
2
T
s
M/2
−1
n=−M/2
P
f − f
c
+
α
2
−
n
T
0
×
P
∗
f − f
c
−
α
2
−
n
T
0
+P
f + f
c
+
α
2
−
n
T
0
×
P
∗
f + f
c
−
α
2
−
n
T
0
,
α
=
integer
T
s
,
0, α
/
=
integer
T
s
.
(43)
4.2. Spectral Correlation of FBMC Signal Using LPTV. An
efficient FBMC scheme based on offset quadrature amplitude
modulation (OQAM) system has been developed [14–19].
OQAM in [15] can achieve smaller intersymbol interference
(ISI) and interchannel interference (ICI) without using the
cyclic prefix by utilizing well designed pulse shapes. Saltzberg
in [16] showed that by designing a transmit pulse-shape in a
multichannel QAM system, and by introducing a half symbol
space delay between the in-phase and quadrature compo-
nents of QAM symbols, it is possible to achieve a baud-
rate spacing between adjacent subcarrier channels and still
recover the information symbol free of ISI and ICI. Further
development was made by Hirosaki [17], who showed that
the transmitter and receiver part of this modulation method
could be implemented efficiently in a polyphase Discrete
Fourier Transform (DFT) structure. Some new progress
about OQAM system can be found in [18, 19].
The principle of OQAM multicarrier modulation system
is to divide the transmission into M independent trans-
missions using M subcarriers. Instead of a Fast Fourier
Transform (rectangular shape filters), a more normal filter
bank p(t) is used. Subcarrier bands are spaced by the symbol
rate 1/T
0
(T
0
is one OQAM symbol period). An introduced
orthogonality condition between subcarriers guarantees that
the transmitted symbols arrive at the receiver free of ISI
and ICI, which is achieved through time staggering the in-
phase and quadrature components of the subcarrier symbols
by half a symbol period T
0
/2. The typical baseband OQAM
transmitter system is shown in Figure 4.
Supposing the complex input symbols of OQAM system
are
x
l
k
= a
l
k
+ jb
l
k
,
(44)
where a
l
k
and b
l
k
are, respectively, the real and imaginary parts
of the kth subcarrier of the lth symbol. The complex-values
baseband OQAM signal is defined as
y
(
t
)
=
M−1
k=0
∞
l=−∞
a
l
k
p
(
t − lT
0
)
+ jb
l
k
p
t − lT
0
−
T
0
2
·
e
j(k−M/2)(2πt/T
0
+π/2)
.
(45)
EURASIP Journal on Advances in Signal Processing 7
e
j(−M/2)(2π/Tt+π/2)
e
j(−M/2+1)(2π/Tt+π/2)
e
j(M/2−1)(2π/Tt+π/2)
a
l
0
b
l
0
a
l
1
b
l
1
a
l
M
−1
b
l
M
−1
p(t)
jp(t
−T/2)
p(t)
jp(t
−T/2)
p(t)
jp(t
−T/2)
×
×
×
x(t)
h(t)
x
0
(t)
x
1
(t)
x
M−1
(t)
y(t)
+
+
+
Figure 4: Baseband OQAM transmitter.
From (45)andFigure 4 we can see that OQAM signal
is a special model with M-input
x(t)transformedby
LPTV transformation
h(t) and one scalar output y(t). The
baseband OQAM signal (45) can also be expressed as a sum
of M single carrier signals like (15)
y
(
t
)
=
M−1
k=0
x
k
(
t
)
h
k
(
t
)
, (46)
where x
k
(t) is the element of the input vector of LPTV system
and h
k
(t) is the element of impulse response of LPTV
x
k
(
t
)
=
∞
l=−∞
a
k
(
lT
0
)
p
(
t
−lT
0
)
+ jb
k
(
lT
0
)
p
t − lT
0
−
T
0
2
,
k
= 0, 1, , M −1,
h
k
(
t
)
=e
j(k−M/2)(2πt/T
0
+π/2)
, k = 0, 1, ,M − 1,
(47)
for which a
k
and b
k
are the purely stationary data, T
0
is one
OQAM symbol duration, p(t) is the prototype filter bank
pulse function, and h
k
(t) can be regarded as the periodic
function in t with the period T
0
for k = 0, 1, ,M −1.
x
k
(t) also can be regarded as a two-element vector LPTV
transformation of input data a
k
and b
k
with the time-
invariant filters p(t)andp(t
−T
0
/2):
x
k
(
t
)
= a0
(
t
)
⊗ p
(
t
)
+ b0
(
t
)
⊗ p
t −
T
0
2
, (48)
where
a0
(
t
)
=
∞
l=−∞
a
k
(
lT
0
)
δ
(
t
−lT
0
)
,
b0
(
t
)
=
∞
l=−∞
jb
k
(
lT
0
)
δ
(
t
−lT
0
)
.
(49)
Assuming E[a
l,k
a
∗
l,k
] = E[b
l,k
b
∗
l,k
] = σ
2
, each entity of
matrices
R
α
x
(τ)and
S
α
x
( f )in(21)and(22)reducesto
R
α
x
k
(
τ
)
=
σ
2
T
0
·
δ
(
τ
)
⊗r
α
p1
(
τ
)
+ δ
(
τ
)
⊗r
α
p2
(
τ
)
=
σ
2
T
0
·r
α
p1
(
τ
)
1+e
−jπαT
0
, α =
integer
T
0
,
S
α
x
k
f
=
σ
2
T
0
·
S
α
p1
f
+ S
α
p2
f
=
σ
2
T
0
·S
α
p1
f
1+e
−jπαT
0
, α =
integer
T
0
,
(50)
where S
α
p1
( f ) is the Fourier Transform of r
α
p1
(τ)and
r
α
p1
(
τ
)
=
∞
−∞
p
t +
τ
2
p
t −
τ
2
e
−j2παt
dt,
r
α
p2
(
τ
)
=
∞
−∞
p
t +
τ
2
−
T
0
2
p
t −
τ
2
−
T
0
2
e
−j2παt
dt
= r
α
p1
(
τ
)
e
−jπαT
0
.
(51)
8 EURASIP Journal on Advances in Signal Processing
Other terms corresponding to the LPTV system can be
similarly calculated:
h
(
t, u
)
=
e
j
(
−
(
M/2
))((
2πt/T
0
)
+
(
π/2
))
δ
(
t − u
)
,
e
j(1−(M/2))((2πt/T
0
)+(π/2))
·δ
(
t − u
)
, ,
e
j
((
M/2
)
−1
)((
2πt/T
0
)
+
(
π/2
))
δ
(
t − u
)
,
G
t, f
=
e
j(−(M/2))((2πt/T
0
)+(π/2))
,
e
j(1−(M/2)) ((2πt/T
0
)+(π/2))
, ,
e
j((M/2)−1)((2πt/T
0
)+(π/2))
,
g
n
(
τ
)
=
⎡
⎢
⎢
⎢
⎢
⎣
g
0
n
.
.
.
g
M−1
n
⎤
⎥
⎥
⎥
⎥
⎦
=
⎡
⎢
⎢
⎢
⎢
⎣
δ
(
τ
)
··· 0
.
.
. e
j(π/2)k
δ
(
τ
)
.
.
.
0 e
j(π/2)(M−1)
δ
(
τ
)
⎤
⎥
⎥
⎥
⎥
⎦
,
G
n
f
=
⎡
⎢
⎢
⎢
⎢
⎣
G
0
n
.
.
.
G
M−1
n
⎤
⎥
⎥
⎥
⎥
⎦
=
⎡
⎢
⎢
⎢
⎢
⎣
1 ··· 0
.
.
. e
j(π/2)k
.
.
.
0 e
j(π/2)(M−1)
⎤
⎥
⎥
⎥
⎥
⎦
,
n
=−
M
2
, ,
M
2
−1forM = 8, 16,
(52)
By the substitution of (46)
∼(52) into (21)and(22),
the nonconjugate cyclic autocorrelation and cyclic spectra of
OQAM signal are transformed into
R
α
oqam
(
τ
)
=
⎧
⎪
⎪
⎪
⎪
⎪
⎪
⎪
⎪
⎪
⎪
⎨
⎪
⎪
⎪
⎪
⎪
⎪
⎪
⎪
⎪
⎪
⎩
2σ
2
T
0
·r
α
p1
(
τ
)
·
sin
(
πMτ/T
0
)
sin
(
πτ/T
0
)
,
α
=
2 ·integer
T
0
, |τ| <KT
0
,
0, α
/
=
2 ·integer
T
0
,
(53)
S
α
oqam
f
=
⎧
⎪
⎪
⎪
⎪
⎪
⎪
⎪
⎪
⎪
⎪
⎨
⎪
⎪
⎪
⎪
⎪
⎪
⎪
⎪
⎪
⎪
⎩
2σ
2
T
0
M/2
−1
n=−M/2
P
f +
α
2
−
n
T
0
P
∗
f −
α
2
−
n
T
0
α =
2 ·integer
T
0
,
0, α
/
=
2 ·integer
T
0
,
(54)
where KT
0
is the time length of the prototype filter
bank, P( f ) is the Fourier transform of p(t)andr
α
p1
(τ)is
described as (51). The magnitudes of nonconjugate CAF
and SCF of OQAM signal are shown in Figures 5 and 6.
We unfortunately found that OQAM signal has very poor
0.25
0.2
0.15
0.1
0.05
0
4
2
0
−2
−4
αT
0
−3
−2
−1
0
1
2
3
τ/T
0
Figure 5: 8-channel nonconjugate cyclic autocorrelation of OQAM
signal.
2.5
2
1.5
1
0.5
0
4
2
0
−2
−4
αT
0
−10
−5
0
5
10
fT
0
Figure 6: 8-channel nonconjugate spectral correlation function of
OQAM signal.
inherent cyclostationary property when the cyclic frequency
is not equal to zero, which can be interpreted by (54), where
the value of cross product “P( f + α/2)P
∗
( f − α/2)” tends
to zero when “α
= 2 · integer/T
0
” due to the low sidelobes
property of OQAM prototype function.
For the conjugate situation, assuming E[a
l,k
a
l,k
] =
E[b
l,k
b
l,k
] = σ
2
, in the same way we can get each entity of
matrices
R
α
x
∗
(τ)and
S
α
x
∗
( f )in(25)and(26):
R
α
x
∗
k
(
τ
)
=
σ
2
T
0
·
δ
(
τ
)
⊗r
α
p1
(
τ
)
−δ
(
τ
)
⊗r
α
p2
(
τ
)
=
σ
2
T
0
·r
α
p1
(
τ
)
1 −e
−jπαT
0
, α =
integer
T
0
,
(55)
S
α
x
∗
k
f
=
σ
2
T
0
·
S
α
p1
f
−
S
α
p2
f
=
σ
2
T
0
·S
α
p1
f
1 −e
−jπαT
0
, α =
integer
T
0
.
(56)
EURASIP Journal on Advances in Signal Processing 9
Substitution of (52), (55), and (56) into (25)and(26),
the conjugate cyclic autocorrelation and cyclic spectra of
OQAM signal is transformed into
R
α
oqam
∗
(
τ
)
=
⎧
⎪
⎪
⎪
⎪
⎪
⎪
⎪
⎪
⎪
⎪
⎪
⎨
⎪
⎪
⎪
⎪
⎪
⎪
⎪
⎪
⎪
⎪
⎪
⎩
2σ
2
T
0
M/2
−1
n=−M/2
r
α−2n/T
0
p1
(
τ
)(
−1
)
n
,
α
=
2 ·integer −1
T
0
, |τ| <KT
0
,
0, α
/
=
2 ·integer −1
T
0
,
(57)
S
α
oqam
∗
f
=
⎧
⎪
⎪
⎪
⎪
⎪
⎪
⎪
⎪
⎪
⎪
⎪
⎪
⎪
⎪
⎪
⎪
⎨
⎪
⎪
⎪
⎪
⎪
⎪
⎪
⎪
⎪
⎪
⎪
⎪
⎪
⎪
⎪
⎪
⎩
2σ
2
T
0
M/2
−1
n=−M/2
P
f +
α
2
−
n
T
0
×
P
∗
f −
α
2
+
n
T
0
(
−1
)
n
,
α
=
2 ·integer −1
T
0
,
0, α
/
=
2 ·integer −1
T
0
.
(58)
As same as OFDM signal (except BPSK), OQAM signal
does not exhibit conjugate cyclostationarity, either. This
property can be exactly interpreted by (58), where the value
of cross product “P( f +α/2
−n/T
0
)P
∗
( f −α/2+n/T
0
)(−1)
n
”
equals to zero due to neighbored offset effect. The explicit
spectral correlation function of the carrier modulated FBMC
signal can be obtained by substituting (54) into (30):
S
α
c
fbmc
f
=
⎧
⎪
⎪
⎪
⎪
⎪
⎪
⎪
⎪
⎪
⎪
⎪
⎪
⎪
⎪
⎪
⎪
⎪
⎪
⎪
⎪
⎪
⎪
⎪
⎪
⎨
⎪
⎪
⎪
⎪
⎪
⎪
⎪
⎪
⎪
⎪
⎪
⎪
⎪
⎪
⎪
⎪
⎪
⎪
⎪
⎪
⎪
⎪
⎪
⎪
⎩
2σ
2
T
0
M/2
−1
n=−M/2
P
f − f
c
+
α
2
−
n
T
0
×
P
∗
f − f
c
−
α
2
−
n
T
0
+P
f + f
c
+
α
2
−
n
T
0
×
P
∗
f + f
c
−
α
2
−
n
T
0
,
α
=
2 ·integer
T
0
,
0, α
/
=
2 ·integer
T
0
.
(59)
5. Cyclostationary Signature for MCM Signal
The poor inherent cyclostationarity is unsuitable for prac-
tically applications in the context of cognitive radio. Even
for OFDM signals which contain inherent cyclostationary
features due to the underlying periodicities properties
−M/20
p
M/2
Figure 7: Generation of cyclostationary signatures by repeated
transmitting MCM subcarrier symbols.
(Figure 3), as the power of inherent OFDM features are
relative low to the power of signal, reliable detection of these
features requires complex architecture and long observation
time.
In this paper we study the detection problem of MCM
signals considering the AWGN and Rayleigh fading envi-
ronment by using an induced cyclostationary scheme [20],
which is realized by intentionally embedding some cyclo-
stationary signatures. Cyclostationarity-inducing method
enables the recognition among primary system and sec-
ondary system or among multiple secondary systems com-
peting for the same space spectrum, which is important as
it may facilitate the setting of advanced spectrum policy
such as multilevel priority or advanced access control [12].
Cyclostationary signature has been shown to be a powerful
tool in overcoming the challenge of the distributed coor-
dination of operating frequencies and bandwidths between
co-existing systems [10]. A cyclostationary signature is a
feature, intentionally embedded in the physical properties of
a digital communication signal. CSs are effectively applied
to overcome the limitations associated with the use of
inherent cyclostationary features for signal detection and
analysis with minimal additional complexity for existing
transmitter architectures. Detection and analysis of CS may
be also achieved using low-complexity receiver architectures
and short observation durations. CS provides a robust
mechanism for signal detection, network identification and
signal frequency acquisition.
As illustrated in Figure 7, CSs are easily created by
mapping a set of subcarriers onto a second set as
γ
n,l
= γ
n+p,l
n ∈ N,
(60)
where γ
n,l
is the lth independent and identically distributed
message at nth subcarrier frequency, N is the set of
subcarrier values to be mapped and p is the number of
subcarriers between mapped subcarriers. So a correlation
pattern is created and a cyclostationary feature is embed-
ded in the signal by redundantly transmitting message
symbols.
In order to avoid redundant theoretical analysis, herein
we just discuss the cyclostationary signature for FBMC
signal. According to (21), (22), (53), (54), and (60), we can
rewrite the nonconjugate cyclic autocorrelation and spectral
10 EURASIP Journal on Advances in Signal Processing
0.25
0.2
0.15
0.1
0.05
0
4
2
0
−2
−4
αT
0
−3
−2
−1
0
1
2
3
τ/T
0
Figure 8: Nonconjugate Cyclic Autocorrelation Function for FBMC
signal with cyclostationary features at cyclic frequencies α
=±2/T
0
and α =±4/T
0
.
correlation formulas of FBMC signal with cyclostationary
signatures:
R
α
fbmc
·cs
(
τ
)
=
⎧
⎪
⎪
⎪
⎪
⎪
⎪
⎪
⎪
⎪
⎪
⎪
⎪
⎪
⎪
⎪
⎪
⎪
⎪
⎪
⎪
⎪
⎪
⎨
⎪
⎪
⎪
⎪
⎪
⎪
⎪
⎪
⎪
⎪
⎪
⎪
⎪
⎪
⎪
⎪
⎪
⎪
⎪
⎪
⎪
⎪
⎩
2σ
2
T
0
·r
α
p1
(
τ
)
·
sin
(
πMτ/T
0
)
sin
(
πτ/T
0
)
,
α
=
2 ·integer
T
0
,2·integer
/
=−p, |τ| <KT
0
,
2σ
2
T
0
·r
0
p1
(
τ
)
·
n∈N
e
−jπ(2n+p)τ/T
0
,
α
=−
p
T
0
, |τ| <KT
0
,
0, α
/
=
2 ·integer
T
0
, α
/
=−
p
T
0
,
(61)
S
α
fbmc
·cs
f
=
⎧
⎪
⎪
⎪
⎪
⎪
⎪
⎪
⎪
⎪
⎪
⎪
⎪
⎪
⎪
⎪
⎪
⎪
⎪
⎪
⎪
⎪
⎨
⎪
⎪
⎪
⎪
⎪
⎪
⎪
⎪
⎪
⎪
⎪
⎪
⎪
⎪
⎪
⎪
⎪
⎪
⎪
⎪
⎪
⎩
2σ
2
T
0
M/2
−1
n=−M/2
P
f +
α
2
−
n
T
0
P
∗
f −
α
2
−
n
T
0
,
α
=
2 ·integer
T
0
,2·integer
/
=−p,
2σ
2
T
0
n∈N
P
f +
α
2
−
n
T
0
P
∗
f −
α
2
−
n + p
T
0
,
α
=−
p
T
0
,
0, α
/
=
2 ·integer
T
0
, α
/
=−
p
T
0
,
(62)
where N is the set of subcarriers to be mapped and p
∈
P (P =±2i, i = 1, 2, 3, 4, ).
The magnitudes of nonconjugate CAF and SCF of FBMC
signal with CS are drawn in Figures 8 and 9,wherefour
cyclostationary signatures are embedded corresponding to
two different values of p (choosing p
= 2andp = 4), and
a reference filter bank is designed using the method given
in [21]. We can see that for the FBMC signal with CS the
strong cyclostationary features appear at the cyclic frequency
“α
=±2/T
0
”and“α =±4/T
0
”.
OFDM and FBMC signals detection utilizing CSs by
nonconjugate operation are already investigated in [10, 14],
respectively. They both exhibit good performances, but
the experiments using CSs by conjugate operation are still
an open topic. In the following, we will insert the CSs by
conjugate operation aiming at generating cyclostationary
features on some predefined cyclic frequency, which is
feasible based on the fact that most of MCM signals and
noise don’t display cyclostationarity under the conjugate
operation for all the cyclic frequencies. ( Herein the noise
is assumed to be circularly symmetric.) Therefore, a simple
cyclostationarity detector for the presence of conjugate
cyclostationarity over the predefined cyclic frequency can be
given to detect MCM signal and noise or detect two different
MCM signals. ( Recognition is feasible between the MCM
signal embedded by CS and the other MCM signal without
CS at a predetermined cyclic frequency.)
Contrary to the nonconjugate operation, a CS is created
by mapping the conjugate formation of a set of subcarriers
onto a second set as
γ
n,l
= γ
∗
n+p,l
n ∈ N
(63)
by which a correlation pattern is created and a cyclostation-
ary feature is embedded in the signal.
According to (25), (26), (57), (58), and (63), we can
rewrite the conjugate cyclic autocorrelation and spectral
correlation formulas of FBMC signal with cyclostationary
signatures
R
α
fbmc
·cs
∗
(
τ
)
=
⎧
⎪
⎪
⎪
⎪
⎪
⎪
⎪
⎪
⎪
⎪
⎪
⎪
⎪
⎪
⎪
⎪
⎪
⎪
⎪
⎪
⎨
⎪
⎪
⎪
⎪
⎪
⎪
⎪
⎪
⎪
⎪
⎪
⎪
⎪
⎪
⎪
⎪
⎪
⎪
⎪
⎪
⎩
2σ
2
T
0
M/2
−1
n=−M/2
r
α−2n/T
0
p1
(
τ
)(
−1
)
n
,
α
=
2 ·integer −1
T
0
,2·integer − 1
/
=2n + p,
|τ| <KT
0
,
2σ
2
T
0
·e
jπpτ/T
0
·r
0
p1
(
τ
)
, α
=
2n + p
T
0
, |τ| <KT
0
,
0, α
/
=
2 ·integer −1
T
0
, α
/
=
2n + p
T
0
,
(64)
S
α
fbmc
·cs
∗
f
=
⎧
⎪
⎪
⎪
⎪
⎪
⎪
⎪
⎪
⎪
⎪
⎪
⎪
⎪
⎪
⎪
⎪
⎪
⎪
⎨
⎪
⎪
⎪
⎪
⎪
⎪
⎪
⎪
⎪
⎪
⎪
⎪
⎪
⎪
⎪
⎪
⎪
⎪
⎩
2σ
2
T
0
M/2
−1
n=−M/2
P
f +
α
2
−
n
T
0
P
∗
f −
α
2
+
n
T
0
(
−1
)
n
,
α
=
2 ·integer −1
T
0
,2·integer − 1
/
=2n + p,
2σ
2
T
0
n∈N
P
f +
α
2
−
n
T
0
P
∗
f −
α
2
+
n + p
T
0
,
α
=
2n + p
T
0
,
0, α
/
=
2 ·integer −1
T
0
, α
/
=
2n + p
T
0
,
(65)
EURASIP Journal on Advances in Signal Processing 11
2.5
2
1.5
1
0.5
0
4
2
0
−2
−4
αT
0
−10
−5
0
5
10
fT
0
Figure 9: Nonconjugate Spectral Correlation Function for FBMC
signal with four CSs at cyclic frequencies α
=±2/T
0
and α =±4/T
0
.
0.08
0.06
0.04
0.02
0
4
2
0
−2
−4
αT
0
−3
−2
−1
0
1
2
3
τ/T
0
Figure 10: Conjugate Cyclic Autocorrelation Function for FBMC
signal with cyclostationary features at cyclic frequencies α
= 0.
where N is the set of subcarriers to be mapped and p ∈
P(P =±2i, i = 1, 2, 3,4, ). From (65) we can embed the
CSs at zero cyclic frequency by setting a group of mapping
subcarriers according to (63) under the condition “2n + p
=
0”. The magnitudes of conjugate CAF and SCF of FBMC
signal with CS are drawn in Figures 10 and 11, where two
subcarriers are repeated transmitted at the value of p
= 2.
We can see that the strong cyclostationary features appear at
the cyclic frequency “α
= 0”.
6. Sig nature Detector
Since complex noise does not exhibit nonconjugate (con-
jugate) cyclostationarity, the presence of the MCM signal
under noise and interference is equivalent to the detection of
the presence of nonconjugate (conjugate) cyclostationarity in
the received composite signal x(t)
= s(t)+n(t) on the pre-
determined cyclic frequency, where n(t) is the contribution
from noise.
The signature detector in [10]canbeusedforefficient
FBMC signal detection. Cyclostationary features generated
by subcarriers set mapping can be successfully detected using
spectral resolution (subcarrier spacing Δ f ). So the low-
complexity signature detector can be designed by sliding a
2.5
2
1.5
1
0.5
0
4
2
0
−2
−4
αT
0
−10
−5
0
5
10
fT
0
Figure 11: Conjugate Spectral Correlation Function for FBMC
signal with two CSs at cyclic frequencies α
= 0.
window W with the width N
s
·Δ f (N
s
is the number of sub-
carriers in the mapped set) around estimated nonconjugate
(conjugate) SCF at the cyclic frequency α
0
:
T
x
(∗)
= max
m
n
S
α
0
x
(
∗
)
(
n
)
W
(
m
−n
)
,
(66)
where
S
α
0
x
(∗)
is estimated using a time-smoothed cyclic cross
periodogram [8].
7. Simulations
Instead of discussing the detection applications of various
MCM signals, in this section only the performance of
the conjugate cyclostationarity detector between FBMC
signal inserted by CS and noise signal is investigated. A
512-subcarrier FBMC signal is chosen and the following
assumptions are made.
(1) Cognitive radio system with a bandwidth of 5 MHz,
and assuming signals are transmitted at carrier
frequency f
c
= 2.4 GHz.
(2) The Additive White Gaussian Noise (AWGN) and
Rayleigh fading channel are considered, respectively.
A typical urban channel [22] is used with a maximum
spread delay τ
≈ 2.2 μs and a Doppler frequencies
f
d
= 240 Hz, which corresponds to a moving speed
30 m/s.
(3) Subcarriers are modulated using OQAM. 6, 12,
18 and 24 subcarriers are respectively used as the
mapping subcarrier sets at zero cyclic frequency.
(4) Using the detector (66), the entry
S
0
x
∗
is estimated
using time-smoothed cyclic periodogram, where a
Hamming window is used. For simplicity, a rectan-
gular sliding window W is chosen.
(5) For comparison, the traditional energy detector
proposed by Urkowitz [9] is applied under the
assumption of noise uncertainty indicated by U,
which is defined in [23].
Receiver operating characteristic (ROC) curves are
drawn in Figures 12–15 by averaging 500 Monte Carlo
12 EURASIP Journal on Advances in Signal Processing
1
0.9
0.8
0.7
0.6
0.5
0.4
0.3
0.2
0.1
0
Detection probability
00.20.40.60.81
False alarm probability
CS, SNR
= 0dB
CS, SNR
=−3dB
CS, SNR
=−6dB
CS, SNR
=−9dB
CS, SNR
=−12 dB
Energy, U
= 0.12dB, SNR =−9dB
Energy, U
= 0.12dB, SNR =−10 dB
Energy, U
= 0.12dB, SNR =−11 dB
Energy, U
= 0.12dB, SNR =−12 dB
Figure 12: Receiver Operating Characteristic performance for
AWGN channel with N
= 6 subcarriers mapping set and an
observation time T
= 1ms.
1
0.9
0.8
0.7
0.6
0.5
0.4
0.3
0.2
0.1
0
Detection probability
00.20.40.60.81
False alarm probability
CS, T
= 30ms, N = 18
CS, T
= 10ms, N = 18
CS, T
= 10ms, N = 6
CS, T
= 1ms,N = 18
Energy, U
= 0.11dB, T = 10ms
Energy, U
= 0.12dB, T = 10ms
Energy, U
= 0.13dB, T = 10ms
Energy, U
= 0.14dB, T = 30ms
Figure 13: Receiver Operating Characteristic performance for
AWGN channel with a fixed SNR
=−12dB.
1
0.9
0.8
0.7
0.6
0.5
0.4
0.3
0.2
0.1
0
Detection probability
00.20.40.60.81
False alarm probability
CS, SNR
= 3dB
CS, SNR
= 0dB
CS, SNR
=−3dB
CS, SNR
=−6dB
CS, SNR
=−9dB
Energy, U
= 0.24dB, SNR =−8dB
Energy, U
= 0.24dB, SNR =−9dB
Figure 14: Receiver Operating Characteristic performance for
Rayleigh fading channel with N
= 12 subcarriers mapping set and
an observation time T
= 3ms.
simulations for AWGN channel and Rayleigh fading channel,
respectively. Figure 12 gives the experimental results for an
AWGN channel at different SNR levels (0 dB,
−3dB,−6dB,
−9dB, and −12 dB) with 6 subcarriers mapping set and
an observation time T
= 1 ms (10 FBMC symbols). As
a comparison, the energy detector proposed in [9]with
a noise uncertainty U
= 0.12 dB is used. It can be seen
that desired detection performance can be achieved for CS
detector at the low SNR level, and almost 100% detection
rate can be achieved when the SNR level is more than 0 dB.
We can also observe that the energy detector significantly
outperforms the CS detector when the noise power is well
estimated. Effects of observation time and mapping set are
shown in Figure 13 at a fixed SNR
=−12dB, where the
ROC curves show that the performance of the CS detector
improves when longer observation time and larger mapping
set are applied. In addition, energy detector performance for
different noise uncertainty values is depicted in Figure 13,
which verifies that energy detector is very susceptible to noise
uncertainty at low SNR level. Due to the noise uncertainty,
the performance of energy detector does not improve even if
the observation time increases. This behavior is predicted by
the so called “SNR wall” in [24]. Namely, the energy detector
can’t distinguish the weak received signal form slightly higher
noise power below some SNR level.
The results deteriorate when more realistic time
variant Rayleigh fading channels are considered. As
shown in Figure 14,effects of SNR are illustrated
at different SNR levels (3 dB, 0 dB,
−3dB, −6dB,
and
−9 dB) with 12 subcarriers mapping set and an
EURASIP Journal on Advances in Signal Processing 13
1
0.9
0.8
0.7
0.6
0.5
0.4
0.3
0.2
0.1
0
Detection probability
00.20.40.60.81
False alarm probability
CS, T
= 500ms, N = 24
CS, T
= 200ms, N = 24
CS, T
= 100ms, N = 24
CS, T
= 15ms, N = 24
CS, T
= 15ms, N = 12
CS, T
= 3ms,N = 24
Energy, U
= 0.23dB, T = 15ms
Energy, U
= 0.24dB, T = 15ms
Energy, U
= 0.25dB, T = 15ms
Energy, U
= 0.26dB, T = 500ms
Figure 15: Receiver Operating Characteristic performance for
Rayleigh fading channel with a fixed SNR
= −9dB.
observation time T = 3 ms (30 FBMC symbols).
Compared with Figure 12, it can be seen that Rayleigh
fading channel affects detection performance significantly.
The energy detector with noise uncertainty U
= 0.24 dB is
compared with CS detector in Figure 14, which once again
shows the advantage of energy detector when the SNR level
is below the SNR wall. In order to achieve higher detection
reliability for CS detector, longer observation time or more
mapping subcarriers are needed as shown in Figure 15.It
can be noted that from Figures 13 and 15 at a low SNR level
(SNR
≤−9 dB) energy detector is not robust under the
condition of a noise uncertainty U
≥ 0.13 dB.
Simulations show that the energy detector is very suscep-
tible to noise uncertainties and its performance is dictated by
the accuracy of the noise power estimate. Moreover, energy
detector can’t differentiate different modulated signals, noise
and interference. Conversely, good performance can be
achieved for CS detector with a short observation time.
Detection reliability can be seriously impacted by time-
variant Rayleigh fading channel, which can be overcome
through the use of longer observation time and more
mapping subcarriers. Besides, CS detector is not susceptible
to noise uncertainty and can distinguish different modulated
signals by inserting CSs at different frequency positions.
8. Conclusion
This paper firstly analyzes the cyclic spectral correlation
of both OFDM and FBMC signals. By utilizing an LPTV
model, we have derived the explicit formulas of nonconjugate
and conjugate cyclic autocorrelation and spectral correlation
functions for OFDM and FBMC signals, which provide the
theoretical basis for further signal detection.
Secondly, a strategy for the detection of MCM signals by
embedding cyclostationary signature at the predefined cyclic
frequency is investigated. Because of the LPTV structure
of the FBMC signal, the explicit formulas of nonconjugate
and conjugate CAF and SCF with CS for FBMC signal are
derived and CS can be accordingly easily inserted into the
FBMC signal at some predetermined frequency position.
During the simulation, a low-complexity conjugate detector
is applied for detecting FBMC signal by embedding the CS
at zero cyclic frequency in the AWGN and Rayleigh fading
situations, respectively. All the cyclic operations at zero
cyclic frequency are actually the conventional correlation
and power spectral operations, which in some way reduce
the computation complexity. Experimental results show that
CS is an effective and robust tool for signal detection in
cognitive radio network. We can improve the performance
with increased subcarriers mapping size, but this causes
a reduction in overall date rate because of the increased
overhead. Via flexible CS position design for different
MCM signals (different CR networks), identification among
different modulated signals can be implemented in the same
way.
Future work will be undertaken to examine the uses of
pilots for generating cyclostationary signatures. In addition,
further applications of CSs will be carried out in a practical
cognitive radio platform.
References
[1] W. A. Gardner, “Spectral correlation of modulated signal—
part I: analog modulation,” IEEE Transactions on Communi-
cations, vol. 35, no. 6, pp. 584–594, 1987.
[2] W. A. Gardner, W. A. Brown, and C K. Chen, “Spectral cor-
relation of modulated signals—part II: digital modulation,”
IEEE Transactions on Communications, vol. 35, no. 6, pp. 595–
601, 1987.
[3] M.
¨
Oner and F. Jondral, “On the extraction of the channel
allocation information in spectrum pooling systems,” IEEE
Journal on Selected Areas in Communications,vol.25,no.3,pp.
558–565, 2007.
[4] D. Vu
ˇ
ci
´
c, M. Obradovi
´
c, and D. Obradovi
´
c, “Spectral corre-
lation of OFDM signals related to their PLC applications,” in
Proceedings of the 6th Internat ional Symposium on Power-Line
Communications and Its Applications (ISMPLC ’02), 2002.
[5] H. B
¨
olcskei, “Blind estimation of symbol timing and carrier
frequency offset in wireless OFDM systems,” IEEE Transactions
on Communications, vol. 49, no. 6, pp. 988–999, June 2001.
[6] P. Ciblat and E. Serpedin, “A fine blind frequency offset
estimator for OFDM/OQAM systems,” IEEE Transactions on
Signal Processing, vol. 52, no. 1, pp. 291–296, 2004.
[7] W. A. Gardner, A. Napolitano, and L. Paura, “Cyclostationar-
ity: half a century of research,” Signal Processing, vol. 86, no. 4,
pp. 639–697, 2006.
[8] W. A. Gardner, “The spectral correlation theory of cyclosta-
tionary time-series,” Signal Processing, vol. 11, no. 1, pp. 13–36,
1986.
14 EURASIP Journal on Advances in Signal Processing
[9] H. Urkowitz, “Energy detection of unknown deterministic
signals,” Proceeding of the IEEE , vol. 55, no. 4, pp. 523–531,
1967.
[10]P.D.Sutton,K.E.Nolan,andL.E.Doyle,“Cyclostationary
signatures in practical cognitive radio applications,” IEEE
Journal on Selected Areas in Communications,vol.26,no.1,pp.
13–24, 2008.
[11] A. Chevreuil, E. Serpedin, P. Loubaton, and G. Giannakis,
“Blind channel identification and equalization using non-
redundant periodic modulation precoders: performance anal-
ysis,” IEEE Transactions on Signal Processing,vol.48,no.6,pp.
1570–1586, 2000.
[12] K. Maeda, A. Benjebbour, T. Asai, T. Furuno, and T. Ohya,
“Cyclostationarity-inducing transmission methods for recog-
nition among OFDM-Based systems,” EURASIP Journal on
Wireless Communications and Networking, vol. 2008, Article ID
586172, 14 pages, 2008.
[13] D. Vu
ˇ
ci
´
candM.Obradovi
´
c, “Matrix-based stochastic method
for the spectral correlation characterization of digital modula-
tion,” Facta Universitatis, Series: Electronics and Energetics, vol.
11, no. 3, pp. 271–284, 1998.
[14]H.Zhang,D.LeRuyet,andM.Terre,“Signaldetectionfor
OFDM/OQAM system using cyclostationary signatures,” in
Proceedings of the IEEE International Symposium on Personal,
Indoor and Mobile Radio Communications (PIMRC ’08),pp.
1–5, September 2008.
[15] R. W. Chang, “Synthesis of band-limited orthogonal signals
for multicarrier data transmission,” Bell System Technical
Journal, vol. 45, pp. 1775–1796, 1966.
[16] B. R. Saltzberg, “Performance of an efficient parallel data
transmission system,” IEEE Transactions on Communication
Technology, vol. 15, no. 6, pp. 805–811, 1967.
[17] B. Hirosaki, “An orthogonally multiplexed QAM system
using the discrete Fourier transform,” IEEE transactions on
communications systems, vol. 29, no. 7, pp. 982–989, 1981.
[18] H. Bolcskei, P. Duhamel, and R. Hleiss, “Orthogonalization
of OFDM/OQAM pulse shaping filters using the discrete Zak
transform,” Signal Processing, vol. 83, no. 7, pp. 1379–1391,
2003.
[19] P. Siohan, C. Siclet, and N. Lacaille, “Analysis and design
of OFDM/OQAM systems based on filterbank theory,” IEEE
Transactions on Signal Processing, vol. 50, no. 5, pp. 1170–1183,
2002.
[20] M. K. Tsatsanis and G. B. Giannakis, “Transmitter induced
cyclostationarity for blind channel equalization,” IEEE Trans-
actions on Signal Processing, vol. 45, no. 7, pp. 1785–1794,
1997.
[21] M. G. Bellanger, “Specification and design of a prototype filter
for filter bank based multicarrier transmission,” in Proceedings
of the IEEE International Conference on Acoustics, Speech, and
Signal Processing (ICASSP ’01), vol. 4, pp. 2417–2420, 2001.
[22] 3GPP, “ARIB TR-T12-25.943 V4.2.0 Deployment aspects
(Release 4),” 3GPP, June 2002.
[23] A. Sonnenschein and P. M. Fishman, “Radiometric detection
of spread-spectrum signals in noise of uncertain power,” IEEE
Transactions on Aerospace and Electronic Systems,vol.28,no.3,
pp. 654–660, 1992.
[24] R. Tandra and A. Sahai, “SNR walls for signal detection,” IEEE
Journal on Selected Topics in Signal Processing, vol. 2, no. 1, pp.
4–17, 2008.