Báo cáo hóa học: " Research Article Imaging Arterial Fibres Using Diffusion Tensor Imaging—Feasibility Study and Preliminary Results" potx
Bạn đang xem bản rút gọn của tài liệu. Xem và tải ngay bản đầy đủ của tài liệu tại đây (2.95 MB, 13 trang )
Hindawi Publishing Corporation
EURASIP Journal on Advances in Signal Processing
Volume 2010, Article ID 904091, 13 pages
doi:10.1155/2010/904091
Research Article
Imaging Arterial Fibres Using Diffusion Tensor
Imaging—Feasibility Study and Preliminary Results
Vittoria Flamini,
1
Christian Kerskens,
2
Kevin M. Moerman,
3
Ciaran K. Simms,
3
and Caitr
´
ıona Lally
1, 3
1
School of Mechanical and Manufacturing Engineering, Dublin City University, Dublin 9, Ireland
2
Trinity College Institute for Neuroscience, Trinity College Dublin, Dublin 2, Ireland
3
Trinity Centre for Bioengineering, School of Engineering, Trinity College Dublin, Dublin 2, Ireland
Correspondence should be addressed to Caitr
´
ıona Lally,
Received 1 May 2009; Revised 13 August 2009; Accepted 21 November 2009
Academic Editor: Jo
˜
ao Manuel R. S. Tavares
Copyright © 2010 Vittoria Flamini et al. This is an open access article distributed under the Creative Commons Attribution
License, which permits unrestricted use, distribution, and reproduction in any medium, provided the original work is properly
cited.
MR diffusion tensor imaging (DTI) was used to analyze the fibrous structure of aortic tissue. A fresh porcine aorta was imaged at
7T using a spin echo sequence with the following parameters: matrix 128
× 128 pixel; slice thickness 0.5 mm; interslice spacing
0.1 mm; number of slices 16; echo time 20.3 s; field of view 28 mm
× 28 mm. Eigenvectors from the diffusion tensor images
were calculated for the central image slice and the averaged tensors and the eigenvector corresponding to the largest eigenvalue
showed two distinct angles corresponding to near 0
◦
and 180
◦
to the transverse plane of the aorta. Fibre tractography within the
aortic volume imaged confirmed that fibre angles were oriented helically with lead angles of 15
±2.5
◦
and 175 ±2.5
◦
. The findings
correspond to current histological and microscopy data on the fibrous structure of aortic tissue, and therefore the eigenvector maps
and fibre tractography appear to reflect the alignment of the fibers in the aorta. In view of current efforts to develop noninvasive
diagnostic tools for cardiovascular diseases, DTI may offer a technique to assess the structural properties of arterial tissue and
hence any changes or degradation in arterial tissue.
1. Introduction
Cardiovascular diseases are the leading cause of death in
the Western world, accounting for nearly half of all the
deaths in Europe [1]. The most common arterial diseases
are as a result of alterations in the structure of the arterial
wall [2, 3]. Principally, these structural alterations are due
to either degeneration of arterial tissue such as in the case
of aneurysms [3], or the accumulation of lipids within an
artery which can form plaques and stiffen the vessel, as in
atherosclerosis [2]. Arterial diseases often progress without
symptoms to a point where they sufficiently compromise the
circulatory system and subsequently cause a sudden, often
fatal event. In fact, aneurysms can dilate an arterial vessel
to the point where the vessel tears as a result of the blood
pressure, causing a massive haemorrhage [3]. Atherosclerotic
plaques can grow within an arterial lumen obstructing blood
flow and hence oxygen supply to an organ, causing ischemia
[2]. Ischemia can result in serious damage to vital organs and
ultimately can result in myocardial infarction or stroke.
Since arterial diseases may develop in a symptomless way,
the best way to diagnose and treat such diseases is by means
of preventive medicine and screening [2, 4]. The optimal
screening technique should be noninvasive and capable of
detecting early signs of alterations in the arterial structure.
Many hemodynamic studies have investigated the onset
of arterial disease in an attempt to provide early indicators
of arterial disease that may be detected during diagnostic
screening [4, 5]. They have shown that the arterial wall is
an active structure which is subjected to loading and able to
respond to environmental changes. In these studies attention
has been focussed on alterations in the blood flow pattern
in arteries which can create an imbalance in the complex
relationship between the forces that regulate the remodelling
of the arteries [4, 6–8]. In fact, an injury in the arterial wall
or a change in the fluid shear force can trigger an abnormal
2 EURASIP Journal on Advances in Signal Processing
proliferation of the cells, thus causing atherosclerosis. These
studies show that the arterial wall is capable of remodelling
and it continuously adapts tending towards an optimal
balance between stress and strain [4, 7]. In other words,
it could be inferred that arterial diseases can be studied
by means of solid mechanics and that a disease could be
the result of a change in the vessel mechanical properties
[9]. This approach could improve the understanding of
atherosclerosis and could also be used in determining the
aetiology of aneurysms, which, is as yet not completely
understood [3].
In order to perform in vivo studies on the solid mechan-
ics of arteries a noninvasive technique that would expose
the patient to minimal harm must be used. Noninvasive
techniques that are commonly used for the study of arte-
rial diseases include Computed Tomography Angiography
(CTA) [10], Magnetic Resonance Angiography (MRA) [11],
X-Ray Angiography [12], and colour Doppler Ultrasound
[13]. These imaging modalities are limited as they can
only image the blood flow and cannot be used to study
the mechanics of the arterial wall. They can therefore only
provide information on the effect of arterial disease on
blood flow and not the underlying cause. Conventional
imaging techniques like Computed Tomography (CT) [14]
and Magnetic Resonance Imaging (MRI) [15]canbeused
to image the arterial wall; however they can only provide an
anatomical description of a vessel which is insufficient for full
mechanical characterization.
In the 1990s, researchers developed an MRI application
capable of analysing in vivo the axonal structure of the
brain called Diffusion Tensor Imaging (DTI) [16]. DTI is
capable of describing the degree of anisotropy of a tissue
by analysing the diffusion of water molecules. This motion,
which is normally random and hence the same in every
direction, that is, isotropic, is altered and constrained in a
biological tissue, that is, anisotropic, due to the composition
of the underlying microstructure [17]. DTI consists of
measuring the diffusion coefficients of water molecules in
different directions for each pixel of the image and then
creating a diffusion tensor for each pixel [18]. Furthermore,
the direction of greatest diffusion, represented by the first
eigenvector of the diffusion tensor, can be used to provide
information on the fibrous architecture of the tissue, because
water molecules will diffuse preferentially along fibres rather
than across them [17]. The process of determining the
fibre architecture from the diffusion tensor is called fibre
tractography [19]. Since the development of DTI and fibre
tractography [16, 19], these methods have been successfully
applied to the brain [20], the heart [21, 22], skeletal muscle
[23], cartilage [24,
25], and bone [26]. The combination of
DTI and fibre tractography has enabled the architecture of
the fibrous components of these tissues to be established in
vivo.
Arterial tissue can be regarded as a fibre-reinforced
material, because different kinds of fibres are present in
the arterial wall. The arterial wall can be divided in three
layers, each one with its own properties [7, 27]. The
inner one is extremely thin and is called the intima. It is
composed of endothelium and subendothelium and its role
consists of protecting the other layers from plasma lipids
and lipoproteins. The middle layer is the media, where both
elastic laminae and smooth muscle cells (SMCs) are present.
In histological studies reported by Rhodin [27], the elastic
laminae are described to be concentrically arranged, while
SMCs are reportedly oriented diagonally at small angles,
forming a spiral around the vessel. The outer layer is the
adventitia, which is dense fibroelastic tissue without smooth
muscle cells. Large elastic arteries, such as the aorta, contain
high levels of elastin fibres in the media in order that they can
withstand the pulsatile pressure waveform produced by the
heart whilst more muscular arteries contain higher levels of
smooth muscle cells and collagen and lower levels of elastin
[7, 27]. The quantity and distribution of fibres within the
arterial wall and their quality is therefore a direct measure
of the mechanical strength and the health of arterial tissue
[9].
In this study the aim was to assess the applicability of
DTI for determining the fibre structure of arterial tissue.
In particular, DTI was evaluated to establish if it could
determine the helical and near circumferential arrangement
of fibres within the aorta that has been extensively reported
to be present within arterial tissue.
2. Materials and Methods
A porcine aorta was harvested from a six-month-old pig
of Irish breed. The thoracic-abdominal section of the aorta
was cut from the complete aorta. The vessel was 122 mm
long and had a thickness of 2 mm in the proximal section
and 1.5 mm in the distal one. The external connective
tissue was removed from the aorta, and the vessel was
placed in a custom designed cylindrical chamber filled with
water. The chamber had dimensions of 32 mm diameter and
200 mm length. The chamber was designed to fit a circular
polarised whole body Radio Frequency coil for a 7T Biospec
(Bruker Biospin, Germany) Magnetic Resonance Imaging
(MRI) scanner. The sample was scanned within 24 hours
of slaughter according to the following Diffusion Tensor
Imaging (DTI) acquisition protocol: spin echo sequence;
matrix 128
× 128 pixel; slice thickness 0.5 mm; interslice
spacing 0.1 mm; number of slices 16; echo time 20.3 s; field
of view 28 mm
× 28 mm.
Diffusion Tensor Imaging is characterised by the appli-
cation of a diffusion sensitivity gradient over at least six
noncoplanar directions and by the application of a particular
b value, where the b value is a measure of the sensitivity to
diffusion, defined as follows:
S
S
0
= exp
(
−bD
)
,(1)
where S is the signal of the image analysed with an encoding
gradient, S
0
is the signal of a reference image (i.e., one
taken with a null gradient), and D is the diffusion tensor
[17]. The b value influences the signal-to-noise ratio and
also describes the impact that the diffusion has on the
image: when the b value increases, water molecular diffusion
increases and therefore the signal of the image, S, diminishes
along the direction of the gradient and the signal-to-noise
EURASIP Journal on Advances in Signal Processing 3
File.xls
Eigenvector
angle
File.xls
Fibre angle
Evaluate
eigenvector angle
Custom routine
Read binary
tensor file (.inr)
From MedINRIA
MATLAB
MATLAB
Evaluate fibre angle
Custom routine
Coordinate system
from images
Custom routine
File.inr.gz
Te n s o r
Both MATLAB
routines analyse
the data for all
the b values
simultaneously
File.FV
Fibre
coordinates
Images and gradient
MedINRIA
DTI track package
The first two steps
to be repeated
for each b value
considered
Requires the following parameters:
• Background suppression and
smoothing for the tensor;
• FA, fibre length, smoothness of
the fibre, sampling for the fibre
tracking
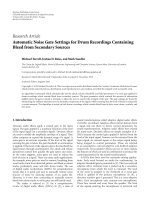
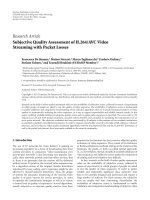
Figure 1: Flow chart indicating the various stages in the image postprocessing sequence.
ratio decreases [28, 29]. In contrast, for low b values the
signal-to-noise ratio can be high but diffusion of water
molecules along fibres is so low that fibre tracking may
be impeded. The b value and the gradient are connected:
the b value is proportional to gradient parameters such as
amplitude, duration, and time spacing and the most suitable
value depends on the tissue type being imaged [29, 30].
Therefore an optimal b value for arterial tissue had to be
determined. In this study the gradient was applied over
six diffusion directions and scans were repeated for six
different b values; in particular the values analysed were:
200, 400, 600, 800, 1200, and 1600 s/mm
2
. Five repetitions
of each measurement were taken and then averaged using
a custom routine implemented in MATLAB. Averaging the
measurements over five repetitions ensured that the results
were more robust; however, measurements obtained from
only one repetition where only the central slice of the image
was considered and where all the slices were considered
showed very little deviation from the averaged results of the
five repetitions; see Tables 1 and 2,respectively.
By analysing the images taken for different diffusion
directions for each pixel it is possible to derive a tensor
that contains the information regarding the local diffusivity.
Moreover, eigenvalues and eigenvectors can be extrapolated
from each diffusion tensor [18]. Diffusion eigenvalues are
important for the determination of a parameter called
fractional anisotropy (FA) [30]. The FA is an index of the
anisotropy of diffusion in the tissue and ranges between
0 and 1, with 0 being isotropy and 1 being complete
anisotropy. The fractional anisotropy is defined according
to (2), where D is the diffusion tensor, λ
1
, λ
2
, λ
3
are its
eigenvalues, and tr(D) is the trace of D [30]:
FA
=
3
2
λ
1
−D
2
+
λ
2
−D
2
+
λ
3
−D
2
λ
2
1
+ λ
2
2
+ λ
2
3
,
D =
tr
(
D
)
3
.
(2)
In addition, diffusion eigenvectors are important for the
determination of fibres patterns; the first eigenvector (i.e., the
vector corresponding to the largest eigenvalue of the tensor)
represents the direction of maximal diffusion and therefore
it represents the predominant fibre direction [17, 19]. Fibre
tractography can be defined as the pixelwise interpolation of
the directions of the first eigenvector. Different interpolation
algorithms are available, and in this study the algorithm
implemented for the DTI fibre analysis was that available
in the software MedINRIA (Sophia Antipolis, France). This
software was chosen because it is optimised for DTI on
clinical datasets. In fact, in order to reduce the noise which
is common in these kinds of acquisitions, MedINRIA applies
a maximum likelihood strategy. The estimation of the tensor,
together with the use of Log-Euclidean metrics for tensor
processing, improves the quality of the fibres reconstructed,
which are tracked by using a streamline algorithm [31].
Using MedINRIA the diffusion tensor for each b value was
evaluated and the fibre tractography was performed. In order
4 EURASIP Journal on Advances in Signal Processing
Table 1: Evaluation of the difference in the eigenvector angles between each repetition and the average over all the repetitions for the central
slice of the image.
Angles between 0
◦
–90
◦
Angles between 90
◦
–180
◦
Most prevalent % of Most prevalent % of
angle range (
◦
) occurrence angle range (
◦
) occurrence
Repetition n.1
b15
±2.5 7.29 175 ±2.54.19
b25
±2.5 9.12 175 ±2.56.50
b35
±2.5 12.35 175 ±2.58.42
b45
±2.5 13.49 175 ±2.5 11.00
b55
±2.5 15.76 175 ±2.5 10.87
b65
±2.5 17.50 175 ±2.5 10.87
Repetition n.2
b15
±2.5 8.64 175 ±2.55.94
b25
±2.5 10.74 175 ±2.58.77
b35
±2.5 13.23 175 ±2.5 12.31
b45
±2.5 15.58 175 ±2.5 12.13
b55
±2.5 17.29 175 ±2.5 13.66
b65
±2.5 18.33 175 ±2.5 15.28
Repetition n.3
b15
±2.5 9.04 175 ±2.56.90
b25
±2.5 14.14 175 ±2.5 10.13
b35
±2.5 13.71 175 ±2.5 11.39
b45
±2.5 17.63 175 ±2.5 11.39
b55
±2.5 19.21 175 ±2.5 10.43
b65
±2.5 19.07 175 ±2.5 14.01
Repetition n.4
b15
±2.5 8.77 175 ±2.55.46
b25
±2.5 13.18 175 ±2.58.90
b35
±2.5 13.05 175 ±2.5 10.91
b45
±2.5 14.80 175 ±2.5 11.65
b55
±2.5 18.07 175 ±2.5 12.75
b65
±2.5 16.89 175 ±2.5 11.48
Repetition n.5
b15
±2.5 8.47 175 ±2.56.11
b25
±2.5 10.30 175 ±2.58.77
b35
±2.5 14.80 175 ±2.5 11.48
b45
±2.5 16.06 175 ±2.5 12.13
b55
±2.5 19.82 175 ±2.5 13.09
b65
±2.5 19.82 175 ±2.5 13.09
Averaged repetitions
b120
±2.5 9.15 160 ±2.58.77
b25
±2.5 11.41 175 ±2.5 10.88
b35
±2.5 15.28 175 ±2.5 12.39
b45
±2.5 17.92 175 ±2.5 11.62
b55
±2.5 19.01 175 ±2.5 15.14
b65
±2.5 18.56 175 ±2.5 15.14
to proceed with the fibre tractography a region of interest
(ROI) was manually defined that corresponded to the area
between the external and internal boundary of the aorta,
as delineated from the central image slice of the aorta. The
software then tracked all the fibres passing through that
ROI. The fibre tractography parameters were determined
through previous DTI empirical measurements on aortic
tissue and these parameters include the FA, the sampling
pixel number, the minimum fibre length in mm and the
smoothing interpolation of the fibres. These parameters were
defined as follows: the FA was set to 0.2, the value for
which no fibres were tracked in the water; the sampling pixel
number was set to 3, the number of pixels used to determine
the initial fibre vector direction; the minimum fibre length
was set to 10 mm; and the smoothing of the interpolated fibre
was set to 20% [32]; see the appendix for more details on the
process used to determine these parameters.
Subsequently, in MATLAB (Natick, MA, USA) two
custom routines were implemented, one for the analysis
of the tensor and one for the analysis of the orientation
of fibres; see Figure 1. The tensor analysis consisted of the
extrapolation of the first eigenvector from the tensor, and
EURASIP Journal on Advances in Signal Processing 5
Table 2: Evaluation of the difference in the eigenvector angles between each repetition and the average over all of the repetitions. In this case
themeasurementisaveragedoveralloftheslicesofthevolume.
Angles between 0
◦
–90
◦
Angles between 90
◦
–180
◦
Most prevalent % of Most prevalent % of
angle range (
◦
) occurrence angle range(
◦
) occurrence
Repetition n.1
b15
±2.5 7.09 175 ±2.54.36
b25
±2.5 9.76 175 ±2.56.72
b35
±2.5 11.33 175 ±2.58.42
b45
±2.5 12.55 175 ±2.5 10.06
b55
±2.5 15.08 175 ±2.5 10.72
b65
±2.5 14.99 175 ±2.5 10.43
Repetition n.2
b15
±2.5 8.69 175 ±2.55.50
b25
±2.5 10.85 175 ±2.58.34
b35
±2.5 12.70 175 ±2.5 10.13
b45
±2.5 14.21 175 ±2.5 11.15
b55
±2.5 16.28 175 ±2.5 11.37
b65
±2.5 15.63 175 ±2.5 12.48
Repetition n.3
b15
±2.5 8.18 175 ±2.56.35
b25
±2.5 11.59 175 ±2.59.21
b35
±2.5 12.96 175 ±2.5 10.72
b45
±2.5 15.93 175 ±2.5 11.24
b55
±2.5 16.19 175 ±2.5 11.48
b65
±2.5 17.59 175 ±2.5 12.72
Repetition n.4
b15
±2.5 8.12 175 ±2.55.52
b25
±2.5 11.48 175 ±2.59.54
b35
±2.5 12.85 175 ±2.5 10.32
b45
±2.5 14.45 175 ±2.5 11.04
b55
±2.5 16.17 175 ±2.5 11.11
b65
±2.5 16.80 175 ±2.5 11.26
Repetition n.5
b15
±2.5 7.42 175 ±2.55.63
b25
±2.5 11.46 175 ±2.58.36
b35
±2.5 12.44 175 ±2.5 10.10
b45
±2.5 13.29 175 ±2.5 12.00
b55
±2.5 16.24 175 ±2.5 12.31
b65
±2.5 16.24 175 ±2.5 12.31
Averaged repetition
b120
±2.5 9.14 175 ±2.57.45
b25
±2.5 10.28 175 ±2.59.35
b35
±2.5 12.57 175 ±2.5 10.14
b45
±2.5 14.65 175 ±2.5 10.48
b55
±2.5 13.45 175 ±2.5 13.20
b65
±2.5 14.03 175 ±2.5 13.31
the determination of the angle it formed with the x-y plane,
as illustrated in Figure 2(a). This was conducted on a single
slice of the image (the central one). In order to study the
consistency of the results over the length of the sample, the
average of the tensor over all the slices was considered, and
the angle of the eigenvector calculated. In both cases the
study was focused on the ROI defined in MedINRIA.
The fibre distribution was analysed in another routine
that assumed each fibre to be a portion of a helix. Conse-
quently, the fibres could be represented by the following set
of equations which are the general equations for a helix [33]:
x
= R cos
(
t
)
,
y
= R sin
(
t
)
,
z
= ct,
(3)
where t is the angle with the x axis, R is the radius and c is the
lead. From these equations the definition of the helix angle
can be derived and used to define the lead fibre angle, that is,
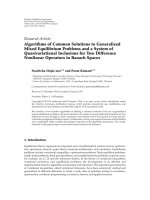
the angle shown in Figure 2(b), as follows:
tan
(
θ
)
=
c
R
. (4)
6 EURASIP Journal on Advances in Signal Processing
z
Fibre angle
Plane x-y
Fibres
θ
(a)
2πc
2πR
θ
(b)
Figure 2: (a) Convention for the lead fibre angles calculated in this
study; (b) definition of the fibre angle.
In order to apply these equations the fibres’ coordinates,
which were stored in an ASCII coded text file, needed to
be converted from the image reference system to cylindrical
coordinates, and therefore a centre had to be determined.
Therefore, the ROI mask was used to determine the centre
of mass of the aortic section and this was taken as the origin
of the reference cylindrical coordinate system. Once the
coordinates were converted, (4) was applied and the resultant
fibre angle distribution was computed. For each fibre, the
fibre angle was evaluated for each point of the fibre and then
the median was taken. Test helices were created in MATLAB
for the purpose of testing this routine. The helices had known
angles (30
◦
,45
◦
,and−30
◦
), and the routine described above
was successful in determining their lead angles.
3. Results
The process of determining the fibrous structure of the aortic
tissue is illustrated in Figure 3, where all of the steps in the
imaging and postprocessing procedure are shown. Firstly,
the anatomical image resulting from the scan is used to
determine the ROI; see Figures 3(a) and 3(b). Secondly,
the diffusion tensor is analysed in MATLAB and the angle
between the first eigenvector and the x-y plane determined
and mapped onto the ROI; see Figures 3(c) and 3(d).From
both of these images it can be seen that the region of the
aorta in the image is still recognisable using the tensor map.
Finally, the tensor is analysed using MedINRIA and the fibres
tracked through the ROI of the aorta; see Figures 3(e) and
3(f). From these images it can be seen that the fibres plotted
are distributed throughout the thickness of the aorta and that
they are predominantly oriented circumferentially within the
x-y plane of the aorta.
The results for the tensor orientation were analysed for
different b values to determine the influence of the b value
on the tensor angles obtained. For the tensor representing
the central slice and the averaged tensor, the angle between
the first eigenvector and the x-y plane had greater variability
for small b values and became increasingly more consistent
at higher b values; see Figures 4 and 5. Two dominant
eigenvector angles, close to 0
◦
and 180
◦
, are evident for the
analysis of the tensors of the central slice image for all b
values (Figure 4), whilst three, close to 0
◦
,90
◦
and 180
◦
,
are present in the averaged images (Figure 5). However, by
using the parameters defined above to carry out the fibre
tractography such that the fibre angles were tracked, two
dominant fibre angles were found between 15
◦
± 2.5
◦
and
175
◦
±2.5
◦
, respectively (Figures 6 and 7). These angles were
found to be independent of the b value applied during the
imaging sequence. In the fibre tractography plots (Figures 6
and 7), the fibre angle distribution is evaluated over bands of
5
◦
, and centred in the middle of each band.
4. Discussion and Conclusions
The arterial wall constitutes a highly organized tissue which
must withstand a complex network of forces acting on it, as
shown by Burton [6]andPetersonetal.[34]. The organisa-
tion of the tissue is therefore of utmost importance, as it has
to offer distensibility and resistance [7]. The arterial tissue
mechanical properties are derived from its microstructure
which is constituted by collagen, elastin fibres, SMCs, and
ground substances [27]. The fibrous components reinforce
the structure and their distribution generally corresponds
to the direction of maximum stress [6, 7]. The orientation
of arterial fibrous components has been studied with many
different techniques including histology [27], scanning elec-
tron microscopy (SEM) [35], confocal electron microscopy
[36], and confocal laser scanning microscopy [37]. All of
these techniques were consistent in finding that arterial
tissue fibres are woven according to a helical pattern with
a small pitch. In particular, in the study from O’Connell
et al. [37], where the three-dimensional architecture of
arterial fibres was reconstructed by means of microscopy,
they demonstrated that all three fibrous constituents of the
artery (i.e., collagen, elastin fibres, and SMCs) are aligned
predominantly in the circumferential direction and in partic-
ular approximately
±10
◦
from the circumferential direction.
The results presented in the current study are in accordance
with this result. Firstly, by looking at Tables 1 and 2 it can
be seen that in every repetition (as well as in the averaged
EURASIP Journal on Advances in Signal Processing 7
(a) (b)
0
◦
180
◦
(c)
0
◦
180
◦
(d) (e) (f)
Figure 3: Steps in the DTI procedure and image postprocessing; (a) MRI anatomical scan, (b) the ROI of the aorta, (c) a map of the angle of
the first eigenvector with the x-y plane, (d) a map of the angle of the first eigenvector with the x-y plane with the ROI clearly identified, (e)
the results of the tractography process with the fibres superimposed on the reference image, and (f) the aortic fibres within the ROI alone.
repetitions) the eigenvector angle is predominantly oriented
in the range of 5
± 2.5
◦
and 175 ± 2.5
◦
. The tensor maps,
where the angle of the first eigenvector with the x-y plane
is mapped, also show that the main diffusion direction has
a small angle. In particular, by looking at the map for a
single slice, it is clear to see that only the angular extremes,
0
◦
and 180
◦
, are evident on the contour map of the artery
(Figure 4). This trend was seen in all individual slices where
the eigenvector of the diffusion tensor was determined;
however, when considering the overall sample, as in Figure 4,
areas with eigenvectors at 90
◦
to the x-y plane are also
present. By comparing the maps of the pixelwise eigenvectors
for individual slices (central slices are shown in Figure 4)
to that of the averaged tensor (Figure 5), it appears that
some changes in the diffusion direction occur in parts of
the vessel such that pixels with 0
◦
and 180
◦
eigenvector
angles in different slices when averaged result in an angle
of 90
◦
. Therefore, analysis of the averaged tensor gives an
indication of changes in the diffusion along the length of the
vessel whilst individual slices give information on the local
diffusion and may be indicators of fibre directions in specific
regions of the vessel.
To establish fibre directions more conclusively, fibre trac-
tography needs to be performed and the fibre tractography
on the diffusion tensors in the current study identified
dominant fibre angles of 15
± 2.5
◦
and 175 ± 2.5
◦
,as
seen in Figures 6 and 7. This is consistent with the fibre
direction reported in the literature for arterial tissue by
O’Connell et al. [37]. This result is also in agreement with
the eigenvector angles obtained directly from the diffusion
tensor. Differences between the eigenvector angles and the
fibre angles are to be expected due to the fact that these can
be regarded as two different entities. In fact, even though the
determination of the fibres is based on eigenvector angles,
it is the three-dimensional eigenvector arrangement that
dictates the fibre together with the constraints imposed by
the tractography algorithm.
All of these results support the use of DTI as a means
of obtaining a reliable description of the natural fibre
orientation of arterial tissue in a noninvasive way; whereas
techniques such as histology and microscopy need the tissue
to be harvested and fixed. Harvesting the vessel, whilst
clearly invasive, also has implications for the structural
properties since that it removes any in situ longitudinal or
circumferential prestretches. Moreover, with most of these
techniques only small bi-dimensional portions of the arterial
wall can be analysed, while with DTI it is possible to obtain
the global, three-dimensional, fibre orientations.
8 EURASIP Journal on Advances in Signal Processing
b1
0
◦
20
◦
40
◦
60
◦
80
◦
100
◦
120
◦
140
◦
160
◦
180
◦
(a)
b2
0
◦
20
◦
40
◦
60
◦
80
◦
100
◦
120
◦
140
◦
160
◦
180
◦
(b)
b3
0
◦
20
◦
40
◦
60
◦
80
◦
100
◦
120
◦
140
◦
160
◦
180
◦
(c)
b4
0
◦
20
◦
40
◦
60
◦
80
◦
100
◦
120
◦
140
◦
160
◦
180
◦
(d)
b5
0
◦
20
◦
40
◦
60
◦
80
◦
100
◦
120
◦
140
◦
160
◦
180
◦
(e)
b6
0
◦
20
◦
40
◦
60
◦
80
◦
100
◦
120
◦
140
◦
160
◦
180
◦
(f)
Figure 4: Contour maps of the angle between the first eigenvector and the x-y plane for the central slices of the image data sets for the
different b values.
Another interesting feature of this study is the determi-
nation of the most appropriate b value for the analysis of
the fibrous orientation within the arterial wall. The optimal
b value in DTI is dependant on the tissue being studied;
for example, a value of 1000 s/mm
2
has been reported for
cartilage [24], whilst 400 s/mm
2
has been used for the medial
nerve in the human wrist [28, 38], and values between 500
and 800 s/mm
2
for the myocardium [39, 40]. The b value
appears to be connected with the composition of the tissue
studied and therefore can be used for the diagnosis of
diseases that alter such composition [41, 42].
To the best of the authors’ knowledge a suitable b value
for DTI of arteries has not been reported to date and
therefore a range of increasing b values were used in this
feasibility study. To find the optimal b value the information
in each image set for this range of b values had to be analysed,
in particular the amount of significant data obtained in
each image had to be quantified. For each b value the
EURASIP Journal on Advances in Signal Processing 9
b1
0
◦
20
◦
40
◦
60
◦
80
◦
100
◦
120
◦
140
◦
160
◦
180
◦
(a)
b2
0
◦
20
◦
40
◦
60
◦
80
◦
100
◦
120
◦
140
◦
160
◦
180
◦
(b)
b3
0
◦
20
◦
40
◦
60
◦
80
◦
100
◦
120
◦
140
◦
160
◦
180
◦
(c)
b4
0
◦
20
◦
40
◦
60
◦
80
◦
100
◦
120
◦
140
◦
160
◦
180
◦
(d)
b5
0
◦
20
◦
40
◦
60
◦
80
◦
100
◦
120
◦
140
◦
160
◦
180
◦
(e)
b6
0
◦
20
◦
40
◦
60
◦
80
◦
100
◦
120
◦
140
◦
160
◦
180
◦
(f)
Figure 5: Contour maps of the angle between the first eigenvector and the x-y plane for the averaged tensors of the image data sets for the
different b values.
tensor maps and the fibre tracts were analysed and data
such as the eigenvector angle and fibre angle distribution
were extrapolated. Finally, these data were compared over
the different b values in order to define the optimal one. It
is possible to make this comparison by looking at the results
shown in Figures 4–6.
For b values less than or equal to 600 s/mm
2
it can
be seen that while there is agreement with higher b values
in terms of the fibre angles plotted (Figures 6 and 7), the
corresponding tensor map is not coherent. It can be seen in
Figures 4 and 5 that for b1andb2avarietyofanglesare
obtained; whereas for higher b values and in particular for
b4, the angles determined converge on two dominant angles.
This is supported also by an analysis of the eigenvector
angle orientation for the different repetitions. Tables 1
and 2 show that for b1 the orientation registered in the
average of the repetitions is different from that obtained
for each single repetition. This is due to the higher level of
incoherence of pixel values at b1 over the different repeti-
tions.
10 EURASIP Journal on Advances in Signal Processing
0 20 40 60 80 100 120 140 160 180
Fibre angle (
◦
)
0
100
200
300
400
500
600
700
800
Fibre (number)
b1 =200s/mm
2
b2 =400s/mm
2
b3 =600s/mm
2
b4 =800s/mm
2
b5 =1200s/mm
2
b6 =1600s/mm
2
(a)
0 20 40 60 80 100 120 140 160 180
Fibre angle (
◦
)
0
5
10
15
20
25
Fibre (%)
b1 =200s/mm
2
b2 =400s/mm
2
b3 =600s/mm
2
b4 =800s/mm
2
b5 =1200s/mm
2
b6 =1600s/mm
2
(b)
Figure 6: Distribution of the fibre angles over the analysed volume
for different b values, (a) number of fibres; (b) percentages of fibres.
The fibre angles are evaluated over bands of 5
◦
and centered in the
middle of each band.
At the same time, for b values higher than 800 s/mm
2
,
the tensor maps show small changes, especially in Figure 5.
This is confirmed in Figure 6 where the number of fibres with
intermediate angles, especially in the range between 40
◦
–90
◦
obtained for b5andb6 are higher than at b4. In addition, the
highest number of fibres is tracked for values in the range
b2tob4 whilst the number reduces from b2tob1, and
b4tob6. These results suggest that the optimal b value for
arteries may be around 800 s/mm
2
(b4), as this is the value
0 102030405060708090
Fibre angle (
◦
)
0
5
10
15
20
25
Fibre (%)
b1 =200s/mm
2
b2 =400s/mm
2
b3 =600s/mm
2
b4 =800s/mm
2
b5 =1200s/mm
2
b6 =1600s/mm
2
(a)
90 100 110 120 130 140 150 160 170 180
Fibre angle (
◦
)
0
5
10
15
20
25
Fibre (%)
b1 =200s/mm
2
b2 =400s/mm
2
b3 =600s/mm
2
b4 =800s/mm
2
b5 =1200s/mm
2
b6 =1600s/mm
2
(b)
Figure 7: Histogram representing the fibre angle distribution for
different b values. For ease of representation it has been split into
two graphs: (a) 0
◦
to 90
◦
;(b)90
◦
to 180
◦
. The angles are evaluated
over bands of 5
◦
and centered in the middle of each band.
for which there is a balance between the eigenvector angles
in the tensor maps and the fibre data obtained by the fibre
tracking procedure.
A limitation of this study is a lack of direct validation
of these results through histology [27] or through other
microscopic techniques [35–37]. The main objective of this
study, however, was to use DTI for imaging the arterial
structure and to compare the preliminary results obtained
with the data available in the literature in order to show
EURASIP Journal on Advances in Signal Processing 11
the feasibility of this approach. Another limitation was the
analysis of a vessel in the unloaded configuration, whereby
the circumferential stretch was preserved, but the longitudi-
nal stretch was lost. Taking these limitations into account it is
still clear that DTI of arterial tissue is feasible and that it can
be used to successfully image the fibrous structure of arterial
tissue in a noninvasive way.
In the future, DTI of an arterial vessel in a longitudinally
tethered state and loaded with a pulsatile lumen pressure will
be carried out, and finally the technique will be translated
to an in vivo setting. The result of this procedure will be a
noninvasive imaging technique with the potential to study
the fibrous architecture of arteries in vivo which can be used
for early diagnosis of arterial diseases.
Appendix
The appropriate tensor and tractography parameters were
defined by means of a number of sensitivity tests. In order
to obtain the most suitable value for each parameter, a range
of values were applied and the differences observed between
the results obtained considered, to establish the most suitable
parameter for this particular application.
For the tensor parameters, the background suppression
and the tensor smoothing had to be set. The background
suppression consists in setting a threshold on the signal of the
image under which no tensor will be estimated, based on the
reference image S
o
. This value was set to 1,000 (compared to a
maximum signal of 32,766) in order not to interfere with the
fibre tracking due to the fact that some areas of the arterial
tissue were nearly as dark as the background. Regarding the
tensor smoothing, a feature available in MedINRIA to reduce
the noise of the tensor was set to “high,” because by analysing
the different FA maps, this was found to be the only value that
would suppress the effect of the surrounding water.
For the fibre tractography, the optimal FA threshold, the
minimum fibre length, the smoothness of the fibres, and the
sampling parameters had to be established. The FA value
was analysed first. Fractional anisotropy can be regarded
as a tool to erase the noise and therefore the threshold
value of FA influenced the amount of fibres tracked in the
total image volume. The optimal FA should track fibres
predominantly in the region of interest. For the aorta
encased in fluid, extremely low FA threshold values (<0.15)
resulted in large amounts of fibres being tracked in the water
volume, while high FA threshold values (>0.3) resulted in
very few fibres being tracked even in the aortic volume.
Empirically we found that for an FA threshold value of 0.2
most of the fibres were tracked in the aortic volume and
almost none in the water. Following the establishment of
a suitable FA value, the effect of the minimum length of
the fibre tracked was considered. Over two different sets
of images, three different fibre lengths were considered; 5,
10, and 15 mm. For a setting of 5 mm many fragmented
fibresweretrackedwhilefor15mmonlyafewfibres,
albeit extremely long fibres, were tracked. By comparison
to available histological data on aortic tissue, a minimum
fibre length of 10 mm showed an optimal tradeoff between
the number of fibres and their length for all the different b
values and enabled a suitable sample from which average
fibre directions could be ascertained. The value of 10 mm
corresponds to one third of the planar resolution of the
image. The influence of the smoothness parameter on the
fibres tracked was also addressed. This parameter defines
the smoothness of the curvature of the final fibre and
ensures that large discontinuities in curvature from pixel to
pixel of the image are identified such that they cannot be
considered one fibre. For the chosen fibre length of 10 mm,
variations in the smoothness value over a large range (20%–
80%) showed that the fibre number tracked is relatively
insensitive to this parameter and a value of 20% was applied
to all subsequent images. Finally, the sampling parameter
was investigated. The sampling parameter accounts for the
number of pixels used for the determination of the fibre.
A sampling parameter of one pixel, although extremely
accurate, is computationally expensive. Empirically we found
that a sampling parameter of three, where fibre tracking is
only performed in one voxel out of each three, yields very
good accuracy by comparison to a sampling of one pixel and
reduces the computational time considerably [32].
List of Symbols
S
0
: Image with a null gradient (reference image)
S: Image corresponding to an encoding gradient
bi:Sensitivitytodiffusion factor, i
= [1–6]
D:Diffusion tensor
λ
i
:Eigenvalues,i = [1,2,3]
t: Angle with the x axis
c: Helix lead constant
R: Helix radius
θ:Fibreangle.
Acknowledgment
This project is funded by a Research Frontiers Grant (06/
RF/ENM076) awarded by Science Foundation Ireland.
References
[1] S. Petersen, V. Peto, M. Rayner, J. Leal, R. Luengo-Fernandez,
and A. Gray, European Cardiovascular Disease Statistics,
Department of Public Health, University of Oxford, Oxford,
UK, 2005.
[2] M. A. Crowther, “Pathogenesis of atherosclerosis,” in ASH
Education Program Book, pp. 436–441, American Society of
Hematology, 2005.
[3] N. Sakalihasan, R. Limet, and O. D. Defawe, “Abdominal aortic
aneurysm,” The Lancet, vol. 365, no. 9470, pp. 1577–1589,
2005.
[4] G. Pasterkamp, D. P. V. de Kleijn, and C. Borst, “Arterial
remodeling in atherosclerosis, restenosis and after alteration of
blood flow: potential mechanisms and clinical implications,”
Cardiovascular Research, vol. 45, no. 4, pp. 843–852, 2000.
[5] D. N. Ku, “Blood flow in arteries,” Annual Review of Fluid
Mechanics, vol. 29, pp. 399–434, 1997.
[6] A. C. Burton, “Physical principles of circulatory phenomena:
the physical equilibria of the heart and blood vessels,”
12 EURASIP Journal on Advances in Signal Processing
in Handbook of Physiology, American Physiological Society,
Bethesda, Md, USA, 1959.
[7] G. S. Kassab, “Biomechanics of the cardiovascular system: the
aorta as an illustratory example,” Journal of the Royal Society
Interface, vol. 3, no. 11, pp. 719–740, 2006.
[8] R. A. Peattie, T. J. Riehle, and E. I. Bluth, “Pulsatile flow in
fusiform models of abdominal aortic aneurysms: flow fields,
velocity patterns and flow-induced wall stresses,” Journal of
Biomechanical Engineering, vol. 126, no. 4, pp. 438–446, 2004.
[9] L. de Figueiredo Borges, R. G. Jaldin, R. R. Dias, N. A. G. Stolf,
J B. Michel, and P. S. Gutierrez, “Collagen is reduced and
disrupted in human aneurysms and dissections of ascending
aorta,” Human Pathology, vol. 39, no. 3, pp. 437–443, 2008.
[10] G. G. Hartnell, “Imaging of aortic aneurysms and dissection:
CT and MRI,” Journal of Thoracic Imaging,vol.16,no.1,pp.
35–46, 2001.
[11] S. G. Ruehm, M. Goyen, J. Barkhausen, et al., “Rapid magnetic
resonance angiography for detection of atherosclerosis,” The
Lancet, vol. 357, no. 9262, pp. 1086–1091, 2001.
[12] C. Blondel, R. Vaillant, F. Devernay, G. Malandain, and N.
Ayache, “Automatic trinocular 3D reconstruction of coronary
artery centerlines from rotational X-ray angiography,” in
Proceedings of the Computer Assisted Radiology and Surgery,pp.
1073–1078, 2002.
[13] J. Golzarian, S. Murgo, L. Dussaussois, et al., “Evaluation
of abdominal aortic aneurysm after endoluminal treatment:
comparison of color Doppler sonography with biphasic helical
CT,” American Journal of Roentgenology, vol. 178, no. 3, pp.
623–628, 2002.
[14] Z. A. Fayad, V. Fuster, K. Nikolaou, and C. Becker, “Computed
tomography and magnetic resonance imaging for noninvasive
coronary angiography and plaque imaging: current and
potential future concepts,” Circulation, vol. 106, no. 15, pp.
2026–2034, 2002.
[15] J F. Toussaint, G. M. LaMuraglia, J. F. Southern, V. Fuster, and
H. L. Kantor, “Magnetic resonance images lipid, fibrous, cal-
cified, hemorrhagic, and thrombotic components of human
atherosclerosis in vivo,” Circulation, vol. 94, no. 5, pp. 932–
938, 1996.
[16] P. J. Basser and C. Pierpaoli, “Microstructural and physio-
logical features of tissues elucidated by quantitative-diffusion-
tensor MRI,” Journal of Magnetic Resonance, Series B, vol. 111,
no. 3, pp. 209–219, 1996.
[17] P. J. Basser and D. K. Jones, “Diffusion-tensor MRI: theory,
experimental design and data analysis—a technical review,”
NMR in Biomedicine, vol. 15, no. 7-8, pp. 456–467, 2002.
[18] P. B. Kingsley, “Introduction to diffusion tensor imaging
mathematics—part I: tensors, rotations, and eigenvectors,”
Concepts in Magnetic Resonance Part A, vol. 28, no. 2, pp. 101–
122, 2006.
[19] S. Mori and P. C. M. Van Zijl, “Fiber tracking: principles and
strategies—a technical review,” NMR in Biomedicine, vol. 15,
no. 7-8, pp. 468–480, 2002.
[20] S. Mori and J. Zhang, “Principles of diffusion tensor imaging
and its applications to basic neuroscience research,” Neuron,
vol. 51, no. 5, pp. 527–539, 2006.
[21] T. G. Reese, R. M. Weisskoff,R.N.Smith,B.R.Rosen,R.
E. Dinsmore, and V. J. Wedeen, “Imaging myocardial fiber
architecture in vivo with magnetic resonance,” Magnetic
Resonance in Medicine, vol. 34, no. 6, pp. 786–791, 1995.
[22] G. D. Buckberg, A. Mahajan, B. Jung, M. Markl, J. Hennig,
and M. Ballester-Rodes, “MRI myocardial motion and fiber
tracking: a confirmation of knowledge from different imaging
modalities,” European Journal of Cardio-Thoracic Surgery, vol.
29, supplement 1, pp. S165–S177, 2006.
[23] D. A. Lansdown, Z. Ding, M. Wadington, J. L. Hornberger,
and B. M. Damon, “Quantitative diffusion tensor MRI-based
fiber tracking of human skeletal muscle,” Journal of Applied
Physiology, vol. 103, no. 2, pp. 673–681, 2007.
[24] L. Filidoro, O. Dietrich, J. Weber, et al., “High-resolution diffu-
sion tensor imaging of human patellar cartilage: feasibility and
preliminary findings,” Magnetic Resonance in Medicine, vol. 53,
no. 5, pp. 993–998, 2005.
[25] P. Julkunen, R. K. Korhonen, M. J. Nissi, and J. S. Jurvelin,
“Mechanical characterization of articular cartilage by combin-
ing magnetic resonance imaging and finite-element analysis—
a potential functional imaging technique,” Physics in Medicine
and Biology, vol. 53, no. 9, pp. 2425–2438, 2008.
[26] S. Capuani, C. Rossi, M. Alesiani, and B. Maraviglia, “Diffu-
sion tensor imaging to study anisotropy in a particular porous
system: the trabecular bone network,” Solid State Nuclear
Magnetic Resonance, vol. 28, no. 2–4, pp. 266–272, 2005.
[27] J. A. G. Rhodin, “Architecture of the vessel wall,” in Handbook
of Physiology,AmericanPhysiologicalSociety,Bethesda,Md,
USA, 1980.
[28] G. Andreisek, L. M. White, A. Kassner, G. Tomlinson, and M.
S. Sussman, “Diffusion tensor imaging and fiber tractography
of the median nerve at 1.5 T: optimization of b value,” Skeletal
Radiology, vol. 38, no. 1, pp. 51–59, 2009.
[29] P.Mukherjee,J.I.Berman,S.W.Chung,C.P.Hess,andR.G.
Henry, “Diffusion tensor MR imaging and fiber tractography:
theoretic underpinnings,” American Journal of Neuroradiology,
vol. 29, no. 4, pp. 632–641, 2008.
[30] P. B. Kingsley, “Introduction to diffusion tensor imaging
mathematics—part II: anisotropy, diffusion-weighting fac-
tors, and gradient encoding schemes,” Concepts in Magnetic
Resonance Part A, vol. 28, no. 2, pp. 123–154, 2006.
[31] P. Filiard, X. Pennec, V. Arsigny, and N. Ayache, “Clinical
DT-MRI estimation, smoothing, and fiber tracking with log-
Euclidean metrics,” IEEE Transactions on Medical Imaging, vol.
26, no. 11, pp. 1472–1482, 2007.
[32] P. Fillard, J. C. Souplet, and N. Toussaint, Medical Image
Navigation and Research Tool by INRIA (MedINRIA), INRIA
Sophia Antipolis, Sophia Antipolis, France, 2007.
[33] E. Kreyszig, Advanced Engineering Mathematics, John Wiley &
Sons, New York, NY, USA, 1999.
[34] L. H. Peterson, R. E. Jensen, and J. Parnell, “Mechanical
properties of arteries in vivo,” Circulation Research, vol. 8, no.
3, pp. 622–639, 1980.
[35] J. M. Clark and S. Glagov, “Transmural organization of the
arterial media. The lamellar unit revisited,” Arteriosclerosis,
Thrombosis, and Vascular Biology, vol. 5, no. 1, pp. 19–34,
1985.
[36] P. Farand, A. Garon, and G. E. Plante, “Structure of large
arteries: orientation of elastin in rabbit aortic internal elastic
lamina and in the elastic lamellae of aortic media,” Microvas-
cular Research, vol. 73, no. 2, pp. 95–99, 2007.
[37] M. K. O’Connell, S. Murthy, S. Phan, et al., “The three-
dimensional micro- and nanostructure of the aortic medial
lamellar unit measured using 3D confocal and electron
microscopy imaging,” Matrix Biology, vol. 27, no. 3, pp. 171–
181, 2008.
[38] C. Khalil, C. Hancart, V. Le Thuc, C. Chantelot, D. Chechin,
and A. Cotten, “Diff
usion tensor imaging and tractography
of the median nerve in carpal tunnel syndrome: preliminary
results,” European Radiology, vol. 18, no. 10, pp. 2283–2291,
2008.
EURASIP Journal on Advances in Signal Processing 13
[39] J. Chen, S K. Song, W. Liu, et al., “Remodeling of cardiac
fiber structure after infarction in rats quantified with diffusion
tensor MRI,” American Journal of Physiology, vol. 285, no. 3,
pp. H946–H954, 2003.
[40] W Y. I. Tseng, V. J. Wedeen, T. G. Reese, R. N. Smith, and E.
F. Halpern, “Diffusion tensor MRI of myocardial fibers and
sheets: correspondence with visible cut-face texture,” Journal
of Magnetic Resonance Imaging, vol. 17, no. 1, pp. 31–42, 2003.
[41] G. Tang, Y. Liu, W. Li, J. Yao, B. Li, and P. Li, “Optimization of b
value in diffusion-weighted MRI for the differential diagnosis
of benign and malignant vertebral fractures,” Skeletal Radiol-
ogy, vol. 36, no. 11, pp. 1035–1041, 2007.
[42] H.S.Seo,K H.Chang,D.G.Na,B.J.Kwon,andD.H.Lee,
“High b-value diffusion (b
= 3000 s/mm
2
) MR imaging in
cerebral gliomas at 3T: visual and quantitative comparisons
with b
= 1000 s/mm
2
,” American Journal of Neuroradiology,
vol. 29, no. 3, pp. 458–463, 2008.