Báo cáo hóa học: "Clinically important improvement in the WOMAC and predictor factors for response to non-specific non-steroidal anti-inflammatory drugs in osteoarthritic patients: a prospective study" docx
Bạn đang xem bản rút gọn của tài liệu. Xem và tải ngay bản đầy đủ của tài liệu tại đây (256.77 KB, 22 trang )
This Provisional PDF corresponds to the article as it appeared upon acceptance. Fully formatted
PDF and full text (HTML) versions will be made available soon.
Clinically important improvement in the WOMAC and predictor factors for
response to non-specific non-steroidal anti-inflammatory drugs in osteoarthritic
patients: a prospective study
BMC Research Notes 2012, 5:58 doi:10.1186/1756-0500-5-58
Ihsane Hmamouchi ()
Fadoua Allali ()
Latifa Tahiri ()
Hamza Khazzani ()
Leila EL Mansouri ()
Sanae ALI OU Alla ()
Redouane Abouqal ()
Najia Hajjaj-Hassouni ()
ISSN 1756-0500
Article type Research article
Submission date 14 September 2011
Acceptance date 23 January 2012
Publication date 23 January 2012
Article URL />This peer-reviewed article was published immediately upon acceptance. It can be downloaded,
printed and distributed freely for any purposes (see copyright notice below).
Articles in BMC Research Notes are listed in PubMed and archived at PubMed Central.
For information about publishing your research in BMC Research Notes or any BioMed Central
journal, go to
/>BMC Research Notes
© 2012 Hmamouchi et al. ; licensee BioMed Central Ltd.
This is an open access article distributed under the terms of the Creative Commons Attribution License ( />which permits unrestricted use, distribution, and reproduction in any medium, provided the original work is properly cited.
Clinically important improvement in the
WOMAC and predictor factors for response to
non-specific non-steroidal anti-inflammatory
drugs in osteoarthritic patients: a prospective
study
ArticleCategory :
Research article
ArticleHistory :
Received: 14-Sept-2011; Accepted: 12-Jan-2012
ArticleCopyright
:
© 2012 Hmamouchi et al; licensee BioMed Central Ltd. This is an Open
Access article distributed under the terms of the Creative Commons
Attribution License ( which
permits unrestricted use, distribution, and reproduction in any medium,
provided the original work is properly cited.
Ihsane Hmamouchi,
Aff1 Aff2
Corresponding Affiliation: Aff2
Phone: +212-661-280297
Fax: +212-537-782653
Email:
Fadoua Allali,
Aff1 Aff2
Email:
Latifa Tahiri,
Aff1
Email:
Hamza Khazzani,
Aff1
Email:
Leila El Mansouri,
Aff1
Email:
Sanae Ali Ou Alla,
Aff1
Email:
Redouane Abouqal,
Aff2
Email:
Najia Hajjaj-Hassouni,
Aff1 Aff2
Email:
Aff1
Laboratory of Information and
Research on Bone Diseases (LIRPOS),
Faculty of Medicine and Pharmacy, Rabat, Morocco
Aff2
Laboratory of Biostatistical, Clinical and Epidemiological Research
(LBRCE), Faculty of Medicine and Pharmacy, Rabat, Morocco
Abstract
Background
The aims of the present study were first to detect MCID for WOMAC in a Moroccan population,
and second, to identify the best pre-treatment predictors on the change of health after treatment
by non-specific, non-steroidal anti-inflammatory drugs (NSAIDs), and to evaluate whether the
predictors were dependent on the choice of the response criterion.
Methods
The study involved 173 patients with osteoarthritis in whom primary care physicians decided to
start treatment with non-selective NSAIDs. Assessments at admission and after 6 weeks were
conducted. In order to determine the threshold levels associated with a definition of clinically
important improvement, the receiver operating characteristic method was used. Three different
measures of response to a 6-week NSAIDs treatment were used: one indirect measure (MCID in
the total WOMAC score), one direct measure (transition question) and a combination of both
criteria.
Results
Eighty patients (46.3%) reported “a slightly better” general health status compared to that of 6
weeks before NSAIDs treatment. The MCID proportion is a 16.0% reduction in WOMAC. The
most stable pre-treatment predictors on the improvement of health after treatment by NSAIDs
were the absence of previous knee injury and a high level of education.
Conclusions
In our data, a 16.0% reduction of the total WOMAC score from baseline was associated with the
highest degree of improvement on the transition scale category. This cut-off point had good
accuracy, and should be appropriate for use in the interpretation of clinical studies results, as
well as in clinical care.
Background
Osteoarthritis (OA) is one of the most common disabilities from which the elderly population
suffers, and is projected to be the fourth leading cause of disability worldwide by the year 2020
[1]. A disability may be characterized as the impaired performance of expected socially defined
life tasks, in a typical socio-cultural and physical environment [2,3].
A comprehensive assessment of the patient’s health status is gaining in importance, now that
health care is becoming increasingly evidence-based. As the growing number of the elderly in
industrial nations exerts additional pressure on the fiscal resources of health care systems,
medical action within strict guidelines is in greater demand [4-6]. One of the key issues for
evidence-based and cost-effective medicine is the detection and proof of the effects of a
particular intervention. In fact, the ability of an instrument to detect such a small difference is
essential in order to quantify the minimal difference that patients and their physicians consider
clinically important. The minimal clinically important difference (MCID) can be defined
generally as the smallest difference in score that patients perceive as beneficial and which would
then mandate, in the absence of troublesome side effects and excessive costs, a change in the
patient’s management [7]. In particular, when a therapy is ameliorative rather than curative,
clinicians need to know whether a small degree of symptom relief is important or trivial from the
patient’s perspective [8]. For the assessment of interventions in OA of the lower extremities, the
Western Ontario and McMaster Universities Osteoarthritis Index (WOMAC) is generally
recommended as the most sensitive, condition-specific instrument [9-14].
Symptomatic treatments of OA consist of non-pharmacological as well as pharmacological
interventions, including the use of non-steroidal anti-inflammatory drugs (NSAIDs). A major
goal of OA treatment is, therefore, pain management to optimize algo-functional features, and to
improve the patient’s quality of life. NSAIDs reduce inflammation, alleviate pain, and maintain
functional activity. Therefore, knowledge of predictors and the identification of patients for
whom the probability of treatment success is high at the time of assessment might facilitate the
optimization of individual programs. We are interested in identifying baseline risk factors to help
clinicians better identify which of their patients evaluated for the first time are likely to make
future improvements.
The minimal clinically important difference for WOMAC has not been studied in the Moroccan
population. Thus, the aims of the present study were first, to detect MCID for WOMAC in a
Moroccan population, and second, to identify the best pre-treatment predictors on the change of
health after treatment by non-specific, non-steroidal anti-inflammatory drugs (NSAIDs), and to
evaluate whether the predictors were dependent on the choice of the response criterion.
Methods
Study design
The ethics committee of Al Ayachi University Hospital approved the study protocol and all
patients gave informed written consent prior to their inclusion in the study. This is an ancillary
protocol to a prospective non-randomized study that involved 173 patients with OA in whom
primary care physicians decided to start treatment with non-selective NSAIDs. Data were
collected between January and May 2009 at Al Ayachi University Hospital. The study was
specifically designed with inclusion and exclusion criteria that would yield a study population
representative of community-based osteoarthritis patients. Eligible patients were aged 18 years or
older; had osteoarthritis of the knee (meeting American College of Rheumatology classification
criteria); had experienced at least moderate pain in the worst-affected knee (a score of 30 mm or
more on a visual analogy scale (VAS) as assessed by the patient) that was judged by the
investigator to require treatment with an anti-inflammatory agent to control arthritis symptoms;
and had a Functional Capacity Classification of ranging from I to III [15]. Patients were excluded
from the study if they had an active gastrointestinal disease, a history of gastric or duodenal
ulcer, gastrointestinal bleeding or ulcer perforation, cancer, serious hepatic or renal diseases or
any condition precluding NSAID therapy, previous exposure to investigational coxibs and
NSAIDs during the past 3 months, and concomitant use of corticosteroids, anticoagulants, or low
dose aspirin. Additional criteria for exclusion were intra-articular corticosteroid or intra-articular
hyaluronic acid joint injection within 8 weeks before randomization, a known allergy of
indomethacin or diclofenac and history of abuse use of alcohol or drug use within 1 year before
screening. Pregnant or breast-feeding women were also not eligible. Patients meeting entry
criteria received either indomethacin (25 mg) 150 mg daily or diclofenac (50 mg) 150 mg daily
for 6 weeks. A clinical evaluation was performed by the investigators at the screening visit, and
then again at 6 weeks.
Data collection and measurements
At baseline, we collected data related to socio demographic parameters such as age, the number
of pregnancies, the level of education, the existence of previous knee injuries and the duration of
disease. We asked patients if they have a back pain (Yes/No), currently smoking (Yes/No), and
comorbidity (binary): presence of at least 1 comorbid factor: ischemic heart disease,
hypertension, diabetes mellitus, renal disease (proteinuria or haematuria) or current cancer. The
body mass index (BMI) was calculated as body weight (kg)/height (m
2
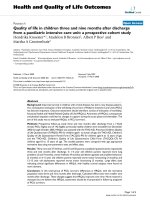
). Knee height was
measured on the right leg, using a sliding broad-blade caliper, with the subject in the seated
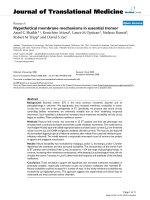
position (see Figure 1) [16].
Figure 1 Body position for the measurement of knee height (16). To measure knee height, the
knee was bent to a 90° angle, and the distance from the undersurface of the heel (the heel rested
on the caliper blade, and sandbags placed under the foot ensured that the foot remained level
with the heel) along the calf to the anterior surface of the thigh over the femoral condyles (just
proximal to the kneecap) was measured
Western ontario and McMaster universities OA index (WOMAC)
At baseline and after 6 weeks, patients were asked to complete the Western Ontario and
McMaster Universities OA Index (WOMAC). The WOMAC Osteoarthritis Index is a disease-
specific self-report questionnaire for measurement of the symptoms of OA of the hips and knees.
It is reliable, valid, and sensitive to the changes in the health status of patients with knee OA
[13]. We used the 3.1 Likert version with five response levels for each item, representing
different degrees of intensity (none, mild, moderate, severe, or extreme) that were scored from 0
to 4. The final score for the WOMAC was determined by adding the aggregate scores for pain,
stiffness, and function. Scores range from 0 to 96 for the total WOMAC where 0 represents the
best health status and 96 the worst possible status. The higher the score, the poorer the function.
Therefore, an improvement was achieved by reducing the overall score. The WOMAC has been
translated and validated in Arabic [17].
Transition scale
At the 6-week follow-up, patients had to compare their general health status with that of 6 weeks
earlier by the transition questionnaire [18,19]. As described by the authors, the question was
“Please imagine how you would have described your health status six weeks ago. How do you
feel in general today as compared to six weeks earlier as far as your osteoarthritis is concerned?.”
The possible replies were “much better,” “slightly better,” “no change,” “slightly worse,” or
“much worse”. This question was used as an anchor to establish the MCID for patients receiving
a NSAIDs treatment. We used the answer “slightly better” to establish the MCID for
improvement.
The EuroQol
At baseline, patients were asked to complete the Medical Euroqol-5D (EQ-5D). It is a self-report
questionnaire that has two sections: The first part (EQ-5D) consists of five questions covering
the dimensions of mobility, self-care, usual activities, pain/discomfort and anxiety/depression,
each with three levels of response. The responses to the five items of the EQ-5D can be scored
using a utility-weighted algorithm [20] to create a single index of quality of life ranging from
−0.59 to 1, which has been recommended for use in economic evaluation. The second part (EQ-
VAS) of the EuroQol consists of a 20 cm vertical visual analogue scale (VAS) ranging from 100
(best imaginable health state) to 0 (worst imaginable health state). The EuroQol has been
translated and validated in Arabic [21].
Radiography
Plain radiographs while standing on both legs and the knee extended were taken with a
horizontal X-ray beam, using a Fuji FCR capsula XL on a 20 × 25 cm Fuji ST-VI Computed
Radiography (CR) imaging plate (Fuji Medical Systems, Tokyo, Japan). Rotation of the foot was
adjusted to keep the second metatarsal bone parallel to the X-ray beam. Images were
downloaded into Digital Imaging and Communication in Medicine (DICOM) format files with a
spatial resolution of 1584 × 2016 pixels (giving a pixel size of 0.01 mm) and 1024 gray levels.
Radiographs were evaluated for the presence of OA defined by the Kellgren-Lawrence (KL)
scale depicted in the Atlas of Standard Radiographs of Arthritis (0 = normal, 1 = doubtful OA,
2 = minimal OA, 3 = moderate OA, and 4 = severe OA) [22]. This scale is based on the degree of
osteophyte formation, joint space narrowing, sclerosis, and joint deformity. The joint space width
(JSW) was measured on both the medial and lateral aspect of each knee radiograph with
electronic calipers. The minimum vertical distance of JSW was chosen for analysis. To avoid
inter-observer variability, the same examiner who was unaware of subject characteristics
performed all measurements.
Statistical methods
Calculation of the required sample size was based on the assumption that indomethacin would
reduce the incidence of upper abdominal pain from 40 to 25%, compared with diclofenac with a
two-sided test, an alpha level of 0.05, and a power of 80%. The statistical analysis was
performed in three steps. First, descriptive statistics were calculated for baseline characteristics.
There were expressed as mean (standard deviation) or medians (quartiles) for continuous
variables and as percentage distributions for discrete variables. Normality of the data was tested
with a one-sample Kolmogorov Smirnov test to indicate the appropriateness of parametric
testing. In the second step, the difference between the mean effects measured by WOMAC of the
“slightly better” group and the “no change” group was defined as the MCID of improvement.
This method has been proposed and applied in different settings [18,23-25]
In order to determine the threshold levels associated with our “a priori” definition of clinically
important improvement of WOMAC, the receiver operating characteristic (ROC) method, was
used. Transition scale was utilized as an external criterion to distinguish between improved and
non-improved patients. This method has the advantage of synthesizing information on the
sensitivity and specificity for detecting improvement by an external criterion [26,27]. The Area
Under the ROC curve (AUC) in this setting can be interpreted as the probability of correctly
identifying the improved patients from non-improved. The area ranges from 0.5 (no accuracy in
distinguishing improved from non-improved) to 1.0 (perfect accuracy) [26,27]. According to
Swets et al. [28], areas from 0.50 to about 0.70 represent poor accuracy, those from 0.70 and
0.90 are useful for some purposes, and higher values represent high accuracy. From the ROC
curves we compute the optimal cut-off point, corresponding with the maximum sum of
sensitivity and specificity. The mean effects measured by WOMAC of the “slightly better” group
and the “no change” group was defined as the MCID of improvement on the WOMAC global
score [6,7,9,10].
The total WOMAC score at the 6-week follow-up minus the score at baseline examination prior
to the treatment defined the effect measured by WOMAC. The transition scale assessed the self-
perceived change at the 6-week follow up compared to baseline. To determine MCID, the
WOMAC effects were related to the transition replies. From the ROC curves we computed the
optimal cut-off point, using Youden’s index. We estimated the MCID proportion (%), which is
the proportion of the sample with a change score exceeding the MCID.
In the last step, three logistic regression models using three definitions of the dependent variable
responder were developed. The first definition of response was the MCID improvement (%) on
the WOMAC global score. The second definition of responder used the transition scale. Patients
who reported a slightly or a much better health status on the transition scale were classified as
responders. The third definition of responder required that responders showed an MCID in
improvement on the WOMAC global score and reported a health improvement on the transition
scale. Comparisons in the change between three categories are carried out using analyses of
covariance (ANOVA) and we used Bonferroni adjustment for each two samples categories
(womac and transition scale), (womac and both transition scale and womac), (transition scale and
both transition scale and womac). Factors found to be significant to the P < 0.25 level in
univariate analysis because variables close to significance in univariate analysis can become
significant in multivariate analysis, and variables that were statistically significant predictors in
one of the other models, were included to the model and stayed in the model. To examine
whether disease severity is a predictor for response the WOMAC global baseline score was
included in the analysis with the dependent variable “responder on the transition scale”. It was
not included in the analysis with the dependent variable “MCID improvement (%) on the
WOMAC global score”, because this response definition was derived from the relative change
that adjusts for the expected high correlation between absolute change and initial scores.
Likewise, the WOMAC baseline score was not included in the analysis with the dependent
variable “MCID improvement (%) on the WOMAC global score and responder on the transition
scale”. Univariate chi-square tests were used to analyze the associations between response and
binary independent variables. Discrimination was assessed using the area under the receiver
operator characteristic curve (AUC) and calibration was assessed using the Hosmer-Lemeshow
goodness-of-fit test for each model using the definitions of responder. This article does not show
the results about thresholds
All statistical analyses were performed using SPSS 13.0 for Windows. A significant P value
of ≤ 0.05 was designated for all assessments.
Results
Socio-demographic and clinical characteristics of patients (Table 1)
Table 1 Characteristics of study participants
Number 173
Mean (SD) KS Z
Age (years) 57.1 (10.1) 0.874
Weight (kg) 76.2 (12.1) 0.875
Height (cm) 155.5 (5.4) 0.966
Body mass index (kg/m2) 31.1 (4.8) 0.770
Joint space width 3.2 (1.2) 0.910
EQ 5D index at baseline 0.2 (0.1) 0.984
EQ 5D after treatment 0.6 (0.3) 0.822
VAS EQ 5D at baseline 40 (18) 0.604
VAS EQ 5D after treatment 67 (18) 0.597
WOMAC at baseline 66 (20) 0.595
WOMAC after treatment 34 (17) 0.628
Median
(quartiles)
WOMAC raw change within transition
scale at endpoint
Much better 13 (12–22) 5.574*
Slightly better 28 (13–39) 3.765*
No change 17 (8–22) 5.318*
Slightly worse 1 (−8–11) 6.450*
Number of pregnancies 4(1–6) 1.366*
Duration of OA (month) 4 (2–10) 2.001*
N(%)
Female 125 (72.3) -
Existence of previous knee injuries 26 (15.1) -
Existence of back pain 58 (33.5) -
Co morbidities 101 (58.4) -
Smokers 12 (6.9) -
High level of education 61 (35.3) -
KS : Komorgorov Smirnov * P < 0.05
Normality of the continuous data was tested with the Komorgorov Smirnov test
A total of 221 patients were screened and 173 were included. The most common reason for non-
inclusion in the study was an inability to satisfy the clinical inclusion criteria (n = 43). Five
patients refused participation. All patients completed the 6-weeks treatment period. The baseline
characteristics for 173 patients are shown in Table 1. The mean (SD) age was 57.1 (10.1) years
and the mean (SD) BMI was 31 (4.8) kg/m2. The majority was female (72.3%). Of the 173
patients enrolled, 26 (15.1%) reported previous knee injury and 61 (31.7%) had no formal
education.
MCID improvement of total WOMAC score
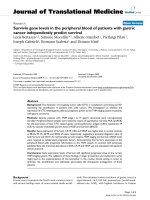
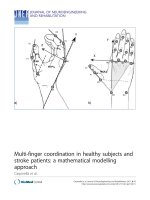
The mean changes in total WOMAC score (6-week follow-up versus baseline) stratified by the
transition scale, are illustrated by bar charts in Figure 2. More positive scores indicate greater
improvement for WOMAC. Eighty patients (46.3%) reported “a slightly better” general health
status with that of 6 weeks before NSAIDs treatment and 31 (17.9%) answer that they have
“much better” improvement in quality of life. The group of those who answered that they were
slightly worse was small (8.1%). The comparison of the change in total WOMAC score among
the different groups showed significant difference (one-way analysis of variance, P < 0.001;
bonferonni (difference between “slightly better” group and “equal, worse” group)). The MCID
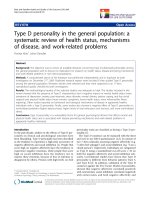
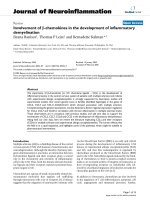
proportion is a 16.0% reduction in WOMAC. A raw change of −15.5 (AUC 0.881 ±0.011) and
percent change of −16% (AUC 0.889 ±0.008) genarated from the ROC analyses were optimal
cut-off point associated with our definition of MCID, namely the transition category of “slightly
better”. The sensitivity and specificity of the cut-off point were 75% and 68%, respectively
(Figure 3).
Figure 2 Box plot of the WOMAC raw change (6-week follow up vs. baseline) within transition
scale at endpoint. Central line, median; boxes, 25th to 75th percentiles; whiskers, 95%
confidence intervals
Figure 3 ROC curve of the WOMAC total score. A percent change of −16% generated from the
ROC analyses were optimal cut-off point associated with our definition of MCID, namely the
transition category of “slightly better”. The sensitivity and specificity of the cut-off point were
75% and 68% respectively
Responder definition
Univariate analysis
At baseline, a joint space width > 3.5 mm, a BMI > 31 kg/m
2
, knee height > 49 cm, existence of
previous knee injuries, a high level of education and a number of pregnancies >4 were associated
with higher improvement in WOMAC after 6 weeks.
Patients with the lowest level of the total WOMAC score at baseline and the lowest KL Grade
had the greatest improvement in transition scale.
Patients with the lowest level of quality of life at baseline (EQ-5D index and VAS) had the
greatest improvement in WOMAC and in the transition scale (Table 2).
Table 2 Predictors of response to NSAIDs on the univariate level with three different definitions
of responder
Independent variable 16% improvement
in the WOMAC
Transition Both criteria
OR IC 95% OR IC 95% OR IC 95%
Total WOMAC score at baseline - 0.43* 0.22–0.82 -
Age > 57 (years) 1.20 0.66–2.16 0.41 0.21–0.77 1.14 0.61–2.13
BMI > 31 (kg/m2) 1.79* 1.02–3.28 0.81 0.43–1.49 1.18 0.63–2.18
Joint space width > 3.5 mm 0.48* 0.23–0.98 1.59+ 0.76–3.21 0.61+ 0.28–1.30
Knee height > 49 cm 2.46* 1.18–5.13 0.75 0.36–1.51 1.05 0.49–2.25
KL Grade > 2 1.34 0.71–2.54 0.47* 0.23–0.97 1.26 0.68–2.45
Duration of OA > 4 (month) 1.14 0.51–2.56 0.75 0.39–1.72 1.38 0.59–3.21
Previous knee injuries 5.27* 1.83–15.38 2.25+ 0.86–5.85 3.92* 1.59–9.67
Co morbidities 0.71 0.38–1–28 0.67+ 0.35–1.21 0.60+ 0.32–1.13
Existence of back pain 1.77 0.15–19.9 18.2 0.51–24.5 3.39 0.31–38.2
High level of education 2.19* 1.15–4.19 0.63 0.33–1.21 1.72+ 0.91–3.25
Number of pregnancies > 4 2.48* 1.06–5.73 0.51+ 0.21–1.21 1.92+ 0.81–4.51
EQ index at baseline > 0.36 0.5+ 0.24–1 1.47 0.73–3.07 0.58+ 0.27–1.26
VAS EQ 5D at baseline > 40 0.21* 0.09–0.41 1.56+ 0.73–3.32 0.29* 0.12–0.71
+P < 0.25 * P < 0.05
Continuous variables were dichotomized by median as cut-off
Univariate analysis for the association between “Total WOMAC score at baseline” and the
response definitions “16% improvement in the WOMAC” and “both criteria,” respectively, are
not represented because these response definitions adjust for the expected high correlation of
WOMAC baseline score and the change of the WOMAC
Multivariate analysis
1. Responder definition “16% (MCID) improvement in the WOMAC.” Statistically significant
predictors for a better outcome were high level of education (no formal education/higher than no
formal education) (OR = 3.77; IC: 1.12–12.7) and absence of previous knee injury (OR = 4.55;
IC: 1.46–14.8)
2. Responder definition “improvement on the transition scale” (data not shown). In this category
no factor was a statistically significant predictor for improvement
3. Responder definition “16% improvement in the WOMAC and improvement on the transition
scale.” Statistically significant predictors for a better outcome were absence of previous knee
injury (OR = 10.27; IC: 2.08–50.6), low knee height (OR = 3.34; IC: 1.05–10.5) and high level of
education (OR = 3.7; IC: 1.01–13.41)
Comparison of prediction models with different responder definitions
The model with the responder definition that required responders to have “a 16% improvement
in the WOMAC and improvement on the transition scale” had the highest value for the
discrimination (AUC = 0.84). This model had also the best calibration of fit (PHL = 0.53) (Table
3). The model with the restrictive responder definition that required responders to have an
improvement on the transitions scale had the lowest value for the discrimination and calibration
(AUC = 0.68, PHM = 0.25) data not shown.
Table 3 Comparison of predictors for OA treatment by NSAIDS with different definitions of
responder
N (%) AUC P (HL) Predictors OR 95% CI P R2
High level of education 3.77 1.12–12.7 0.03 0.34
16%
improvement*
92
(53.2)
0.77 0.51
No Previous knee injury 4.55 1.46–14.8 0.001
No Previous knee injury 10.27 2.08–50.6 0.004 0.47
Knee height 3.34 1.05–10.5 0.040
Both criteria+
65
(37.6)
0.84 0.53
High level of education 3.7 1.01–13.41 0.047
*Patients with an MCID on the total WOMAC score (16% change)
+Patients who answered “slightly better” or “much better” to the health transition question and
have an MCID on the total WOMAC score (16% change)
After adjusting of Age > 57 (years), Body mass index > 31 (kg/m2), Knee height > 49 cm; Joint
space width > 3.5 mm; Existence of previous knee injuries; Co morbidities; high level of
education (no formal education vs. higher than no formal education); Number of pregnancies > 4;
EQ 5D index at baseline > 0.36; VAS EQ 5D at baseline > 40
Discussion
In our study, a 16.0% reduction of the total WOMAC score from baseline was associated with
the “slightly better” degree of improvement on the transition scale category, and this cut-off
point had good accuracy.
The concept of the minimal clinically important difference (MCID) has been proposed to refer to
the smallest difference in a score that is considered to be meaningful or clinically important. In
our study, the receiver operating characteristic (ROC) method was used. This method has the
advantage of synthesizing information on the sensitivity and specificity for detecting
improvement by an external criterion.
In fact, the greatest difficulty in assessing the threshold of symptomatic clinical importance is
identifying an appropriate reference standard [7] have asked individuals to introspect on life
experiences and directly calibrate health status measures. Redelmeier et al. [8] took the patients’
perspective and asked patients to evaluate their health relative to others. In this study, we have
assessed thresholds by correlating scores on a health status index to an external question:
“transition scale.”
Several studies have shown that patients tended to rate themselves as less disabled than each
other [7,8]. In our study, we found that the threshold of symptomatic difference was smaller if
patients were less disabled. This optimistic bias in subjective comparison ratings resembles
several other cognitive phenomena. People can adapt to their disabilities and become reluctant to
exchange their current problems for an alternative situation [8,29]. Together, these cognitive
phenomena highlight pitfalls of assessing a patient’s quality of life, both in research as well as in
the doctor-patient relationship.
In our study, we estimated the MCID proportion (%) whitch is the proportion of the sample with
change scores exceeding the MCID by the ROC analysis. In our study, we found the same result
of MCID using ROC curve by correlating WOMAC scores to an external question: “transition
scale” that when calculating the difference between the before-after treatment of the WOMAC
total score (28 (change score of the slightly better group)—17 (change score of the unchanged
group) = 11 score points. 11/66 (66 = baseline WOMAC score) = 16.7%). This is a coincidence
that we cannot explain.
The magnitude of the improvement seen in WOMAC in our study after 6 weeks (16%) reflects a
slightly poorer condition than the one reported following a similar methodology. Indeed,
previous studies have shown an 18.0% reduction in WOMAC as the percentage of patients with
a MCID [30,31]. In our study, X-ray examinations were performed at baseline, and showed that
67.7% of patients presented higher than KL grade 3. Furthermore, owing to the fact that above
30 mm on the VAS of pain was an inclusion criterion of the study, the severity of OA in our
cohort could be considered as moderate to severe.
The best response definition in this study was a combination of the transition question and
percentage change in WOMAC total score. This model had a better ability to discriminate
between responders and non-responders than the other two models. In fact, to ask the patient
about a health transition is simple and intuitive, and patients with a very good or a very bad
health status can deteriorate or improve, respectively. But a single transition question cannot be
considered as a stable measure. Taking into account the high mean age of our samples and their
low level of education, this option would have made answering the questionnaire far more
complicated. Further studies has shown that the MCID proportion is a reliable and valid measure,
and may be more stable than a single transition question because of absence of optimistic bias
[18,19]. Therefore, patients with baseline scores far above the average (bad health) show higher
improvements in the change score compared to patients with a good health status [18,31]. This is
a well-known phenomenon: a sick patient has higher potential to improve and the regression-to-
the-mean effect. The more the patient’s condition is serious, the more the improvement will be
important because the difference between the before-after treatment will be considerable.
In our report, the most stable pre-treatment predictors on the improvement of health after
treatment by NSAIDs in Moroccan osteoarthritis patients were the absence of previous knee
injury and a high level of education, because they were confirmed across two logistic regression
models with different definitions of response as the dependent variable.
A better outcome for highly educated patients was found in studies that evaluated the outcome of
joint arthroplasty [31,32]. On the other hand, joint injury is a well-known risk factor for knee OA
and is associated with increased severity of osteoarthritis [33-36]. This is in line with our results.
However, given that high level of education and previous knee injury are historic events, this
raises the issue as to whether these are modifiable factors. Since this is obviously not the case, it
seems interesting to emphasize the therapeutic patient education especially in patients with low
level of education.
The finding that presence of previous knee injuries is associated with higher improvement in
WOMAC total in the univariate analysis but absence of previous knee injuries is associated with
higher improvement in WOMAC total in the multivariate analysis may be confusing. It is
probably due to the existence of confounding factors. When a variable is related to another
variable of the model, it may be obscured in univariate analysis (not significant) and prove to be
in multivariate analysis. In our models, it may be the case of “previous knee injury” and “joint
pace width.”
Our study has some limitations. The patients in the study were subjects for whom primary care
physicians identified the need to start treatment with NSAIDs. This fact suggests strongly that
these patients were symptomatic at the time of the quality of life assessment. Because OA may
be characterized by phases of flares and respite, the results we observed might be slightly
overestimated compared with the whole population of patients with OA. A possible limitation
was that we employed one transitional question, not one for each domain, as it has been
suggested [37]. This would have increased the length of the questionnaire and increased the rate
of missing patients or items. Another question that could be asked about our results is the
absence of a direct comparison with a control group. However, a large set of complete data on
socio-demographic variables was entered into the regression models, and in addition, clinical
measurements were taken.
Conclusions
In our data, a 16.0% reduction of the total WOMAC score from baseline was associated with
slightly better improvement on the transition scale. This cut-off point had good accuracy, and
should be appropriate for use in the interpretation of clinical studies results, as well as in clinical
care. The observation that patients with a high level of education and an absence of previous
knee injury are the best responders to NSAIDs in Moroccan osteoarthritis may be interesting to
adopt and individualize the treatment of patients who are, at present, less likely to respond and to
emphasize the therapeutic patient education especially in patients with a low level of education.
Abbreviations
NSAIDs, Non-steroidal anti-inflammatory drugs; OA, Osteoarthritis; MCID, Minimal clinically
important difference; WOMAC, Western Ontario and McMaster Universities Osteoarthritis
Index; VAS, Visual analogy scale; BMI, Body mass index; EQ-5D, Medical Euroqol-5D; KL,
Kellgren-Lawrence; JSW, Joint space width; KS, Kolmogorov-Smirnov; AUC, Area Under the
ROC curve; H-L, Hosmer-Lemeshow
Authors’ contributions
All authors participated at the study as following: FA, NHH conceived the study and supervised
its design, execution, and analysis and participated in the drafting and critical review of the
manuscript. IH, FA and RA did data management and statistical analyses. All other authors’
enrolled patients, participated in data acquisition and critical revision of the manuscript. IH wrote
the paper with input from all investigators. All authors declare that we have seen and approved
the final version of manuscript.
Competing interests
The authors have declared no conflict of interest.
Acknowledgements
This study has been supported by the Universite Mohammed V Souissi, Rabat, Morocco.
References
1. Reginster J-Y: The prevalence and burden of arthritis. Rheumatology 2002, 41:3–6.
2. Sharma L, Cahue S, Song J, Hayes K, Pai YC, Dunlop D: Physical functioning over three
years in knee osteoarthritis: role of psychosocial, local, mechanical, and neuromuscular
factors. Arthritis Rheum 2003, 48:3359–3370.
3. Jette AM, Haley SM, Coster WJ, Kooyoomjian JT, Levenson S, Heeren T, et al: Late life
function and disability instrument (FDI). J Gerontol A Biol Sci Med Sci 2002, 57:209–216.
4. Murray CJL, Lopez DL: Global mortality, disability, and the contribution of risk factors:
global burden of disease study. Lancet 1997, 349:1436–1442.
5. Woolf AD, Pfleger B: Burden of major musculoskeletal conditions. Bull WHO 2003,
81:646–656.
6. Angst F, Aeschlimann A, Stucki G: Smallest detectable and minimal clinically important
differences of rehabilitation intervention with their implications for required sample sizes
using WOMAC and SF-36 quality of life measurement instruments in patients with
osteoarthritis of the lower extremities. Arthritis Rheum 2001, 45:384–391.
7. Jaeschke R, Singer J, Guyatt GH: Measurement of health status. Ascertaining the minimal
clinically important difference. Control Clin Trials 1989, 10:407–415.
8. Redelmeier DA, Lorig K: Assessing the clinical importance of symptomatic
improvements. An illustration in rheumatology. Arch Intern Med 1993, 153:1337–1342.
9. Alzahrani K, Gandhi R, Debeer J, Petruccelli D, Mahomed N: Prevalence of clinically
significant improvement following total knee replacement. J Rheumatol 2011, 38:753–759.
10. Escobar A, Quintana JM, Bilbao A, Aróstegui I, Lafuente I, Vidaurreta I: Responsiveness
and clinically important differences for the WOMAC and SF-36 after total knee
replacement. Osteoarthr Cartil 2007, 15:273–280.
11. Bellamy N: WOMAC Osteoarthritis Index. A user’s guide. London: University of Western
Ontario; 1995.
12. Ehrich EW, Davies GM, Watson DJ, Bolognese JA, Seidenberg BC, Bellamy N: Minimal
perceptible clinical improvement with the Western Ontario and McMaster Universities
osteoarthritis index questionnaire and global assessments in patients with osteoarthritis. J
Rheumatol 2000, 27:2635–2641.
13. Bellamy N, Buchanan WW, Goldsmith CH, Campbell J, Stitt LW: Validation study of
WOMAC: a health status instrument for measuring clinically important patient relevant
outcomes to antirheumatic drug therapy in patients with osteoarthritis of the hip or knee. J
Rheumatol 1988, 15:1833–1840.
14. Bellamy N, Kean WF, Buchanan WW, Gerecz-Simon E, Campbell J: Double blind
randomized controlled trial of sodium meclofenamate (Meclomen) and diclofenac sodium
(Voltaren): post validation reapplication of the WOMAC osteoarthritis index. J Rheumatol
1992, 19:153–159.
15. Steinbrocker O, Traeger C, Batterman R: Therapeutic criteria in rheumatoid arthritis.
JAMA 1949, 140:659–662.
16. Chumlea WC: Accuracy and reliability of a new sliding caliper. Am J Phys Anthropol
1985, 68:425–427.
17. Faik A, Benbouazza K, Amine B, Maaroufi H, Bahiri R, Lazrak N, Aboukal R, Hajjaj-
Hassouni N: Translation and validation of Moroccan Western Ontario and McMaster
Universities (WOMAC) osteoarthritis index in knee osteoarthritis. Rheumatol Int 2008,
28:677–683.
18. Angst F, Aeschlimann A, Michel BA, Stucki G: Minimal clinically important
rehabilitation effects in patients with osteoarthritis of the lower extremities. J Rheumatol
2002, 29:131–138.
19. Weigl M, Angst F, Aeschlimann A, Lehmann S, Stucki G: Predictors for response to
rehabilitation in patients with hip or knee osteoarthritis: a comparison of logistic
regression models with three different definitions of responder. Osteoarthr Cartil 2006,
14:641–651.
20. Fransen M, Edmond J: Reliability and validity of the EuroQol in patients with
osteoarthritis of the knee. Rheumatology 1999, 38:807–813.
21. Aburuz S, Bulatova N, Twalbeh M, Gazawi M: The validity and reliability of the Arabic
version of the EQ-5D: a study from Jordan. Ann Saudi Med 2009, 29:304–308.
22. Dacre JE, Huskisson EC: The automatic assessment of knee radiographs in
osteoarthritis using digital image analysis. Br J Rheumatol 1989, 28:506–510.
23. Stucki G, Daltroy L, Liang MH, Lipson SJ, Fossel AH, Katz JN: Measurement properties
of a self-administered outcome measure in lumbar spinal stenosis. Spine 1996, 21:796–803.
24. Corzillius M, Fortin P, Stucki G: Responsiveness and sensitivity to change of SLE disease
activity measures. Lupus 1999, 8:655–659.
25. Deyo RA, Diehr P, Patrick DL: Reproducibility and responsiveness of health status
measures. Statistics and strategies for evaluation. Control Clin Trials 1991, 12:142S–158S.
26. Liang MH: Evaluating measurement reponsiveness. J Rheumatol 1995, 22:1191–1192.
27. Hanley JA, McNeil BJ: A method of comparing the areas under receiver operating
characteristic derived from the same cases. Radiology 1983, 148:839–843.
28. Swets JA: Measuring the accuracy of diagnostic systems. Science 1988, 240:1285–1293.
29. Weinstein ND: Optimistic biases about personal risk. Science 1989, 246:1232–1233.
30. Pham T, Maillefert JF, Hudry C, Kieffert P, Bourgeois P, Lechevalier D, Dougados M:
Laterally elevated wedged insoles in the treatment of medial knee osteoarthritis. A two-
year prospective randomized controlled study. Osteoarthr Cartil 2004, 12:46–55.
31. Fortin PR, Clarke AE, Joseph L, Liang MH, Tanzer M, Ferland D, et al: Outcomes of total
hip and knee replacement. Arthritis Rheum 1999, 42:1722–1728.
32. Mahomed NN, Liang MH, Cook EF, Daltroy LH, Fortin PR, Fossel AH, et al: The
importance of patient expectations in predicting functional outcomes after total joint
arthroplasty. J Rheumatol 2002, 29:1273–1279.
33. Davis MA, Ettinger WH, Neuhaus JM, Cho SA, Hauck WW: The association of knee
injury and obesity with unilateral and bilateral osteoarthritis of the knee. Am J Epidemiol
1989, 130:278–288.
34. Cooper C, Snow S, McAlindon TE, Kellingray S, Stuart B, Coggon D, et al: Risk factors
for the incidence and progression of radiographic knee osteoarthritis. Arthritis Rheum 2000,
43:995–1000.
35. Yoshimura N, Nishioka S, Kinoshita H, Hori N, Nishioka T, Ryujin M, et al: Risk factors
for knee osteoarthritis in Japanese women: Heavy weight, previous joint injuries, and
occupational activities. J Rheumatol 2004, 31:157–162.
36. Lau EC, Cooper C, Lam D, Chan VNH, Tsang KK, Sham A: Factors associated with
osteoarthritis of the hip and knee in Hong Kong Chinese: Obesity, joint injury, and
occupational activities. Am J Epidemiol 2000, 152:855–862.
37. Tubach F, Ravaud P, Baron G, Falissard B, Logeart I, Bellamy N, et al: Evaluation of
clinically relevant changes in patient reported outcomes in knee and hip osteoarthritis: the
minimal clinically important improvement. Ann Rheum Dis 2005, 64:29–33.
Figure 1 - Body position for the measurement of knee height (16)
To measure knee height, the knee was bent to a 90° angle, and the distance from the
undersurface of the heel (the heel rested on the caliper blade, and sandbags placed under the
foot ensured that the foot remained level with the heel) along the calf to the anterior surface of
the thigh over the femoral condyles (just proximal to the kneecap) was measured.
Figure 1
14488031N =
Transition scale
Slightly worse
No change
Slightly better
Much better
Raw change score
80
60
40
20
0
-20
-40
Figure 2 - Box plot of the WOMAC raw change (6-week follow up vs. baseline) within
transition scale at endpoint.
Central line, median; boxes, 25th to 75th percentiles; whiskers, 95% confidence intervals
Figure 3 – ROC curve of the WOMAC total score
A percent change of -16% generated from the ROC analyses were optimal cut-off
point associated with our definition of MCID, namely the transition category of
‘‘slightly better ». The sensitivity and specificity of the cut-off point were 75% and
68% respectively.
Figure 3