Báo cáo hóa học: " Research Article Nonlinear Analysis of the BOLD Signal" ppt
Bạn đang xem bản rút gọn của tài liệu. Xem và tải ngay bản đầy đủ của tài liệu tại đây (2.03 MB, 13 trang )
Hindawi Publishing Corporation
EURASIP Journal on Advances in Signal Processing
Volume 2009, Article ID 215409, 13 pages
doi:10.1155/2009/215409
Research Article
Nonlinear Analysis of the BOLD Sig nal
Zhenghui Hu,
1, 2
Xiaohu Zhao,
3
Huafeng Liu,
1
and Pengcheng Shi
2, 4
1
Department of Optical Eng ineering, State Key Laboratory of Modern Optical Instrumentation,
Zhejiang University, Hangzhou 310027, China
2
B. Thomas Golisano College of Computing and Information Sciences, Rochester Institute of Technology, Rochester, NY 14623, USA
3
Department of Radiology, Tongji Hospital of Tongji University, Shanghai 200065, China
4
University of Rochester Medical Center, Rochester, NY 14642, USA
Correspondence should be addressed to Pengcheng Shi,
Received 1 January 2009; Accepted 20 April 2009
Recommended by Don Johnson
The linearized filtering approach to the hemodynamic system is limited in capturing the inherent nonlinearities of physiological
systems. The nonlinear estimation method therefore should be thought of as a natural way to access the nonlinear data assimilation
problem. In this paper, we present a nonlinear filtering algorithm which is computationally expensive compared to the existing
linearization filtering algorithms, for hemodynamic data assimilation, to address the deficiencies inherent to linearization.
Simultaneous estimation of the physiological states and the system parameters have been demonstrated in a simulated and real
data. The method provides more reasonable inference about the parameters of models for hemodynamic data assimilation.
Copyright © 2009 Zhenghui Hu et al. This is an open access article distributed under the Creative Commons Attribution License,
which permits unrestricted use, distribution, and reproduction in any medium, provided the original work is properly cited.
1. Introduction
The primary goal of the fMRI study is to detect the under-
lying neural nature from the hemodynamics-induced signal
intensity changes. The fMRI data analysis therefore aims to
extract relevant spatio-temporal physiological information
of the activation sites and the relationship between them.
However, it is unfortunate that the hemodynamic signal
is indirectly related to the neural activity, as it depends
on a complex combination of changes in some physiolog-
ical states, including cerebral blood flow (CBF), cerebral
blood volume (CBV), and cerebral oxygen consumption
rate (CMRO
2
). Generally, the relationship between neural
activity and the measurements of the BOLD signal may be
modeled by the so-called hemodynamic responses function.
This function describes the characteristic hemodynamic
response to a brief neural event and thus characterizes
the input-output behavior of a given voxel. An fMRI
dataset typically consists of a series of time series associated
with these intracerebral voxels. Then, for each voxel, the
significance of the response to the stimulus is assessed by
statistically analyzing the related fMRI time series based
on the hemodynamic responses function; finally, a brain
activation map can be constructed. Therefore, the knowledge
of the hemodynamic responses function is essential for fMRI
data analysis. Some of the better known functions include the
Poisson function [1], the Gaussian function [2], the Gamma
function [3, 4], inverse Logit function [5], and the linear
combination of several functions [6, 7]. These functions are
nothing more than empirical description of the phenomena,
thus are exempt from the underlying phyiological bases
of hemodynamic modulation. Those approaches based on
these functions are also blind to the mechanisms that
underlie physiological changes. For these reasons, most of
current approach to fMRI analysis had been used primarily
for activation detection, rather than for the exploration
of the underlying physiology based on a detailed analysis
of the BOLD response. However, it is important to have
a quantitative understanding of those physiologic factors,
such as changes in flow, oxygen extraction, blood volumes,
and their combined effects, that are more directly related
to the neural activity. These physiologically meaningful
evaluations are needed to clarify the relationship between
neural activation and experimental paradigm, and the
significance of the observed transients in the BOLD signal
[8].
2 EURASIP Journal on Advances in Signal Processing
Against this background, the Buxton-Friston (B-F) he-
modynamic model has been developed as a comprehensive
biophysical model of hemodynamic modulation. It combines
the coupling mechanism of manifold physiological variables
and has successfully simulated pronounced transients in
the BOLD signal, including initial dips, overshoots, and a
prolonged poststimulus undershoot. This model provides
a possible platform to understand the dynamic changes of
physiological variables during brain activation [9]. There
have been many attempts at combining observational data
with such a model in order to produce a reasonable
inference about the physiological parameters and states of the
system. Some modeled based optimisation approaches for
estimating parameters from measured data were presented
in [10–12]. A limitation of the above approaches is that
they deal only with the measurement noise. Subsequently
Riera et al. proposed a local linearization filter strategy
that also considers physiological noise [13]. However, the
hemodynamic response function typically possesses strong
nonlinear characteristics that vary with the duration of
hemodynamic modulation, making it questionable that such
a linearized method addresses a strong nonlinear problem.
The linearized Kalman filter approximation can lead to
erroneous behavior of the linearized transform (Jacobian
matrix) which substitutes nonlinear transformation at a
given time. Thus, the linearized approximation method is
only reliable when the time scale is discretized sufficiently
small so that system is almost linear on the time scale,
the error propagation can be well approximated by a linear
function. Once the discretization violates this restriction,
it can result in nonstable estimates. However, determin-
ing the validity of this assumption is extremely difficult
because it depends on the transformation function, the
current state, and the magnitude of the covariance. In
addition, it is well known in the control community that
the linearized filter approach is difficult to implement. It
asks for a proper noise injection, which can overwhelm
the inconsistent estimation error induced by the linearized
transform, to produce positive definite covariance matrix.
So, a nonlinear estimation algorithm should be considered as
a natural choice for hemodynamic data assimilation studies.
On the other hand, the nonlinear particle filter solution
to the problem introduces some other difficulties while
avoiding the deficiencies of linearization [14, 15]. In addition
to computational expense, the accuracy of particle filter
estimates degrades rapidly as sample point cloud is suc-
cessively transformed [16]. While these filtering approaches
above employed a Bayesian strategy, most recently, Friston
et al. introduced two incremental estimation schemes,
dynamic expectation maximisation (DEM) [17]andvaria-
tional filtering [18], that address the assimilation problem
as well.
In this paper, we describe a way of assimilating the
fMRI time series that allow making inference about the
underlying physiological states and the biophysical param-
eters generating observed fMRI signals. This corresponds
to a nonlinear deconvolution of observed data using a
hemodynamic state-space model based on stochastic dif-
ferential equations. It allows one to deconvolve data, given
known experimental inputs or perturbations. Our model
can be regarded as a stochastic Dynamic Causal Model for
a signal brain region, which allows for noise or random
fluctuations on the underlying or hidden physiological
states. Our deconvolution scheme uses an unscented Kalman
filter and, computationally, is equivalent to the complexity
of linear deconvolution schemes. In addition to inferring
the hidden states, we also provide for inference on the
parameters. This involves augmenting the state vector with
the parameters and treating them as slowly varying states
(as in variable parameter regression and related approaches).
This scheme then is demonstrated on a simulated dataset
and a real texture perception fMRI experiment. This paper
is organized as follows. In the first section we introduce
the heamodynamic model and motivate it to the state
space formulation which forms the basis of hemodynamic
data assimilation. Some physics notes on the model are
presented in Section 3.InSection 4 we explain the details of
the nonlinear filter implementation. Section 5 presents the
results of a synthetic and a real data assimilation with the new
method. Summary and conclusion are given in Section 6.
Notation 1. Throughout the paper, a continuous time dif-
ferential equation and its discrete equation are denoted by
lowercase (e.g., h) and corresponding uppercase (e.g., H)
symbols, respectively. Notations such as β denote a vector or
parameter set, while β
i
means some entry of the vector.
2. Hemodynamics Model
The Buxton-Friston hemodynamic model describes the
couples dynamics from synaptic activity to fMRI signals [10].
The process of equations describe the dynamics evolutions
of the basic physiological state, including the cerebral
blood flow f , the cerebral blood volume v, and the veins
deoxyhemogolobin content q with the external input u(t). It
consists of three linked subsystems: (1) neural activity u(t)to
changes in flow f ;(2)changesinflow f to changes in blood
volume v;(3)changesinf , v, and oxygen extraction fraction
to changes in deoxyhemoglobin q:
¨
f
= u
(
t
)
−
˙
f
τ
s
−
f −1
τ
f
,
˙
v
=
1
τ
0
f −v
1/α
,
˙
q
=
1
τ
0
f
1
−
(
1
−E
0
)
1/f
E
0
−v
1/α
q
v
,
(1)
where u(t) is the neuronal inputs;
is neuronal efficacy; τ
s
reflects signal decay; τ
f
is the feedback autoregulation time
constant; τ
0
is the transit time; α is the stiffness parameter; E
0
represent the resting oxygen extraction fraction. Their typical
values and probability distributions are given in Tabl e 1 [11].
All state variables are expressed in normalized form, relative
to resting values. Equation (1) has a second-order time
derivative, and we can write this system as a set of four first-
order ODEs by introducing a new variable s
=
˙
f .
EURASIP Journal on Advances in Signal Processing 3
Activity u(t)
Signal s
Flow f
Vo lu m e v
dHb
q
BOLD signal y
f (1
−(1 −E
0
)
1/f
)
τ
0
E
0
s
τ
s
f −1
τ
f
us
f
τ
0
1
τ
0
v
1/α
q
v
v
1/α
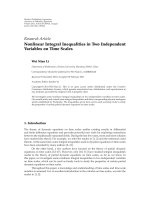
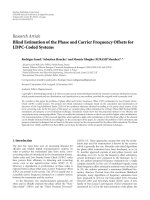
Figure 1: Schematic illustration of the hemodynamic model.
Table 1: Balloon model parameters and their probability distribu-
tion. N(μ, σ
2
) denotes the normal distribution with mean μ and
variance σ
2
.
Notation Definition Distribution
Neuronal efficacy
∼
N(0.54, 0.1
2
)
τ
s
Signal decay τ
s
∼ N(1.54, 0.25
2
)
τ
f
Autoregulation τ
f
∼ N(2.46, 0.25
2
)
τ
0
Transit time τ
0
∼ N(0.98, 0.25
2
)
α Stiffness parameter α
∼ N(0.33, 0.045
2
)
E
0
Resting oxygen extraction E
0
∼ N(0.34, 0.1
2
)
Furthermore, the output BOLD signal at the same voxel
can be expressed as
y
(
t
)
= V
0
k
1
1 − q
+ k
2
1 −
q
v
+ k
3
(
1
−v
)
,
k
1
= 7E
0
, k
2
= 2, k
3
= 2E
0
−0.2,
(2)
appropriate for a 1.5 Tesla magnet [9]. V
0
is the resting blood
volume fraction, where we imposed a physiological plausible
value V
0
= 0.03 in the data assimilation process, as described
in previous studies [10, 12]. The model architecture is
summarised in Figure 1.
The stiffness parameter α shows a marginal influence
to the system output variance in sensitivity analysis [19].
Therefore, it can be fixed within its physiological reasonable
range (α
= 0.33, here) in system identification. There have
been several enhancements of the original Balloon Model as
well [20–22]. Such models have many degrees of freedom and
can produce more desired behavior. For example, Zheng’s
model consists of 7 states and 13 parameters, twenty variates
in all [20]. However, from a sensitivity analysis perspective,
the original model is sufficient for sparse, noisy fMRI data
assimilation [23].
Statistical models commonly can be explained as the
fixed effects, which capture the underlying pattern, plus the
error term. Thus, we rewrite (1), (2)as
˙
x
= f
x, β, u, v
, v ∼ N
(
0, R
v
)
,
(3)
y
= h
x, β, w
, w ∼ N
(
0, R
w
)
,(4)
where f and h are nonlinear equations, x(t)
= [s, f , v, q]
T
is the state of the system, β ={, τ
s
, τ
f
, τ
0
, E
0
} is system
parameters, the neuronal inputs u represent system input,
v is the noise process caused by disturbances and modeling
errors, y is the observation vector, and w is measurement
noise.
Equations (3)and(4) constitute a state-space represen-
tation of fMRI BOLD responses to given stimulation, and
the goal of the data assimilation is then to estimate a set of
hidden state variables x and parameter variables β based on
the observation vector y.
3. Dynamics in State Space
A state space (x(t) = [s, f , v, q]
T
)andarule(1) for following
the evolution of trajectories starting at various initial condi-
tions constitute a dynamical system. It is interesting to build
some intuitive understanding for its dynamics.
The fixed point of the system evolution can be found, by
setting the four time derivatives equal 0,
˙
x
|
x=x
0
= f
(
x
0
)
= 0. (5)
Thus, we have an equilibrium state:
x
0
=
⎛
⎜
⎜
⎜
⎜
⎜
⎜
⎜
⎜
⎜
⎝
0
τ
f
u
0
+1
τ
f
u
0
+1
α
1 −
(
1
−E
0
)
1/(τ
f
u
0
+1)
E
0
τ
f
u
0
+1
α
⎞
⎟
⎟
⎟
⎟
⎟
⎟
⎟
⎟
⎟
⎠
. (6)
4 EURASIP Journal on Advances in Signal Processing
In particular, for the null input u
0
= 0, ∃! x
0
∈ X :
x
0
= [0,1,1,1]
T
. This value will be used as the initial
value in subsequent system identification to accelerate the
convergence of the algorithm.
The nature of the fixed point is determined by the char-
acteristic values of the Jacobian matrix of partial derivatives
evaluated at the fixed point. The Jacobian matrix for the set
of equation is defined as
J =
⎛
⎜
⎜
⎜
⎜
⎜
⎜
⎜
⎜
⎜
⎜
⎜
⎝
−
1
τ
s
−
1
τ
f
00
10 00
0
1
τ
0
−
v
1/α−1
ατ
0
0
0
1
τ
0
1 −
(
1
−E
0
)
1/f
E
0
−
(
1
−E
0
)
1/f
ln
(
1 − E
0
)
E
0
f
q
τ
0
1 −
1
α
v
1/α−2
−
v
1/α−1
τ
0
⎞
⎟
⎟
⎟
⎟
⎟
⎟
⎟
⎟
⎟
⎟
⎟
⎠
. (7)
Its eigenvalues evaluated λ at the fixed point x
0
are
⎧
⎪
⎨
⎪
⎩
−
1/τ
s
+
1/τ
2
s
−4/τ
f
2
,
−1/τ
s
−
1/τ
2
s
−4/τ
f
2
,
−
τ
f
u
0
+1
1−α
ατ
0
, −
τ
f
u
0
+1
1−α
τ
0
⎫
⎪
⎬
⎪
⎭
.
(8)
Since the physiological parameters are always positive, these
eigenvalues are either real and negative or have negative real
parts (Re λ
i
> 0). These values dictate how the volumes
contract along all directions of the coordinates of the phase
space and mean that the volume will shrink to a point in
time. Since the sum of the eigenvalues Tr(J)
= λ
1
+ λ
2
+ λ
3
+
λ
4
< 0, it is a dissipative system. In the dissipative system,
a trajectory starting from an initial condition in a phase
space region stays near the fixed point for a time (transient)
and then asymptotically approaches to an equilibrium state.
The dissipative system evolves in time, and the trajectory in
state space will head for the final equilibrium point. In other
words, the hemodynamic main effect seems to be roughly
a smoothing of the input and therefore has no long-term
dynamic evolution behavior. Thus, our analyses concentrate
mainly on the transient behavior associated with the start up
of the system.
Furthermore, this is a nonautonomous system where the
functions of the observables depend explicitly on time. We
can augment the phase space by one dimension
˙
t
= 1so
that the system x(t)
= [s, f , v, q]
T
is autonomous, in where
noncrossing trajectories occur. This allows us to specify time-
dependent exogenous or experiment input in the context of
an autonomous formulation.
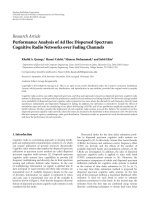
Figures 2(a)–2(c) illustrate the behavior of the hemo-
dynamic model to a 2-second stimulus for typical values
of the seven parameters. The external stimulus was taken
as the value 1 when the stimulus is ON and 0 when the
stimulus is OFF (Figure 2(a))[10, 12, 13, 19]. The resulting
HRF with typical parameters values is shown in Figure 2(c).
The stimulus results in a localized increase in neural activity,
and the consumption of oxygen and the amount of dHb
increase. Consequently, as compensation, an abrupt increase
in blood flow results in a high blood volume and also
causes some degree of attenuation in dHb content. All these
predictions of the hemodynamic model concur with the
known physiological effects in the BOLD signal. Figure 2(d)
also shows a phase portrait for the short stimulus on the
biophysical system.
4. Nonlinear Joint Estimation
We addressed this nonlinear state-space estimation ((3),
(4)) using a square root unscented Kalman filter (SR-
UKF) to maintain the nonlinearities presented in the
hemodynamic model. UKF is a derivative-free alternative
to the extended Kalman filter in the nonlinear case. It
propagates the variables mean and covariance through the
unscented transformation (UT) and possesses high accuracy
and robustness for nonlinear model estimation [24, 25].
UT deterministically chooses a set of weighted sigma points
so that the first two moments of these points match the
prior distribution and propagates them through the actual
nonlinear function. Then, the properties of the transformed
set can be recalculated from these propagated points. It can
capture the posterior mean and covariance accurately to the
3rd order (Taylor series expansion) for any nonlinearity [26].
The filtering algorithm consists essentially of two stages:
prediction and update. The prediction stage uses the system
model to predict the state posterior density (pdf) forward
from one measurement time to the next:
X
k−1
=
x
k−1
x
k−1
+ ηS
x
k−1
x
k−1
−ηS
x
k−1
,
X
k|k−1
= F
[
X
k−1
, u
k−1
]
,
x
−
k
=
2L
i=0
W
(m)
i
X
i,k|k−1
,
S
−
x
k
= qr
W
(
c
)
i
X
1:2L,k|k−1
− x
−
k
; S
v
,
S
−
x
k
= cholupdate
S
−
k
, X
0,k
− x
−
k
, W
(
c
)
0
.
(9)
EURASIP Journal on Advances in Signal Processing 5
u(t)
0
0.2
0.4
0.6
0.8
1
Time (s)
02468101214161820
(a) u(t)
Hidden variables
0
0.8
1
1.2
1.4
1.6
1.8
2
Time (s)
02468101214161820
t
v
q
(b) Hidden state variables
Signal
−0.01
−0.005
0
0.005
0.01
0.015
0.02
0.025
0.03
Time (s)
02468101214161820
(c) Signal
q
0.7
0.8
0.9
1
1.1
v
1.3
1.2
1.1
1
0.9
f
0.8
1
1.2
1.4
1.6
1.8
2
Time (s)
0 2 4 6 8 101214161820
(d) Phase portrait
Figure 2: Simulation on an impulse input (1s) for typical parameter values. (a) impulse input; (b) the concomitant changes in blood flow
( f , red), venous volume (v, green), and deoxyhemoglobin content (q, blue); (c) the corresponding BOLD response; (d) phase portrait for a
three dimensional ( f , q, v) phase space. u(t) take the value 1 when the stimulus is ON and 0 when the stimulus is OFF.
The update operation then uses the latest measurement to
modify the prediction pdf:
Y
k|k−1
= H
X
k|k−1
,
y
−
k
=
2L
i=0
W
(m)
i
Y
i,k|k−1
,
S
y
k
= qr
W
(
c
)
i
Y
1:2L,k|k−1
− y
−
k
; S
w
,
S
−
y
k
= cholupdate
S
y
k
, X
0,k
− y
−
k
, W
(
c
)
0
,
P
x
k
y
k
=
2L
i=0
W
(c)
i
X
i,k|k−1
− x
−
k
Y
i,k|k−1
− y
−
k
T
,
K
k
=
P
x
k
y
k
/S
T
y
k
S
y
k
,
x
k
= x
−
k
+ K
k
y
k
− y
−
k
,
U
= K
k
S
y
k
S
x
k
= cholupdate
S
−
x
k
, U, −1
,
(10)
6 EURASIP Journal on Advances in Signal Processing
Signal
−0.01
−0.005
0
0.005
0.01
0.015
0.02
0.025
0.03
Time (scans)
0 102030405060708090
(a)
Signal
−0.01
−0.005
0
0.005
0.01
0.015
0.02
0.025
0.03
Time (scans)
0 102030405060708090
(b)
Signal
−0.01
−0.005
0
0.005
0.01
0.015
0.02
0.025
0.03
Time (scans)
0 102030405060708090
(c)
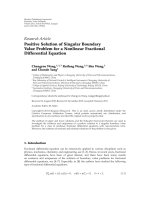
Figure 3: Simulated Datasets with three parameter sets. Each stimulus event, which was simulated by rectangular pulse of width 2-seconds.
Superiorparietal lobule
Superior
temporal
gyrus
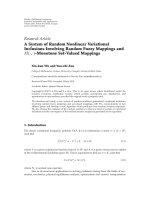
Figure 4: The activation map for the texture perception experiment. The red arrowheads indicate the location of ROI, which is the most
strongly activated voxel in their own activation blobs.
EURASIP Journal on Advances in Signal Processing 7
Normalised states
−0.4
−0.2
0
0.2
0.4
0.6
0.8
1
Time (scans)
0 102030405060708090
Blood flow
Ve n o us v o lu m e
Deoxyhemoglobin
Physiological noise
BOLD signal
−0.03
−0.02
−0.01
0
0.01
0.02
0.03
0.04
0.05
Time (scans)
0 102030405060708090
Clean
Noisy signal
SR-UKF
Measurement noise
Figure 5: Reconstructed blood oxygen level-dependent (BOLD)
signal from estimated states.
having the initial values:
x
0
= E
[
x
0
]
,
S
0
= chol
E
(
x
0
− x
0
)(
x
0
− x
0
)
T
,
S
v
=
R
v
,
S
w
=
R
w
,
(11)
where α determines the size of the sigma-point distribution,
and is usually set to 1e
− 4 ≤ α ≤ 1, β is a constant, equal to
2 for a Gaussian distribution, L is the states dimension, λ
=
L(α
2
−1) and η =
(L + λ) is scaling parameter, and {W
i
} is
a set of scalar weights (W
(m)
0
= λ/(L + λ), W
(c)
0
= λ/(L + λ)+
(1
−α
2
+ β), W
(m)
i
= W
(c)
i
= 1/{2(L + λ)}, i = 1, ,2L). R
v
is the process-noise covariance, R
w
is the observation-noise
covariance, and A
± u indicates the linear algebra operation
of adding a column vector u to each column of the matrix A.
qr
{·}is the QR decomposition of a matrix, chol is calculating
the matrix square root of the state covariance via a Cholesky
factorization, and cholupdate is Cholesky factor updating
(available in Matlab as cholupdate).
In our case, both the system state x
k
and the set of model
parameters β for the dynamic system must be simultaneously
Table 2: The final values of the parameter estimates for the
simulated data. α
= 0.33 and V
0
= 0.02 are assumed known.
Region τ
s
τ
f
τ
0
E
0
Set 1 0.54 1.54 2.46 0.98 0.34
Set 2 0.59 1.38 2.70.89 0.3
Set 3 0.49 1.72.22 1.07 0.4
BOLD signal
−0.03
−0.02
−0.01
0
0.01
0.02
0.03
0.04
0.05
Time (scans)
0 102030405060708090
Clean
Noise signal
SR-UKF
GLM
Figure 6: Comparison between the BOLD signal estimates obtained
with the general linear model (GLM) and Balloon model.
estimated from only the observed noisy signal y
k
. In the joint
filtering approach, the unknown system state and parameters
are concatenated into a single higher-dimensional joint state
vector,
x
k
, that is,
x
k
=
x
T
β
T
T
, (12)
and the state space model is reformulated as
x
k+1
=
f
(
x
k
, u
k
, v
k
)
,
y
k
=
h
k
(
x
k
, w
k
)
,
(13)
which can be expanded to
⎡
⎣
x
k+1
β
k+1
⎤
⎦
=
⎡
⎣
f
x
k
, u
k
, v
k
; β
k
β
k
⎤
⎦
+
⎡
⎣
0
r
k
⎤
⎦
,
y
k
= h
x
k
, β
k
, w
k
,
(14)
where
x
k
= [w
T
k
r
T
k
]
T
. A single SR-UKF is now run on
the augmented state space, that is joint state vector
x =
{
˙
f , f , v, q,
, τ
s
, τ
f
, τ
0
, E
0
}
T
in here, to produce simultaneous
estimates of the states x
k
and the parameters β.
8 EURASIP Journal on Advances in Signal Processing
μ = 1.3388e −004
σ
2
= 1.1533e −004
0
5
10
15
20
25
−0.03 −0.02 −0.01 0 0.01 0.02 0.03 0.04
(a) Measurement noise
μ =−5.1971e −005
σ
2
= 6.9779e −006
0
5
10
15
20
25
30
35
40
45
50
−0.025 −0.02 −0.015 −0.01 −0.005 0 0.005 0.01
(b) Blood flow f
μ =−8.5482e −006
σ
2
= 1.0002e −006
0
10
20
30
40
50
60
70
80
90
−10 −8 −6 −4 −20 2 4
×10
−3
(c) Venous volume v
μ =−2.0606e −005
σ
2
= 1.6662e −006
0
10
20
30
40
50
60
70
80
90
−6 −4 −2 0 2 4 6 8 10 12
×10
−3
(d) Deoxyhemoglobin q
Figure 7: The histogram of estimated measurement and physiological noise from synthetic data. The red line represents fitted Gaussian
function.
Since the differential equations in (3)arenotsoluble
analytically, we employ a fourth-order Runge-Kutta
method to investigate the information about the trajectory,
where step length h was set as 0.2-second to make the
truncation error involved sufficiently small. In other
words, we used a Runge-Kutta scheme to approximate
F(x
k
, u
k
)andH(x
k
), given F(x
k
, u
k
)andH(x
k
)in(4).
Furthermore, while the initial input u
0
= 1, the states
necessarily converge to their equilibrium points x
0
=
[0, τ
f
+1,(τ
f
+1)
α
, ((1 −(1 −E
0
)
1/(τ
f
+1)
)/E
0
)(τ
f
+1)
α
]
T
(Section 3), thus the initial condition was set as
x(0) = [0, 2.328, 1.322, 0.635,0.54, 1.54, 2.46, 0.98, 0.34]
T
.
5. Experimental Results
5.1. Simulated Data. Since the ground truth is unavailable
in a real fMRI data, simulated data are chosen to examine
the filtering estimation algorithm. We design three artificial
BOLD responses, with three distinct sets of values for the
parameters (Figure 3). The system parameters are set in
their typical ranges (Ta bl e 2 ). The experimental condition of
synthetic dataset is consistent with a real fMRI experiment
(Section 5.2), including external neuronal input u(t)and
scan numbers. Then we add onto these BOLD responses
the white Gaussian noise with intensities proportional to the
spectral power of noise-free time courses.
For each simulated time courses, the data assimilation
is performed. Our unscented Kalman filter treats the states
and parameters as unknown quantities and estimates their
posterior densities, given observed data. This is referred
to as a dual estimation scheme. It relies upon knowing
the covariance or precision (inverse covariance) of the
state noise, R
v
, the observation noise, R
w
, and the Kalman
gain, K. In our simulations, we assumed that the data
assimilation scheme had access to the true and known
values of these covariances and used sensible values for
our analysis of the real fMRI time series. The initial prior
parameters were set to within 10% of their true value
used in assimilations. Figure 5 shows a representation of
EURASIP Journal on Advances in Signal Processing 9
0.48
0.49
0.5
0.51
0.52
0.53
0.54
0.55
0.56
ε
0102030405060708090
Time (scans)
(a)
1.54
1.55
1.56
1.57
1.58
1.59
1.6
1.61
1.62
1.63
τ
s
0102030405060708090
Time (scans)
(b) τ
s
2.45
2.46
2.47
2.48
2.49
2.5
2.51
2.52
2.53
2.54
τ
f
0102030405060708090
Time (scans)
(c) τ
f
0.972
0.974
0.976
0.978
0.98
0.982
τ
0
0102030405060708090
Time (scans)
(d) τ
0
0.337
0.3375
0.338
0.3385
0.339
0.3395
0.34
0.3405
0.341
E
0
0102030405060708090
Time (scans)
(e) E
0
Figure 8: Convergence of parameter estimates.
10 EURASIP Journal on Advances in Signal Processing
fMRI BOLD
−0.01
−0.005
0
0.005
0.01
0.015
0.02
0.025
0.03
0.035
0.04
Time (scans)
0 5 10 15 20 25 30
ε
0
5
10
15
20
25
30
0.30.40.50.6
.
df/dt
−0.8
−0.6
−0.4
−0.2
0
0.2
0.4
0.6
0.8
Time (scans)
0 5 10 15 20 25 30
τ
s
0
5
10
15
20
25
30
1.35 1.45 1.55 1.65 1.75
.
f
0.5
1
1.5
2
2.5
Time (scans)
0 5 10 15 20 25 30
τ
f
0
5
10
15
2.32.35 2.42.45 2.52.55
.
v
0.85
0.9
0.95
1
1.05
1.1
1.15
1.2
1.25
1.3
1.35
Time (scans)
0 5 10 15 20 25 30
τ
0
0
2
4
6
8
10
12
14
16
0.85 0.90.95 1 1.05
.
q
0.6
0.7
0.8
0.9
1
1.1
1.2
Time (scans)
0 5 10 15 20 25 30
E
0
0
5
10
15
20
25
30
0.28 0.32 0.36 0.40.44
.
Figure 9: The left column shows time series of the estimated states functions of hemodynamic response to touch perception tasks. From top
to bottom: BOLD signal y (the measured signal (red plus sign) and the filtering process (blue line)),
˙
f , f , v,andq. Note that our inversion
scheme allows for random fluctuations on the parameters. This means that we have distribution as opposed to a point estimate for these
quantities. These distributions are shown in the right column. From top to bottom:
, τ
s
, τ
f
,τ
0
, E
0
.Eachstimulusevent,whichwassimulated
by rectangular pulse of width 2-seconds, is shown as strips in green. These red bounds are given by its standard deviation σ.
EURASIP Journal on Advances in Signal Processing 11
Table 3: The expectations over time of the parameter estimates
from ROIs with the presented nonlinear filtering algorithm.
τ
s
τ
f
τ
0
E
0
LPs 0.5985 1.4953 2.4889 1.0871 0.5272
GTs 0.2761 1.5421 2.4616 0.9400 0.5120
the reconstructed hemodynamic state trajectories (top) and
the estimated BOLD signal (bottom) generated by SR-UKF
(CNR
= 1). Both physiological noise and measurement noise
were presented as black line. Our approach produced better
BOLD signal estimates than a traditional GLM approach
(Figure 6). Furthermore, the histograms for the random
errors of the estimated BOLD signal and each physiological
states are also plotted in Figure 7. The red line represents
the fitted Gaussian function. The estimated means μ and
variance σ
2
for the Gaussian distribution are also shown in
Figure 7. The results clearly show that physiological noise
and measurement noise are normally distributed with mean
zero, consistent with our assumptions about the probabilistic
distribution of the random error. Each parameter estimate
converged within the 10 iterations, as shown in Figure 8.
5.2. Human Data. The volunteering participant was a
healthy, right-handed, male graduate student (age 27),
claiming to be in good health with no history of neurological
or psychological illness. The participant was instructed on
the tasks prior to scanning and was provided with a brief
practice period.
Two distinct texture photographs were presented in 2-
seconds for touch perception followed by a 14-seconds
rest. Scanning was synchronized with the onset of the first
stimulate. In total, 96 acquisitions were made (RT
= 2-
seconds), in periods of 16s, giving 1216-second circles.
Functional images were acquired on a 1.5-Tesla scanner
(Marconi EDGE ECLIPSE) using a standard fMRI gradient
echo echo-planar imaging (EPI) protocol (TE, 40 ms; TR,
2500 ms; flip angle, 90
◦
; NEX, 1; FOV, 24 cm; resolution,
64
× 64 matrix). Sixteen contiguous 6-mm-thick, 0.5-mm-
intervals were acquired to provide a coverage of the entire
brain.
The initial eight scans were discarded to avoid magnetic
saturation effects. The remaining images were realigned
and corrected for movement-related effects within
SPM (Wellcome Department of Cognitive Neurology,
http://www.fil.ion.ucl.ac.uk/spm). All volumes were rescaled
to the same global mean to focus on regional changes.
The data were then subject to the activation detection of
hierarchic statistical inference methods for the nonlinear
models. The stimulus input function u(t), the supposed
neuronal activity, was simply given as a square wave.
The resulting map, testing for activation due to texture
perception, was thresholded at P
= .05 (corrected) [19].
Two regions of interest in the right superior parietal lobule
and the left superior temporal gyrus that showed the largest
response to stimulations in their own blobs were selected for
analysis (see Figure 4).
μ = 0.0024
σ
2
= 3.0475e −005
0
2
4
6
8
10
12
14
16
18
20
−0.015 −0.01 −0.005 0 0.005 0.01 0.015
Figure 10: The histogram of estimated measurement noise. The red
line represents fitted Gaussian function.
For two regions of interest, we identified all four states
and five parameters of the nonlinear hemodynamic model
by the technique mentioned above. The system noise is
assumed as R
v
= 0.01E(9), and the measurement noise
is assumed as R
w
= 0.005. Figure 9 shows subsegments
of the estimated behavior of the state functions and
system parameters of the hemodynamic approach for
the superior parietal lobule. Each stimulus event, which
was simulated by rectangular pulse of width 2-seconds,
is shown as strips in green. The column on the right
shows the histogram of the estimated parameters. The
left column shows the time series of the estimated state
functions of the hemodynamic response to touch perception
tasks. The final value of the Kalman gain estimates is K
=
[0.0647, 0.15, 0.2368, −1.035, 0.3458,0.0659, 0.1698, 0.4356,
−0.0554]
T
. Furthermore, the histogram of the estimated
system parameters is shown in the right column. The values
of these parameters are all in the range of previous reports
[10, 13]. These physiological plausible parameters estimated
in voxels may provide valuable information to evaluate
activation. Figure 10 shows the histogram of estimated
measurement noise. The fitted Gaussian function is also
plotted as a red line. Ta ble 3 lists the estimated parameters
of the hemodynamic model from ROI with the presented
filtering algorithm. All parameter estimates fall within a
standard deviation of the expectation value reported by
previous studies.
6. Conclusion
In this paper, we describe a way of assimilating fMRI time
series that allow one to make inferences about the underlying
physiological states and the biophysical parameters generat-
ing observed fMRI signals. This corresponds to a nonlinear
deconvolution of observed data using a hemodynamic state-
space model based on stochastic differential equations. It
allows one to deconvolve data, given known experimental
inputs or perturbations. Our model can be regarded as
a stochastic Dynamic Causal Model for a signal brain
12 EURASIP Journal on Advances in Signal Processing
region, which allows for noise or random fluctuations
on the underlying or hidden physiological states. Our
deconvolution scheme uses an unscented Kalman filter and,
computationally, is equivalent to the complexity of linear
deconvolution schemes. In addition to inferring the hidden
states we also provide for inference on the parameters. This
involves augmenting the state vector with the parameters
and treating them as slowly varying states (as in variable
parameter regression and related approaches).
In conclusion, we presented a nonlinear filtering ap-
proach, which deals with the nonlinear propagation of the
probability density function (pdf) in a straight, deterministic
sample points way, for hemodynamic data assimilation. This
approach results in approximations of the posterior mean
and covariance in at least the second order (Taylor series
expansion), depending on different sampling strategy, with
equivalent computational expense to existing linearization
filtering algorithm. Hence, it can raise the potential of the
hemodynamic model for more accurate inferences about the
parameters of the model, given the data. However, although,
these benefits have been achieved, there are shortcomings in
this approach. The neuroimaging community had been con-
cerned predominantly with the functional localization. The
statistic strategy for activation detection that is appropriate
to the filtering approach still needs more work.
Acknowledgments
This work is supported by the National Natural Science
Foundation of China (nos: 30570538, 30770615, 30800250),
Zhejiang Provincial Natural Science Foundation of China
(no: Y2080281), and Doctoral Fund of Ministry of Education
of China (no: 200803351022).
References
[1]K.J.Friston,A.P.Holmes,K.J.Worsley,J.B.Poline,C.R.
Williams, and R. S. J. Frackowiak, “Analysis of functional MRI
time-series,” Human Brain Mapping, vol. 1, pp. 153–171, 1994.
[2] J. C. Rajapakse, F. Kruggel, J. M. Maisog, and D. Y. von
Cramon, “Modeling hemodynamic response for analysis of
functional MRI time-series,” Human Brain Mapping, vol. 6,
no. 4, pp. 283–300, 1998.
[3] K.J.Friston,P.Fletcher,O.Josephs,A.P.Holmes,M.D.Rugg,
and R. Turner, “Event-related fMRI: characterising differential
responses,” NeuroImage, vol. 7, pp. 30–40, 1998.
[4] P. Ciuciu, J B. Poline, G. Marrelec, J. Idier, C. Pallier, and
H. Benali, “Unsupervised robust nonparametric estimation
of the hemodynamic response function for any fMRI exper-
iment,” IEEE Transactions on Medical Imaging, vol. 22, no. 10,
pp. 1235–1251, 2003.
[5] M. Lindquist and T. Wager, “Modeling the hemodynamic
response function using inverse logit functions,” in Proceedings
of Human Brain Mapping Annual Meeting, 2005.
[6] G. H. Glover, “Deconvolution of impulse response in event-
related BOLD fMRI,” NeuroImage, vol. 9, no. 4, pp. 416–429,
1999.
[7]P.L.Purdon,V.Solo,R.M.Weisskoff, and E. N. Brown,
“Locally regularized spatiotemporal modeling and model
comparison for functional MRI,” NeuroImage, vol. 14, no. 4,
pp. 912–923, 2001.
[8]T.Obata,T.T.Liu,K.L.Miller,W M.Luh,E.C.Wong,L.
R. Frank, and R. B. Buxton, “Discrepancies between BOLD
and flow dynamics in primary and supplementary motor
areas: application of the balloon model to the interpretation
of BOLD transients,” NeuroImage, vol. 21, no. 1, pp. 144–153,
2004.
[9] R. B. Buxton, E. C. Wong, and L. R. Frank, “Dynamics of
blood flow and oxygenation changes during brain activation:
the balloon model,” Magnetic Resonance in Medicine, vol. 39,
no. 6, pp. 855–864, 1998.
[10] K. J. Friston, A. Mechelli, R. Turner, and C. J. Price, “Nonlinear
responses in fMRI: the balloon model, volterra kernels, and
other hemodynamics,” NeuroImage, vol. 12, no. 4, pp. 466–
477, 2000.
[11] K. J. Friston, “Bayesian estimation of dynamical systems: an
application to fMRI,” NeuroImage, vol. 16, no. 2, pp. 513–530,
2002.
[12] T. Deneux and O. Faugeras, “Using nonlinear models in
fMRI data analysis: model selection and activation detection,”
NeuroImage, vol. 32, no. 4, pp. 1669–1689, 2006.
[13] J. J. Riera, J. Watanabe, I. Kazuki, et al., “A state-space model
of the hemodynamic approach: nonlinear filtering of BOLD
signals,” NeuroImage, vol. 21, no. 2, pp. 547–567, 2004.
[14] L. A. Johnston, E. Duff, and G. F. Egan, “Partical filtering
for nonlinear BOLD signal analysis,” in Proceedings of the
9th International Conference on Medical Image Computing and
Computer-Assisted Intervention (MICCAI ’06), pp. 292–299,
Copenhagen, Denmark, October 2006.
[15] L. A. Johnston, E. Duff, I. Mareels, and G. F. Egan, “Nonlinear
estimation of the BOLD signal,” NeuroImage,vol.40,no.2,pp.
504–514, 2008.
[16] M. S. Arulampalam, S. Maskell, N. Gordon, and T. Clapp, “A
tutorial on particle filters for online nonlinear/non-Gaussian
Bayesian tracking,” IEEE Transactions on Signal Processing, vol.
50, no. 2, pp. 174–188, 2002.
[17] K. J. Friston, N. Trujillo-Barreto, and J. Daunizeau, “DEM: a
variational treatment of dynamic systems,” NeuroImage, vol.
41, no. 3, pp. 849–885, 2008.
[18] K. J. Friston, “Variational filtering,” NeuroImage,vol.41,no.3,
pp. 747–766, 2008.
[19] Z. H. Hu and P. C. Shi, “Nonlinear anaysis of BOLD signal:
biophysical modeling, physiological states, and functional
activation,” in Proceedings of the International Conference on
Medical Image Computing and Computer-Assisted Intervention
(MICCAI ’07), pp. 734–741, 2007.
[20] Y. Zheng, J. Martindale, D. Johnston, M. Jones, J. Berwick,
and J. Mayhew, “A model of the hemodynamic response and
oxygen delivery to brain,” NeuroImage,vol.16,no.3,part1,
pp. 617–637, 2002.
[21] R. B. Buxton, K. Uluda
˘
g, D. J. Dubowitz, and T. T. Liu,
“Modeling the hemodynamic response to brain activation,”
NeuroImage, vol. 23, supplement 1, pp. S220–S233, 2004.
[22] Y. Zheng, D. Johnston, J. Berwick, D. Chen, S. Billings, and J.
Mayhew, “A three-compartment model of the hemodynamic
response and oxygen delivery to brain,” NeuroImage, vol. 28,
no. 4, pp. 925–939, 2005.
[23] Z. H. Hu and P. C. Shi, “Sensitivity analysis for biomedical
model,” processing.
[24] S. J. Julier and J. K. Uhlmann, “Reduced sigma point filters for
the propagation of means and covariances through nonlinear
transformations,” in Proceedings of the American Control
Conference (ACC ’02), pp. 887–892, Anchorage, Alaska, USA,
May 2002.
EURASIP Journal on Advances in Signal Processing 13
[25] S. J. Julier and J. K. Uhlmann, “Unscented filtering and
nonlinear estimation,” Proceedings of the IEEE,vol.92,no.3,
pp. 401–422, 2004.
[26] R. van der Merwe and E. A. Wan, “The square-root unscented
Kalman filter for state and parameter-estimation,” in Proceed-
ings of the IEEE International Conference on Acoustics, Speech
and Signal Processing ( ICASSP ’01), vol. 6, pp. 3461–3464, Salt
Lake, Utah, USA, May 2001.