Báo cáo hóa học: " Research Article Assessment of Severe Apnoea through Voice Analysis, Automatic Speech, and Speaker " ppt
Bạn đang xem bản rút gọn của tài liệu. Xem và tải ngay bản đầy đủ của tài liệu tại đây (1.06 MB, 11 trang )
Hindawi Publishing Corporation
EURASIP Journal on Advances in Signal Processing
Volume 2009, Article ID 982531, 11 pages
doi:10.1155/2009/982531
Research Article
Assessment of Severe Apnoea through Voice Analysis,
Automatic Speech, and Speaker Recognition Techniques
Rub
´
en Fern
´
andez Pozo,
1
Jose Luis Blanco Murillo,
1
Luis Hern
´
andez G
´
omez,
1
Eduardo L
´
opez Gonzalo,
1
Jos
´
eAlc
´
azar Ram
´
ırez,
2
and Doroteo T. Toledano
3
1
Signal, Systems and Radiocommunications Department, Universidad Polit
´
ecnica de Madrid, Madrid 28040, Spain
2
Respiratory Department, Hospital Torrec
´
ardenas, Almer
´
ıa 04009, Spain
3
ATVS Biometric Recognition Group, Universidad Aut
´
onoma de Madrid, Madrid 28049, Spain
Correspondence should be addressed to Rub
´
en Fern
´
andez Pozo,
Received 1 November 2008; Revised 5 February 2009; Accepted 8 May 2009
Recommended by Tan Lee
This study is part of an ongoing collaborative effort between the medical and the signal processing communities to promote
research on applying standard Automatic Speech Recognition (ASR) techniques for the automatic diagnosis of patients with severe
obstructive sleep apnoea (OSA). Early detection of severe apnoea cases is important so that patients can receive early treatment.
Effective ASR-based detection could dramatically cut medical testing time. Working with a carefully designed speech database of
healthy and apnoea subjects, we describe an acoustic search for distinctive apnoea voice characteristics. We also study abnormal
nasalization in OSA patients by modelling vowels in nasal and nonnasal phonetic contexts using Gaussian Mixture Model (GMM)
pattern recognition on speech spectra. Finally, we present experimental findings regarding the discriminative power of GMMs
applied to severe apnoea detection. We have achieved an 81% correct classification rate, which is very promising and underpins
the interest in this line of inquiry.
Copyright © 2009 Rub
´
en Fern
´
andez Pozo et al. This is an open access article distributed under the Creative Commons Attribution
License, which permits unrestricted use, distribution, and reproduction in any medium, provided the original work is properly
cited.
1. Introduction
Obstructive sleep apnoea (OSA) is a highly prevalent disease
[1], affecting an estimated 2–4% of the male population
between the ages of 30 and 60. It is characterized by recurring
episodes of sleep-related collapse of the upper airway at the
level of the pharynx (AHI > 15, Apnoea Hypopnoea Index,
which represents the number of apnoeas and hypoapnoeas
per hour of sleep) and it is usually associated with loud
snoring and increased daytime sleepiness. OSA is a serious
threat to an individual’s health if not treated. The condition
is a risk factor for hypertension and, possibly, cardiovascular
diseases [2], it is usually related to trafficaccidentscaused
by somnolent drivers [1–3], and it can lead to a poor
quality of life and impaired work performance. At present,
the most effective and widespread treatment for OSA is
nasal (Continuous Positive Airway Pressure)CPAPwhich
prevents apnoea episodes by providing a pneumatic splint
to the airway. OSA can be diagnosed on the basis of
a characteristic history (snoring, daytime sleepiness) and
physical examination (increased neck circumference), but
a full overnight sleep study is usually needed to confirm
the disorder. The procedure is known as conventional
Polysomnography, which involves the recording of neuro-
electrophisiological and cardiorespiratory variables (ECG).
Excellent automatic OSA recognition performance—around
90% [4]—is attainable with this method based on nocturnal
ECG recordings. Nevertheless, this diagnostic procedure is
expensive and time consuming, and patients usually have to
endure a waiting list of several years before the test is done,
since the demand for consultations and diagnostic studies for
OSA has recently increased [1]. There is, therefore, a strong
need for methods of early diagnosis of apnoea patients in
order to reduce these considerable delays.
The pathogenesis of obstructive sleep apnoea has been
underinvestigationforover25years,duringwhichanumber
of factors that contribute to upper airway (UA) collapse
during sleep have been identified. Essentially, pharyngeal
2 EURASIP Journal on Advances in Signal Processing
collapse occurs when the normal reduction in pharyngeal
dilator muscle tone at the onset of sleep is superimposed on
a narrowed and/or highly compliant pharynx. This suggests
that OSA may be a heterogeneous disorder, rather than a
single disease, involving the interaction of anatomic and
neural state-related factors in causing pharyngeal collapse.
An excellent review of the anatomic and physiological factors
predisposing to UA collapse in adults with OSA can be found
in [5]. Furthermore, it is worth noting here that OSA is an
anatomic illness, the appearance of which may have been
favoured by the evolutionary adaptations in man’s upper
respiratory tract to facilitate speech, a phenomenon that
Jared Diamond calls “The Great Leap Forward”[6]. These
anatomic changes include a shortening of the maxillary,
ethmoid, palatal and mandibular bones, acute oral cavity-
skull base angulation, pharyngeal collapse with anterior
migration of the foramen magnum, posterior migration of
the tongue into the pharynx and descent of the larynx, and
shortening of the soft palate with loss of the epiglottic-soft
palate lock-up. The adaptations came about, it is believed,
partly due to positive selection pressures for bipedalism,
binocular vision and the development of voice, speech, and
language, but they may also have provided the structural
basis for the occurrence of obstructive sleep apnoea.
In our research we investigate the acoustical characteris-
tics of the speech of patients with OSA for the purpose of
learning whether severe OSA may be detected using Auto-
matic Speech Recognition techniques(ASR).Theautomated
acoustic analysis of normal and pathological voices as an
alternative method of diagnosis is becoming increasingly
interesting for researchers in laryngological and speech
pathologies in general because of its nonintrusive nature and
its potential for providing quantitative data relatively quickly.
Most of the approaches found in the literature have focused
on parameters based on long-time signal analysis, which
require accurate estimation of the fundamental frequency,
which is a fairly complex task [7, 8]. In recent years, some
studies have investigated the use of short-time measures for
pathological voice detection. Excellent recognition rates have
been achieved by modelling short-time speech spectrum
information with cepstral coefficients and using statistical
pattern classification techniques such as Gaussian Mixture
Models (GMMs) [9, 10] or discriminative methods such
as Support Vector Machines (SVMs) [11]. These techniques
based on short-time analyses can provide a characterization
of pathologic voices in a direct and noninvasive manner, and
so they promise to become a useful support tool for the
diagnosis of voice pathologies in general. In our research we
are trying to characterize severe apnoea voices in particular.
In this contribution we discuss several ways to apply
ASR techniques to the detection of OSA-related traits in
specific linguistic contexts. The acoustic properties of voice
from speakers suffering obstructive sleep apnoea are not
well understood as not much research has been carried
out in this area. However, some studies have suggested
that certain abnormalities in phonation, articulation, and
resonance may be connected to the condition [12]. In
order to have a controlled experimental framework to
study apnoea voice characterization we collected a speech
database [13] designed following linguistic and phonetic
criteria we derived from previous research in the field.
Our work is focused on continuous speech rather than on
sustained vowels, the latter being the standard approach
in pathological voice analysis [14]. Therefore, as we are
interested in the acoustic analysis of the speech signal in
different linguistic and phonetic contexts, our analysis starts
with the automatic phonetic segmentation of each sen-
tence using automatic speech recognition based on Hidden
Markov Models (HMMs). Together with automatic phonetic
segmentation, some basic acoustic processing techniques,
mainly related to articulation, phonation, and nasalization,
were applied over nonapnoea and apnoea voices to have an
initial contrastive study on the acoustic discrimination found
in our database. These results provide the proper experi-
mental framework to progress beyond previous research in
the field.
After this preliminary acoustic analysis of the discrimi-
nation characteristics of our database, we explored the possi-
bilities of using GMM-based automatic speaker recognition
techniques [15] to try to observe possible peculiarities in
apnoea patients’ voices. Successfully detecting traits that
prove to be characteristic of the voices of severe apnoea
patients by applying such techniques would allow automatic
(and rapid) diagnosis of the condition. To our knowledge
this study constitutes pioneering research on automatic
severe OSA diagnosis using speech processing algorithms
on continuous speech. The proposed method is intended
as complementary to existing OSA diagnosis methods (e.g.,
Polysomnography) and clinicians’ judgment, as an aid for
early detection of these cases. We have observed a marked
inadequacy of resources that has led to unacceptable waiting
periods. Early severe OSA detection can help increase the
efficiency of medical protocols by giving higher priority
to more serious cases, thus optimizing both social benefits
and medical resources. For instance, patients with severe
apnoea have a higher risk of suffering a car accident because
of somnolence caused by their condition. Early detection
would, therefore, contribute to reducing the risk of suffering
a car accident for these patients.
Therestofthisdocumentisorganizedasfollows.
Section 2 presents the main physiological characteristics of
OSA patients and the distinctive acoustic qualities of their
voices, as described in the literature. The speech database
used in our experimental work, as well as its design criteria, is
explained in Section 3.InSection 4 we present a preliminary
analysis of the speech signal of the voices in our database,
using standard acoustic measurements with the purpose
of confirming the occurrence of the characteristic acoustic
features identified in previous research. Section 5 explores
the advantages that standard automatic speech recognition
can bring to diagnosis and monitoring. Next, in Section 6,
we describe how we used GMMs to study nasalization in
speech, comparing the voices of severe apnoea patients with
those in a “healthy” control group. In the same section we
also present a test we carried out to assess the accuracy
of a GMM-based system we developed to classify speakers
(apnoea/nonapnoea). Finally, conclusions and a brief outline
of future research are given in Section 7.
EURASIP Journal on Advances in Signal Processing 3
2. Physiological and Acoustic
Characterist ics in OSA Speakers
At present neither the articulatory/physiological peculiarities
nor the acoustic characteristics of speech in apnoea speakers
are well understood. Most of the more valuable information
in this area can be found in Fox and Monoson’s work [12],
a perceptual study in which skilled judges compared the
voices of apnoea patients with those of a control group
(referred to as “healthy” subjects). The study showed that,
although differences between both groups of speakers were
found, acoustic cues for these differences are somewhat
contradictory and unclear. What did seem to be clear was
that the apnoea group had abnormal resonances that might
be due to an altered structure or function of the upper airway.
Theoretically, such an anomaly should result not only in
respiratory but also in speech dysfunction. Consequently,
the occurrence of speech disorder in OSA population should
be expected, and it could include anomalies in articulation,
phonation, and resonance.
(1) Articulatory Anomalies. Fox and Monoson stated that
neuromotor dysfunction could be found in the sleep apnoea
population due to a “lack of regulated innervations to the
breathing musculature or upper airway muscle hypotonus.”
This dysfunction is normally related to speech disorders,
especially dysarthria. There are several types of dysarthria,
resulting in various different acoustic features. All types of
dysarthria affect the articulation of consonants and vowels
causing the slurring of speech. Another common feature
in apnoea patients is hypernasality and problems with
respiration.
(2) Phonat ion Anomalies. These may be due to the heavy
snoring of sleep apnoea patients, which can cause inflam-
mation in the upper respiratory system and affect the vocal
cords.
(3) Resonance Anomalies. What seems to be clear is that the
apnoea group has abnormal resonances that might be due to
an altered structure or function of the upper airway causing
velopharyngeal dysfunction. This anomaly should, in theory,
result in an abnormal vocal quality related to the coupling of
the vocal tract with the nasal cavity, and is revealed through
two features.
(i) First, speakers with a defective velopharyngeal mech-
anism can produce speech with inappropriate nasal
resonance. The term nasalization can refer to two
different phenomena in the context of speech;
hyponasality and hypernasality. The former is said
to occur when no nasalization is produced when the
sound should be nasal. Hypernasality is nasalization
during the production of nonnasal (voiced oral)
sounds. The interested reader can find an excellent
reference in [16]. Fox and Monoson’s work on
the nasalization characteristics for the sleep apnoea
group was not conclusive. What they could conclude
was that these resonance abnormalities could be
perceived as a form of either hyponasality or hyper-
nasality. Perhaps more importantly, speakers with
apnoea may exhibit smaller intraspeaker differences
between nonnasal and nasal vowels due to this
dysfunction (vowels ordinarily acquire either a nasal
or a nonnasal quality depending on the presence or
absence of adjacent nasal consonants). Only recently
has resonance disorder affecting speech sound quality
been associated with vocal tract damping features
distinct from airflow in balance between the oral and
nasal cavities. The term applied to this speech disor-
der is “cul-de-sac” resonance, a type of hyponasality
that causes the sound to be perceived as if it were
resonating in a blind chamber.
(ii) Secondly, due to the pharyngeal anomaly, differences
in formant values can be expected, since, for instance,
according to [17] the position of the third formant
might be related to the size of the velopharyngeal
opening (lowering of the velum produces higher
third formant frequencies). This is confirmed in
Robb et al.’s work [18], in which vocal tract acoustic
resonance was evaluated in a group of OSA males.
Statistically significant differences were found in
formant frequency and bandwidth values between
apnoea and healthy groups. In particular, the results
of the formant frequency analysis showed that F1
and F2 values among the OSA group were generally
lower than those in the non-OSA groups. The lower
formant values were attributed to greater vocal tract
length.
These types of anomalies may occur either in isolation
or combined. However, none of them was found to be
sufficient on its own to allow accurate assessment of the
OSA condition. In fact, all three descriptors were necessary
to differentiate and predict whether the subject was in the
normal group or in the OSA group.
3. Apnoea Database
3.1. Speech Corpus. In this section, we describe the apnoea
speaker database we designed with the goal of covering all
the relevant linguistic/phonetic contexts in which physiolog-
ical OSA-related peculiarities could have a greater impact.
These peculiarities include the articulatory, phonation and
resonance anomalies revealed in the previous research review
(see Section 2).
As we pointed out in the introduction, the central aim of
our study is to apply speech processing techniques to auto-
matically detect OSA-related traits in continuous speech,
building on previous perceptual work [12]. Thus, in the
present paper we will not be concerned with sustained vow-
els, even though this has been the most common approach
in the literature on pathological voice analysis [14]. This
trend no doubt seeks to exploit certain advantages of using
sustained vowels, the main one being that their speech signal
is more time invariant than that of continuous speech, and
therefore it should, in principle, allow a better estimation of
the parameters for voice characterization. Another advantage
4 EURASIP Journal on Advances in Signal Processing
for some applications is that certain speaker characteristics
such as speaking rate, dialect and intonation do not influence
the result. Nevertheless, analysing continuous speech may
well afford greater possibilities than working with sustained
vowels because certain traits of pathological voice patterns,
and in particular those of OSA patients, could then be
detected in different sound categories (i.e., nasals, fricatives,
etc.) and also in the coarticulation between adjacent sound
units. This makes it possible to study the nature of these
peculiarities—say, resonance anomalies—in a variety of
phonetic contexts, and this is why we have chosen to focus
on continuous speech. However, we note that it is not our
intention here to compare the performance of continuous
speech and sustained vowel approaches.
The speech corpus contains readings of four sentences in
Spanish repeated three times by each speaker. Always keeping
Fox and Monoson’s work in mind, we designed phrases for
our speech database that include instances of the following
specific phonetic contexts.
(i)Inrelationtoresonance anomalies, we designed
sentences that allow intraspeaker variation measure-
ments; that is, measuring differential voice features
for each speaker, for instance to compare the degree
of vowel nasalization within and without nasal
contexts.
(ii) With regard to phonation anomalies, we included
continuous voiced sounds to measure irregular
phonation patterns related to muscular fatigue in
apnoea patients.
(iii) Finally, to look at articulatory anomalies we col-
lected voiced sounds affected by certain preceding
phonemes that have their primary locus of articu-
lation near the back of the oral cavity, specifically,
velar phonemes such as the Spanish velar approxi-
mant “g”. This anatomical region has been seen to
display physical anomalies in speakers suffering from
apnoea. Thus, it is reasonable to suspect that different
coarticulatory effects may occur with these phonemes
in speakers with and without apnoea. In particular,
in our corpus we collected instances of transitions
from the Spanish voiced velar plosive /g/ to vowels,
in order to analyse the specific impact of articulatory
dysfunctions in the pharyngeal region.
All the sentences were designed to exhibit a similar melodic
structure, and speakers were asked to read them with a
specific rhythmic structure under the supervision of an
expert. We followed this controlled rhythmic recording
procedure hoping to minimise nonrelevant interspeaker
linguistic variability. The sentences used were the following.
(1) Francia, Suiza y Hungr
´
ıa ya hicieron causa com
´
un.
fraN θja
suj θaiuη
gri a ya j
θje roη
kaw sa
ko
mun
(2) Juli
´
an no vio la manga roja que ellos buscan, en
ning
´
un almac
´
en.
xu
ljan no
βjo la
maη ga
ˇ
ro xa ke
e λoz
βus
kan en niη
gun al ma
ken
(3) Juan no puso la taza rota que tanto le gusta en el
aljibe.
xwan no
pu so la
ta θa
ˇ
ro ta ke
taN to le
γus
ta en el al
xi βe
(4) Miguel y Manu llamar
´
anentreochoynuevey
media.
mi
γel i
ma nu λama
ran
eN tre
ot
oi
nwe
βei
me ja
The first phrase was taken from the Albayzin database, a
standard phonetically balanced speech database for Spanish
[19]. It was chosen because it contains an interesting
sequence of successive /a/ and /i/ vowel sounds.
The second and third phrases, both negative, have a
similar grammatical and intonation structure. They are
potentially useful for contrastive studies of vowels in different
linguistic contexts. Some examples of these contrastive pairs
arise from comparing a nasal context, “manga roja”(
maη ga
ˇ
ro xa), with a neutral context, “taza rota”(
ta θa
ˇ
ro ta).
As we mentioned in the previous section, these contrastive
analyses could be very helpful to confirm whether indeed
the voices of speakers with apnoea have an altered overall
nasal quality and display smaller intraspeaker differences
between nonnasal and nasal vowels due to velopharyngeal
dysfunction.
The fourth phrase has a single and relatively long melodic
group containing mainly voiced sounds. The rationale for
this fourth sentence is that apnoea speakers usually show
fatigue in the upper airway muscles. Therefore, this sentence
may be helpful to discover various anomalies during the
sustained generation of voiced sounds. These phonation-
related features of segments of harmonic voice can be
characterized following any of a number of conventional
approaches that use a set of individual measurements such
as the Harmonic to Noise Ratio (HNR) [20], periodicity
measures and pitch dynamics (e.g., jitter). The sentence also
contains several vowel sounds embedded in nasal contexts
that could be used to study phonation and articulation
in nasalized vowels. Finally, with regard to the resonance
anomalies found in the literature, one of the possible traits
of apnoea speakers is dysarthria. Our sentence can be used
to analyse dysarthric voices that typically show differences in
vowel space with respect to normal speakers [21].
3.2. Data Collection. The database was recorded in the
Respiratory Department at Hospital Cl
´
ınico Universitario of
M
´
alaga, Spain. It contains the readings (see Section 3.1)of
80 male subjects; half of them suffer from severe sleep apnoea
(AHI > 30), and the other half are either healthy subjects or
only have mild OSA (AHI < 10). Subjects in both groups
have similar physical characteristics such as age and Body
Mass Index (BMI), see Tab le 1 . The speech material for the
apnoea group was recorded and collected in two different
sessions: one just before being diagnosed and the other after
several months under CPAP treatment. This allows studying
the evolution of apnoea voice characteristics for a particular
patient before and after treatment.
EURASIP Journal on Advances in Signal Processing 5
Table 1: Distribution of normal and pathological speakers in the database.
Number Mean age Std. dev. age Mean BMI Std. dev. BMI
Normal 40 42.2 8.8 26.2 3.9
Apnoea 40 49.5 10.8 32.8 5.4
3.2.1. Speech Collection. Speech was recorded using a sam-
pling frequency of 48 kHz in an acoustically isolated booth.
The recording equipment consisted of a standard laptop
computer with a conventional sound card equipped with a
SP500 Plantronics headset microphone with A/D conversion
and digital data exchange through a USB-port.
3.2.2. Image Collection. Additionally, for each subject in
the database, two facial images (frontal and lateral views)
were collected under controlled illumination conditions and
over a flat white background. A conventional digital camera
was used to obtain images in 24-bit RGB format, without
compression and with 2272
× 1704 resolution. We collected
these images because simple visual inspections are usually a
first step when evaluating patients under clinical suspicion of
suffering from OSA. Visual examination of patients includes
searching for distinctive features of the facial morphology
of OSA such as a short neck, characteristic mandibular
distances and alterations, and obesity. To our knowledge, no
research has ever been carried out to detect these OSA-related
facial features by means of automatic image processing
techniques.
4. Preliminary Acoustic Analysis of
the Apnoea Database
In order to build on the relatively little knowledge available
in this area and to evaluate how well our Apnoea Database
is suited for the purposes of our research, we first examined
some of the standard acoustic features traditionally used for
pathological voice characterization, comparing the apnoea
patient group and the control group in specific linguistic
contexts.
In a related piece of research, Fiz et al. [22]applied
spectral analysis on sustained vowels to detect possible
apnoea-pathological cases. They used the following acoustic
features: maximum frequency of harmonics, mean frequency
of harmonics and number of harmonics. They found
statistically significant differences between a control group
(healthy subjects) and the sleep apnoea group regarding the
maximum harmonic frequency for the vowels /i/ and /e/, it
being lower for OSA patients. Another piece of research on
the acoustic characterization of sustained vowels uttered by
apnoea patients using Linear Predictive Coding (LPC) can be
found in [23]. However, these studies do not investigate all
of the possible acoustic peculiarities that may be found in the
voices of apnoea patients, since focusing solely on sustained
vowels precludes the discovery of acoustic effects that occur
in continuous speech only in certain linguistic contexts.
Thus the first stage of our contrastive study was a per-
ceptual and visual comparison of frequency representations
(mainly spectrographic, pitch, energy and formant analysis)
of apnoea and control group speakers. After this we carried
out comparative statistical tests on various other acoustic
measurements that might reveal distinctive OSA traits. These
measurements were computed in specific linguistic contexts
using a phonetic segmentation generated with an HMM-
based (Hidden Markov Models) automatic speech recognition
system. We chose standard acoustic features and tested
their discriminative power on normal and apnoea voices.
We chose to compare groups using Mann-Whitney U tests
because part of the data was not normally distributed.
With this experimental setup, and following up on
previous research on the acoustic characteristics of OSA
speakers, we searched for articulatory, phonation and reso-
nance anomalies in apnoea-suffering speakers.
(1) Articulatory Anomalies. An interesting conclusion from
our initial perceptual contrastive study was that, when
comparing the distance between the second (F2) and third
formant (F3) for the vowel /i/, clear differences between the
apnoea and control groups were found. For apnoea speakers
the distance was greater, and this was especially clear in
diphthongs with /i/ as the stressed vowel, as in the Spanish
word “Suiza” (
suj θa) (See Figure 1). This finding is in
agreement with Robb’s conclusion that the F2 formant value
in the vowels produced by apnoea subjects is lower (and
therefore the distance between F3 and F2 is larger) than
normal [18].
This finding may be related to the greater length of the
vocal tract of OSA patients [18], but also, and perhaps more
importantly, to a characteristically abnormal velopharyngeal
opening which may cause a shift in the position of the
third formant. Indeed, a lowering of the velum (typical in
apnoea speakers) is known to produce higher third formant
frequencies. We measured the distance between F2 and F3
in the utterances of first test phrase listed above, which
contains good examples of stressed i’s. We measured absolute
distances in spite of the fact that the actual location of the
formants is speaker dependent. Nevertheless, we considered
that normalization was not necessary because our database
contains only male subjects with similar relevant physical
characteristics, and the formants should lie roughly in the
same regions for all of our speakers. Significant differences
were indeed found (Ta ble 2 ). This fact could support the
hypothesis that some form of nasalization is taking place in
the case of apnoea speakers.
(2) Phonation Anomalies. In [12] it is reported that the heavy
snoring of sleep apnoea patients can cause inflammation and
fatigue in the upper airway muscles and may affect the vocal
cords. As indicators of these phonation abnormalities we can
use various individual measurements such as the Harmonic
to Noise Ratio (HNR) and dysperiodicity parameters.
6 EURASIP Journal on Advances in Signal Processing
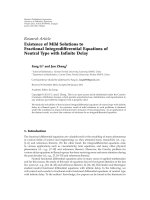
(a)
(b)
Figure 1: Differences between third and second formant for the vowel “i” in the word “Suiza”(
suj θa), (a) for an apnoea speaker and (b) a
control group speaker.
Table 2: Median and P-values for articulatory measurements ob-
tained when both groups were compared with the Mann-Whitney
U Te s t .
Feature Group Median
P-value
(95% conf)
Dif. third and
second formant
Apnoea
control
614
P<.001
586.5
(i) HNR [20] is a measurement of voice pureness. It is
based on calculating the ratio of the energy of the
harmonics to the noise energy present in the voice
(measured in dB).
(ii) Dysperiodicity, a common symptom of voice dis-
orders, refers to anomalies in the glottal excitation
signal generated by the vibrating vocal folds and the
glottal airflow. We estimated vocal dysperiodicities in
connected speech following [24].
A normal voice will tend to have a higher HNR and less
dysperiodicity (higher signal-to-dysperiodicity ratio) than
a “pathological” voice. We computed HNR and signal-to-
dysperiodicity measures for the fourth phrase in the database
since it mainly contains voiced sounds and the subjects were
asked to read it as a single melodic group. A Mann-Whitney
U test revealed significant differences (P<.05) for these
measures in the specific linguistics contexts which we stated
previously,aswecanseeinTab le 3 . This result suggests that
OSA can be linked to certain phonation anomalies, and that
the data we collected reveals these phenomena.
(3) Resonance Anomalies. Fox et al. state in [12] that a
common resonance feature in apnoea patients is abnormal
nasality. The presence and the size of one extra low frequency
formant can be considered an indicator of nasalization [25],
but no perceptual differences between the groups in the
overall nasality level could be found. As discussed in previous
sections, this could be due to common perceptual difficulties
to classify the voice of apnoea speakers as hyponasal or
hypernasal. However, we did find differences in both groups
(apnoea and nonapnoea) in how nasalization varied from
nasal to nonnasal contexts and vice versa. Interestingly,
Table 3: Median and P-values of phonation measurements ob-
tained when both groups were compared with the Mann-Whitney
U Te s t .
Feature Group Median
P-value
(95% conf)
HNR
Apnoea
control
10.3
P = .0110
10.6
Signal-to-
dysperiodicity
Apnoea
control
30.1
P<.001
32.6
we found variation in nasalization to be smaller for OSA
speakers. One hypothesis is that the voices of apnoea
speakers have a higher overall nasality level caused by
velopharyngeal dysfunction, so differences between oral and
nasal vowels are smaller than normal because the oral vowels
are also nasalized. An explanation for this could be that
apnoea speakers have weaker control over the velopharyngeal
mechanism, which may cause difficulty in changing nasality
levels, whether absolute nasalization level is high or low.
These hypotheses are intriguing and we will delve deeper into
them later.
5. Automatic Speech and Speaker
Recognition techniques
When trying to develop a combined model of various
features by observing sparse data, statistical modelling is
considered to be an adequate solution. Digital processing of
speech signals allows performing several parameterizations
of the utterances in order to weight up the various dimen-
sions of the feature space, and therefore aim to outline a
proper modelling space. Parameters extracted from a given
data set, combined with heuristic techniques, will, hopefully,
describe a generative model of the group’s feature space,
which may be compared to others in order to identify
common features, analyze existing variability, determine the
statistical significance of certain features, or even classify
entities. Selecting a convenient parameterization is therefore
a relevant task, and one that depends significantly on the
specific problem we are dealing with.
EURASIP Journal on Advances in Signal Processing 7
Every sentence in our speech database was processed
using short-time analysis with a 20 milliseconds time frame
and a 10 milliseconds delay between frames, which gives a
50% overlap. Each of the windows analyzed will later be
presented in the form of a training vector for our statistical
models (both HMMs and GMMs). However, before training
it is of great importance, as we have already pointed out, to
choose an appropriate parameterization for the information.
For the task of acoustical space modelling we chose to use 39
standard components: 12 Mel Frecuency Cepstral Coefficients
(MFCCs), plus energy, extended with their speed (delta) and
acceleration (delta-delta) components. (We acknowledge
that an optimized representation—similar to that of Godino
et al., for laryngeal pathology detection [9]—could produce
better results, but this would require specific adaptation of
the recognition techniques to be applied, which falls beyond
the goals of the study we present here.) The vectors resulting
from this front-end process are placed together in training
sets for statistical modelling. This grouping task can be
carried out following a variety of criteria depending on the
features we are interested in or the phonetic classes that need
to be modelled.
As we explained in Section 4, after speech signal param-
eterization we extract sequences of acoustic features cor-
responding to specific phonetic and linguistic contexts—
we believe they may reveal distinctive voice characteristic
for OSA speakers. We used well-known speech and speaker
recognition techniques to carry out speech phonetic segmen-
tation and apnoea/nonapnoea voice classification.
Since we needed to consider specific acoustical features
and phonetic contexts, we first performed a phonetic
segmentation of every utterance in the database. This
allows combining speech frames from different phonetic
contexts for each sound in order to generate a global
model, or classifying data by keeping them in separate
training sets. For each sentence in the speech database,
automatic phonetic segmentation was carried out using
the open-source HTK tool [26]. A full set of 24 context-
independent phonetic Hidden Markov Models (HMMs) was
trained on a manually phonetically tagged subcorpus of
the Albayzin database [18]. As our speech apnoea database
includes the transcription of all the utterances, forced
segmentation was used to align a phonetic transcription
using the 3-state context-independent HMMs; optional
silences between words were allowed to model optional
pauses in each sentence. Using automatic forced alignment
avoids the need for costly annotation of the data set by
hand. It also guarantees good quality segmentation, which
is crucial if we are to distinguish phonemes and phonetic
contexts.
After phonetic segmentation, statistical pattern recogni-
tion can be applied to classify, study or compare apnoea
and nonapnoea (control) voices for specific speech segments
belonging to different linguistic and phonetic contexts. As
cepstral coefficients may follow any statistical distribution
on different speech segments, the well-known Gaussian
Mixture Model (GMM) approach was chosen to fit a flexible
parametric distribution to the statistical distribution of the
selected speech segment. Figure 2 summarizes the whole
process we have described, showing the direct training of the
GMMs from a given database.
In our case we decided to train a universal background
GMM model (UBM) from phonetically balanced utterances
taken from the Albayzin database [18], and use MAP
(Maximum a Posteriori) adaptation to derive the specific
GMMs for the different classes to be trained. This technique
increases the robustness of the models especially when sparse
speech material is available [15]. Only the means were
adapted, as is classically done in speaker verification. Figure 3
illustrates the GMM training process.
For the experiments discussed below, both processes,
generation of the UBM and MAP adaptation to train the
apnoea and the control group GMM models, were developed
with the BECARS open source tool [27].
For testing purposes, and in order to increase the number
of tests and thus to improve the statistical relevance of our
results, the standard leave-one-out testing protocol was used.
This protocol consists in discarding one sample speaker from
the experimental database to train the classifier with the
remaining samples. Then the excluded sample is used as the
test data. This scheme is repeated until a sufficient number of
tests have been performed.
6. Apnoea Voice Modelling with GMMs
In this section we present experimental results that shed light
on the potential of using GMMs to discover and model pecu-
liarities in the acoustical signal of apnoea voices, peculiarities
which may be related to the perceptually distinguishable
traits described in previous research and corroborated in
our preceding contrastive study. The main reason for using
GMMs over the cepstral domain is related to the great
potential this combination of techniques has shown for the
modelling of the acoustic space of human speech, for both
speech and speaker recognition. For our study we required
a good modelling of the anomalies described in Section 2,
which we expected to find in OSA patients. Since cepstral
coefficients are related with the spectral envelope of speech
signals, and therefore with the articulation of sounds, and
since GMM training sets can be carefully selected in order
to model specific characteristics (e.g., in order to consider
resonance anomalies in particular), it seems promising to
combine all this information in a fused model. We should
expect such a model to be useful for describing the acoustic
spaces of both the OSA patient group and the healthy group,
and for discriminating between them.
This approach was applied to specific linguistic contexts
obtained from our HMM-based automatic phonetic seg-
mentation. In particular, as our apnoea speech database was
designed to allow a detailed contrastive analysis of vowels in
oral and nasal phonetic contexts, we focus on reporting per-
ceptual differences related to resonance anomalies that could
be perceived as either hyponasality or hypernasality. For this
purpose, Section 6.1 discusses how GMM techniques can be
applied to study these differences in degree of nasalization in
different linguistic contexts. After this prospective research,
Section 6.2 presents experimental results to test the potential
of applying these standard techniques to the automatic
8 EURASIP Journal on Advances in Signal Processing
Database
Speech
utterances
Phonetic segmentation
Short-time analysis
Training set generation
Training GMM
Class 1
Class 2
Speaker
i
Utterances
j
(MFCC
1
···MFCC
N
)(MFCC
3
···MFCC
M
) ···
···
/y/ /a/ /i/
Figure 2: Phonetic class GMM model training.
Apnoea
database
Albayzin
database
UBM
training
MAP
Apnoea group
MAP
Control group
GMM
control
GMM
apnoea
Figure 3: Apnoea and control GMM model training.
diagnosis of apnoea, and demonstrate the discriminative
power of GMM techniques for severe apnoea assessment.
6.1. A study of Apnoea Speaker Resonance Anomalies Using
GMMs. To our knowledge, signal processing and pattern
recognition techniques have never been used to analyse
hyponasalorhypernasalcontinuousspeechfromOSA
patients. Our aim with the GMM-based experimental setup
was to try to model certain resonance anomalies that have
already been described for apnoea speakers in preceding
research [12] and revealed in our own contrastive acoustic
study. Our work focuses mainly on nasality, since distin-
guishing traits for speakers with apnoea have traditionally
been sought in this acoustical aspect.
We therefore used GMM techniques to perform a
contrastive analysis to identify differences in degree of
nasalization in different linguistic contexts. Two GMMs for
each apnoea or healthy speaker were trained using speech
with nasalized and nonnasalized vowels. Both speaker-
dependent nasal and nonnasal GMMs were trained following
the approach described in Section 5. MAP adaptation was
carried out with a generic vowel UBM trained using
Albayzin database [18]. These two nasal/nonnasal GMMs
were used to quantify the acoustic differences between
nasal and nonnasal contexts for each speaker in both the
apnoea and the control groups. The smaller the difference
between the nasal and the nonnasal GMMs the more similar
the nasalized and the nonnasalized vowels are. Unusually
similar nasal and nonnasal vowels for any one speaker
reveals the presence of resonance anomalies. We took a fast
approximation of the Kullback-Leibler (KL) divergence for
Gaussian Mixture Models (Do, 2003) [28]asameasureof
distance between nasal and nonnasal GMMs. This distance
is commonly used in Automatic Speaker Recognition to
define cohorts or groups of speakers producing similar
sounds.
EURASIP Journal on Advances in Signal Processing 9
We found that the distance between nasal and nonnasal
vowel GMMs was significantly larger for the control group
speakers than for the speakers with severe apnoea (a Mann-
Whitney U test revealed significant differences (P<.05)
for these distance measures). This interesting result confirms
that the margin of acoustic variation for vowels articulated
in nasal versus nonnasal phonetic contexts is narrower than
normal in speakers with severe apnoea. It also validates the
GMM approach as a powerful speech processing and classifi-
cation technique for research on OSA voice characterization
and the detection of OSA speakers.
6.2. Assessment of Severe Apnoea Using GMMs. As we have
suggested in the previous section, with the GMM approach
we can identify some of the resonance anomalies of apnoea
speakers that have already been described in the literature.
With our experiment we intended to explore the possibilities
that applying GMM-Based Speaker Recognition techniques
may open up for the automatic diagnosis of severe apnoea.
A speaker verification system is a supervised classification
system capable of discriminating between two classes of
speech signals (usually “genuine” and “impostor”). For our
present purposes the classes are not defined by reference
to any particular speaker. Rather, we generated a general
severe sleep apnoea class and a control class (speech from
healthy subjects) by grouping together all of the training
data from speakers of each class and directly applying the
appropriate algorithm to fit both Gaussian mixtures onto our
data, because what we are interested in is in being able to
classify people (as accurately as possible) as either suffering
from severe OSA or not. This method is suitable for keeping
track of the progress of voice dysfunction in OSA patients,
it is easy-to-use, fast, noninvasive and much cheaper than
traditional alternatives. While we do not suggest it should
replace current OSA diagnosis methods, we believe it can be
a great aid for early detection of severe apnoea cases.
Following a similar approach to that of other patholog-
ical voice assessment studies [9], GMMs representing the
apnoea and control classes were built as follows.
(i) The pathological and control GMMs were trained
from the generic UBM relying on MAP adaptation
and the standard leave-one-out technique, similarly to
howwedescribedabove(Section 5).
(ii) During the apnoea/nonapnoea detection phase an
input speech signal corresponding to the whole
utterance of the speaker to be diagnosed is presented
to the system. The parameterised speech is then
processed with each apnoea and control GMM gen-
erating two likelihood scores. From these two scores
an apnoea/control decision is made according to a
decision threshold adjusted beforehand as a tradeoff
to achieve acceptable rates of both failure to detect
apnoea voices (false negative) or falsely classifying
healthy cases as apnoea voices (false positive).
Ta bl e 4 shows the correct classification rates we obtained
when we applied the GMM control/pathological voice
classification approach to our speech apnoea database [10].
We see that the overall correct classification rate was 81%.
Table 4: Correct classification rate.
Correct
classification
rate in %
Control
group
Apnoea
group
Overall
77.5%
(31/40)
85%
(34/40)
81%
(65/80)
Table 5: Contingency table of clinical diagnosis versus automatic
classification of patients.
GMM
classification
severe apnoea
GMM
classification
nonapnoea
Diagnosed
severe apnoea
(AHI >30)
(A) 40
True posit ive
(TP) 31
False negative
(FN) 9
Diagnosed
nonapnoea
(AHI <10)
(N) 40
False positive
(FP) 6
True negative
(TN) 34
Ta bl e 5 is a contingency table that shows that 31 of
the 40 speakers in the database diagnosed with severe
apnoea were classified as such by our GMM-based system
(true positives), while 9 of them were wrongly classified
as nonapnoea speakers (false negatives); and 34 of the 40
speakers diagnosed as not suffering from severe apnoea were
classified as such by our GMM-based system (true negatives),
while 6 of them were wrongly classified as apnoea speakers
(false positives).
Fisher’s exact test revealed a significant association
(P<.001) between diagnosis and automatic (GMM-based)
classification, that is, it is significantly more likely that a
diagnosed patient (either with or without apnoea) will be
correctly classified by our system than incorrectly classified.
In order to evaluate the performance of the classifier, and
so that we may easily compare it with others, we plotted a
Detection Error Tradeoff (DET) curve [29], which is a widely
employed tool in the domain of speaker verification. On
this curve, false positives are plotted against false negatives
for different threshold values, giving a uniform treatment to
both types of error. On a DET plot, the better the detector,
the closer the curve will get to the bottom-left corner.
Figure 4 shows the DET curve for our detector. The point
marked with a diamond is the equal error rate (EER) point,
that is, the point for which the false positive rate equals the
false negative rate. We obtained an EER of approximately
20%.
We now evaluate the performance of the classifier using
the following criteria.
(i) Sensitivity: ratio of correctly classified apnoea-
suffering speakers (true positives) to total number
of speakers actually diagnosed with severe apnoea.
Therefore, Sensitivity
= TP/(TP + FN).
(ii) Specificity: ratio of true negatives to total number
of speakers diagnosed as not suffering from apnoea.
Specificity
= TN/(TN + FP).
(iii) Positive Predictive Value: ratio of true positives to
total number of patients GMM-classified as having
a severe apnoea voice. Positive Predictive Value
=
TP/(TP + FP).
10 EURASIP Journal on Advances in Signal Processing
Miss probability (%)
1
2
5
10
20
40
60
80
False alarm probability (%)
12 5 10 20 40 60 80
Figure 4: DET plot for our classifier.
Table 6: Sensitivity, specificity, positive and negative predictive
value and overall accuracy.
Sensitivity Specificity
Positive
predictive
value
Negative
predictive
value
Overall
accuracy
77.5%
(31/40)
85%
(34/40)
83.8%
(31/37)
79%
(34/43)
81%
(65/80)
(iv) Negative Predictive Value: ratio of true negatives
to total number of patients GMM-classified as not
having a severe apnoea voice. Negative Predictive
Valu e
= TN/(TN + FN).
(v) Overall Accuracy: ratio of all correctly GMM-
classified patients to total number of speakers tested.
Overall accuracy
= (TP + TN)/(TP + TN + FP + FN).
Ta bl e 6 shows the values we obtained in our test for these
measures of accuracy.
Some comments are in order regarding the correct
classification rates obtained. The results are encouraging and
they show that distinctive apnoea traits can be identified by
a GMM based-approach, even when there is relatively little
speech material with which to train the system. Furthermore,
such promising results were obtained without choosing
any acoustic parameters in particular on which to base
the classification. Better results should be expected with
a representation and parameterization of audio data that
is optimized for apnoea discrimination. Obviously, our
experiments need to be validated with a larger test sample.
Nevertheless, our results already give us an idea of the
discriminative power of this approach to automatic diagnosis
of severe apnoea cases.
7. Conclusions and Future Research
In this paper we have presented pioneering research in the
field of automatic assessment of severe obstructive sleep
apnoea. The acoustic properties of the voices of speakers
suffering from OSA were studied and an apnoea speech
database was designed attempting to cover all the major
linguistic contexts in which these physiological OSA features
could have a greater impact. For this purpose we analyzed
in depth the possibilities of applying standard speech-
based recognition systems to the modelling of the peculiar
features of the realizations of certain phonemes by apnoea
patients. In relation with this issue, we focused on nasality
as an important feature in the acoustic characteristics
of apnoea speakers. Our state-of-the-art GMM approach
has confirmed that there are indeed significant differences
between apnoea and control group speakers in terms of
relative levels of nasalization between different linguistic
contexts. Furthermore, we tested the discriminative power
of GMM-based speaker recognition techniques adapted to
severe apnoea detection with promising experimental results.
A correct classification rate of 81% shows that GMM-
based OSA diagnosis could be useful for the preliminary
assessment of apnoea patients and, which suggests it is
worthwhile to continue to explore this area.
Regarding future research, our automatic apnoea assess-
ment needs to be validated with a larger sample from a
broader spectrum of population. Furthermore, best results
can be expected using a representation of the audio data
that is optimized for apnoea discrimination. Regarding the
decision threshold, an interesting study would be to look
at all the possible operating points of the system on a
DET curve. It would then be possible to move the system’s
threshold and fine-tune it to an optimal operating point for
medical applications (where, according to common medical
criteria, a false negative is a more serious matter than a false
positive). Finally, we mention that future research will also be
focused on exploiting physiological OSA features in relevant
linguistic contexts in order to explore the discriminating
power of each feature using linear discriminant classifiers or
calibration tools such as the open-source FoCal Toolkit [30].
We aim to apply these findings to improve the performance
of the automatic apnoea diagnosis system.
Acknowledgments
The activities described in this paper were funded by the
Spanish Ministry of Science and Technology as part of the
TEC2006-13170-C02-02 Project. The authors would like
to thank the volunteers at Hospital Cl
´
ınico Universitario
of M
´
alaga, Spain, and to Guillermo Portillo who made
the speech and image data collection possible. Also, the
authors gratefully acknowledge the helpful comments and
discussions of David D
´
ıaz Pardo.
References
[1] F.J.Puertas,G.Pin,J.M.Mar
´
ıa, and J. Dur
´
an, “Documento
de consenso Nacional sobre el s
´
ındrome de Apneas-hipopneas
del sue
˜
no (SAHS),” Grupo Espa
˜
nol De Sue
˜
no (GES), 2005.
EURASIP Journal on Advances in Signal Processing 11
[2] G. Coccagna, A. Pollini, and F. Provini, “Cardiovascular
disorders and obstructive sleep apnea syndrome,” Clinical and
Exper imental Hypertension, vol. 28, pp. 217–224, 2006.
[3] P. Lloberes, G. Levy, C. Descals, et al., “Self-reported sleepiness
while driving as a risk factor for traffic accidents in patients
with obstructive sleep apnoea syndrome and in non-apnoeic
snorers,” Respiratory Medicine, vol. 94, no. 10, pp. 971–976,
2000.
[4]T.Penzel,J.McNames,P.deChazal,B.Raymond,A.
Murray, and G. Moody, “Systematic comparison of different
algorithms for apnoea detection based on electrocardiogram
recordings,” Medical and Biological Engineering and Comput-
ing, vol. 40, no. 4, pp. 402–407, 2002.
[5] C. M. Ryan and T. D. Bradley, “Pathogenesis of obstructive
sleep apnea,” Journal of Applied Physiology,vol.99,no.6,pp.
2440–2450, 2005.
[6] T. M. Davidson, “The great leap forward: the anatomic basis
for the acquisition of speech and obstructive sleep apnea,”
Sleep Medicine, vol. 4, no. 3, pp. 185–194, 2003.
[7] B. Boyanov and S. Hadjitodorov, “Acoustic analysis of patho-
logical voices: a voice analysis system for the screening and
laryngeal diseases,” IEEE Engineering in Medicine and Biology
Magazine, vol. 16, no. 4, pp. 74–82, 1997.
[8] B. Guimar
˜
aes Aguiar, “Acoustic Analysis and Modelling
of Pathological Voices,” Microsoft Research, 2007, http://
www.researchchannel.org/prog/displayeventaspx?rID
=21533
&fID
=4834.
[9] C. Fredouille, G. Pouchoulin, J F. Bonastre, M. Azzarello, A.
Giovanni, and A. Ghio, “Application of automatic speaker
recognition techniques to pathological voice assessment (dys-
phonia),” in Proceedings of the 9th European Conference on
Speech Communication and Technology (Interspeech ’05),pp.
149–152, Lisboa, Portugal, September 2005.
[10] J. I. Godino-Llorente, P. Gomes-Vilda, and M. Blanco-
Velasco, “Dimensionality reduction of a pathological voice
quality assessment system based on gaussian mixture models
and short-term cepstral parameters,” IEEE Transactions on
Biomedical Engineering, vol. 53, no. 10, pp. 1943–1953, 2006.
[11] J. I. Godino-Llorente, P. G
´
omez-Vilda, N. S
´
aenz-Lech
´
on, M.
Blanco-Velasco, F. Cruz-Rold
´
an, and M. A. Ferrer-Ballester,
“Support vector machines applied to the detection of voice
disorders,” in Proceedings of the Internat ional Conference on
Non-Linear Speech Processing (NOLISP ’05), vol. 3817 of
Lecture Notes in Computer Scie nce, pp. 219–230, Springer,
Barcelona, Spain, April 2005.
[12] A. W. Fox, P. K. Monoson, and C. D. Morgan, “Speech dys-
function of obstructive sleep apnea. A discriminant analysis of
its descriptors,” Chest, vol. 96, no. 3, pp. 589–595, 1989.
[13] R. Fernandez, L. A. Hern
´
andez, E. L
´
opez, J. Alc
´
azar, G.
Portillo, and D. T. Toledano, “Design of a multimodal database
for research on automatic detection of severe apnoea cases,”
in Proceedings of the 6th Language Resources and Evaluation
Conference (LREC ’08), Marrakech, Morocco, 2008.
[14] V. Parsa and D. G. Jamieson, “Acoustic discrimination
of pathological voice: sustained vowels versus continuous
speech,” Journal of Speech, Language, and Hearing Research,
vol. 44, no. 2, pp. 327–339, 2001.
[15] D. A. Reynolds, T. F. Quatieri, and R. B. Dunn, “Speaker
verification using adapted Gaussian mixture models,” Digital
Signal Processing, vol. 10, no. 1, pp. 19–41, 2000.
[16] T. Pruthi, Analysis, vocal-tract modeling and automatic detec-
tion of vowel nasalization, Doctor thesis, University of Mary-
land, Baltimore, Md, USA, 2007.
[17] A. Hidalgo and M. Quilis, Fon
´
etica y Fonolog
´
ıa Espa
˜
nolas,
Tirant Blanch, 2002.
[18] M. P. Robb, J. Yates, and E. J. Morgan, “Vocal tract resonance
characteristics of adults with obstructive sleep apnea,” Acta
Oto-Laryngologica, vol. 117, no. 5, pp. 760–763, 1997.
[19] A. Moreno, D. Poch, A. Bonafonte, et al., “ALBAYZIN speech
database: design of the phonetic corpus,” in Proceedings of
the 3rd European Conference on Speech Communication and
Technology (EuroSpeech ’93), vol. 1, pp. 175–178, Berlin,
Germany, September 1993.
[20] P. Boersma, “Accurate short-term analysis of the fundamental
frequency and the harmonics-to-noise ratio of a sampled
sound,” in Proceedings of the Institute of Phonetic Sciences 17,
pp. 97–110, 1993.
[21] G. S. Turner, K. Tjaden, and G. Weismer, “The influence
of speaking rate on vowel space and speech intelligibility
for individuals with amyotrophic lateral sclerosis,” Journal of
Speech and Hearing Research, vol. 38, no. 5, pp. 1001–1013,
1995.
[22] J. A. Fiz, J. Morera, J. Abad, et al., “Acoustic analysis of vowel
emission in obstructive sleep apnea,”
Chest, vol. 104, no. 4, pp.
1093–1096, 1993.
[23] A. Obrador, O. Capdevila, M. Monso, et al., “An
´
alisis de la voz
en los pacientes con sindrome de apnea-hipopnea en el sue
˜
no,”
in Congreso Nacional de Neumolog
´
ıa, 2008.
[24] F. Bettens, F. Grenez, and J. Schoentgen, “Estimation of vocal
dysperiodicities in disordered connected speech by means
of distant-sample bidirectional linear predictive analysis,”
Journal of the Acoustical Society of America, vol. 117, no. 1, pp.
328–337, 2005.
[25] J. R. Glass and V. W. Zue, “Detection of nasalized vowels
in American english,” in Proceedings of IEEE International
Conference on Acoustics, Speech, and Signal Processing (ICASSP
’85), vol. 10, pp. 1569–1572, Tampa, Fla, USA, April 1985.
[26] S. Young, The HTK Book (for HTK Version 3.2), 2002.
[27] R. Blouet, C. Mokbel, H. Mokbel, E. Sanchez Soto, G.
Chollet, and H. Greige, “BECARS: a free software for speaker
verification,” in Proceedings of the Speaker and Language
Recognition Workshop (ODYSSEY ’04), pp. 145–148, Toledo,
Spain, May-June 2004.
[28] M. N. Do, “Fast approximation of Kullback-Leibler distance
for dependence trees and hidden Markov models,” IEEE Signal
Processing Letters, vol. 10, no. 4, pp. 115–118, 2003.
[29] A. Martin, G. Doddington, T. Kamm, M. Ordowski, and M.
Przybocki, “The DET curve in assessment of detection task
performance,” in Proceedings of the 6th European Conference on
Speech Communication and Technology (Eurospeech ’97),pp.
1895–1898, Rhodes, Greece, September 1997.
[30] N. Brummer and J. du Preez, “Application-independent eval-
uation of speaker detection,” Computer Speech and Language,
vol. 20, no. 2-3, pp. 230–275, 2006.