báo cáo hóa học:" Research Article Adaptive V/UV Speech Detection Based on Characterization of Background Noise" pdf
Bạn đang xem bản rút gọn của tài liệu. Xem và tải ngay bản đầy đủ của tài liệu tại đây (975.83 KB, 12 trang )
Hindawi Publishing Corporation
EURASIP Journal on Audio, Speech, and Music Processing
Volume 2009, Article ID 965436, 12 pages
doi:10.1155/2009/965436
Research Article
Adaptive V/UV Speech Detection Based on
Characterization of Background Noise
F. B er itel li,
1
S. Casale,
1
A. Russo,
1
and S. Serrano
2
1
Dipartimento di Ingegneria Informatica e delle Telecomunicazioni, Universita’ degli Studi di Catania,
Viale Andrea Doria, 6, 95125 Catania, Italy
2
Dipartimento di Fisica della Materia e Ingegneria Elettronica, Universita’ di Messina, Salita Sperone, 31, 98166 Messina, Italy
Correspondence should be addressed to S. Serrano,
Received 9 October 2008; Revised 24 February 2009; Accepted 24 June 2009
Recommended by Gerhard Rigoll
The paper presents an adaptive system for Voiced/Unvoiced (V/UV) speech detection in the presence of background noise. Genetic
algorithms were used to select the features that offer the best V/UV detection according to the output of a background Noise
Classifier (NC) and a Signal-to-Noise Ratio Estimation (SNRE) system. The system was implemented, and the tests performed
using the TIMIT speech corpus and its phonetic classification. The results were compared with a nonadaptive classification system
and the V/UV detectors adopted by two important speech coding standards: the V/UV detection system in the ETSI ES 202 212
v1.1.2 and the speech classification in the Selectable Mode Vocoder (SMV) algorithm. In all cases the proposed adaptive V/UV
classifier outperforms the traditional solutions giving an improvement of 25% in very noisy environments.
Copyright © 2009 F. Beritelli et al. This is an open access article distributed under the Creative Commons Attribution License,
which permits unrestricted use, distribution, and reproduction in any medium, provided the original work is properly cited.
1. Introduction
The issue of Voicing Detection Algorithms (VDAs) has been
one of the topics most analysed in the field of speech
processing research during the last three decades [1, 2].
The correct Voiced/Unvoiced (V/UV) classification of
a sound is essential in several speech processing systems.
Interest in voicing detection algorithms originally arose
in the field of speech coding (in particular low bit rate,
multimode, and multiband speech coding) but then spread
to various other fields of application such as speech anal-
ysis, speech synthesis, automatic speech recognition, noise
suppression and enhancement, pitch detection, voice activity
detection, speaker identification, and the recognition of
speech pathologies.
Voiced speech is produced by a quasiperiodic air flow
generated by the vibration of the vocal cords, while unvoiced
speech is produced by a turbulent air flow crossing some
constriction in the vocal tract. The signal of a voiced sound
is more or less periodic, while an unvoiced signal is noise-
like. In general there are various aspects to be analysed and
taken into consideration in developing a voiced/unvoiced
detection system: the complexity of the algorithm, the delay
introduced (and thus the duration of the analysis window
in which the decision is made), robustness to noise (which
is mainly channel and/or background noise), the overall
performance of the system, any other phonetic classes to be
considered (silence/background noise, mixed sounds, etc.),
and the training and testing database used to design and
test the algorithm (in particular the duration, the number
of different speakers, the number of languages, the types of
digitally added noise, the sampling frequency, etc.).
This paper proposes a V/UV detection algorithm that
is particularly robust to background noise. Noise-robust
speech processing in fact represents a crucial point in modern
multimedia systems [3, 4]. In particular, in the field of
speech coding noise-robust Voiced/Unvoiced (V/UV) speech
classification is fundamental to select the appropriate coding
model and to maintain a high perceived quality in the
decoded speech [5]. On the other hand, in the field of speech
recognition, robust signal classification is fundamental to
obtain a good word recognition rate even in the presence of
high background noise levels [4]. In general, the robustness
of speech classification systems does not only depend on
the level of background noise but often on its spectral and
statistical characteristics. The effect of car noise, which is
2 EURASIP Journal on Audio, Speech, and Music Processing
typically stationary, narrow-spectrum, and low frequency,
on the performance of an automatic speech recognition
system is obviously different from that of street noise, which
is nonstationary and has a spectrum covering the whole
range of speech signal frequencies. Knowledge of the type
of noise altering the characteristics of the speech signal is
fundamental in order to adapt the speech processing system
dynamically, thus making it even more robust to background
noise. It would be interesting to introduce an adaptive
V/UV detection approach to evaluate any improvement
in performance in the presence of background noise as
compared with that of a nonadaptive system. In [6]we
proposed a new approach for noise robust V/UV detection
based on adaptive noise classification and SNR estimation.
In this paper we present an extended version of this work.
Specifically, the performance of the classification system is
compared with that of other V/UV classifiers: the V/UV
detection system in the ETSI ES 202 212 v1.1.2 and the
speech classification in the Selectable Mode Vocoder (SMV)
algorithm. The performance of the system is also tested
using an extended set of noises. Comparative results with
fixed methods showed that the adaptive system proposed
outperforms the traditional solutions.
2. Previous Works
Various methodologies and approaches have been adopted
in V/UV detection techniques. All of the proposed methods
have their merits, and preference for one over another
is primarily determined by the particular application in
which such systems are to be used. There are, however, two
main categories [2]: the first comprises VDA techniques
used in conjunction with Pitch Determination Algorithms
(PDA) in which the V/UV decision is made as part
of the pitch determination problem, whereas the second
includes solutions based on the value of some parameter
or feature extracted from the speech frame analysed. Atal
and Rabiner [7] consider the methods belonging to the
first category to be of little practical interest. For pitch
detection, in fact, a large speech segment, 30–40 miliseconds
long, is necessary, while by separating the V/UV decision
from pitch detection, it is possible to perform the V/UV
decision on a much shorter speech segment. In general the
VDAs belonging to the second category detect segments
of silence as well as the two phonetic classes of V/UV
sounds.
The following is a brief chronological survey of the main
work published in the field of voicing detection, highlighting
the techniques used and the performance obtained.
The first VDAs mainly took account of the need for
low computational complexity and were therefore based on
pattern recognition techniques based on simple parameters
extracted from the signal such as energy, zero crossing rate,
first autocorrelation coefficient, first predictor coefficient,
and the energy of the prediction error. In [7] the method
proposed was found to provide reliable classification with
clean speech segments as short as 10 miliseconds, while in
[8] a spectral characterization of each class of signal was
obtained during a training session, and an LPC distance
measure and an energy distance were nonlinearly combined
to make the final V/UV discrimination. The algorithm was
tested using a number of different speakers, telephone lines
and utterances, obtaining an overall error rate of about
5%. In [1] the training phase was accomplished using a
nonparametric, nonstatistical technique obtaining an error
rate of less than 1% for clean speech sequences. In [9] the
principal features of the VDA proposed are simplicity of
realization and operation in real time with delays of less of
5 miliseconds. In [10] an adaptive V/UV decision method
for noisy speech is proposed. The paper presents a method
for estimating the probability density function of correlation
peak values and also estimating the optimal threshold of the
V/UV decision for speech corrupted by nonstationary noise.
In [11] the voiced-unvoiced-silence classification algorithm
is based on a multilayer feedforward network. The feature
vector for the classification is a combination of cepstral
coefficients and waveform features. Results indicated that an
error rate of less than 4% was obtained. In [12]animproved
cepstrum-based voicing detection algorithm is presented.
The V/UV decision is based on multifeature statistical
analysis (cepstrum peak, zero-crossing rate, and energy of
short time segments of speech). A white Gaussian noise was
added to clean speech, and the performance was about 1%
at 10 dB in both V-to-UV and UV-to-V misclassification and
about 4% at 0 dB.
In [13] the SMV (Selectable Mode Vocoder) algorithm
developed by Conexant is described. This speech coding
candidate for CDMA applications is based on EX-CELP
coding in which each frame is appropriately classified
as either silence/background noise, stationary unvoiced,
nonstationary unvoiced, onset, nonstationary voiced, or
stationary voiced. A multilevel approach is used for the
classification decision, starting with a VAD, followed by
several stages of classification refinements. The final decision
of a stationary voiced frame is based on the pitch prediction
gain. In [14] a four-level voicing decision algorithm is
proposed for the ETSI speech coding standard ES 202 212
v1.1.2. The voicing class is estimated starting from the
following parameters: the VAD and hangover flags from the
VAD block, the frame energy, the offset-free input signal, the
upper band signal, and the pitch period estimate. The voicing
detector classifies a speech frame into the following phonetic
classes: nonspeech, unvoiced, mixed voiced, and fully voiced.
In [15] a voiced/unvoiced determination algorithm using
the instantaneous frequency amplitude spectrum (IFAS) in
adverse environments is presented. The V/UV determination
is performed in two steps. Rough estimates are obtained
using contour continuity information of fundamental fre-
quency. Then, another voicing decision is made by using an
IFAS-based fundamental frequency evaluation function with
a prescribed threshold. Consequently, the algorithm refines
the rough estimates obtained in the first step by removing
the artifacts that may exist in the transition segment between
voiced and unvoiced regions. Performance evaluation is
based on a speech database including 84 Japanese sentences
sampled at 16 kHz and corrupted by additive white Gaussian,
pink and traffic noise. On average, the error rate is about 12%
at 0 dB and 5% in the clean case.
EURASIP Journal on Audio, Speech, and Music Processing 3
In [16] a speech periodicity-harmonic function (SPHF)
is proposed to manifest distinctive characteristics between
voiced and unvoiced regions. A composite feature vector
is developed by combining a periodicity measure obtained
from the SPHF with some energy measures such as zero-
crossing rate-weighted RMS energy, Kaiser-Teager frame
energy, and the normalized low-frequency energy ratio.
Unlike the conventional hard threshold, a signal-dependent
initial-threshold (SDIT) for each feature is determined based
on its statistical properties. The SDIT is exploited to develop
a logical expression that returns an objective score regarding
the V/UV region. Additional voicing criteria are introduced
to remove artifacts that may exist due to overlapping between
decision regions. White Gaussian noise (WGN) is added to
cleanspeechtohavearangeofSNRsfromcleanto0dB.
Performance in terms of total error ranges from 6% to 11%
for SNRs at 0 dB.
In [17] a low-complexity and efficient speech classifier
for noisy environments is presented. The proposed algo-
rithm utilizes the advantage of time-scale analysis of the
Wavelet decomposition to classify speech frames into voiced,
unvoiced, and silent classes. The classifier uses only one
single multidimensional feature which is extracted from the
Teager energy operator of the wavelet coefficients. The fea-
ture is enhanced and compared with quantile-based adaptive
thresholds to detect phonetic classes. Furthermore, to save
memory, the adaptive thresholds are replaced by a slope
tracking method on the filtered feature. These algorithms
are tested with the TIMIT database and additive white, car
and factory noise at different SNRs (30, 20, 10, 5 dB). In this
research, the closure and release frames of plosives are not
counted because they cannot be clearly determined as voiced
or unvoiced sounds. The average error rate obtained for the
clean case is about 7%, while at an SNR of 5dB the average
total error is about 14% for white noise, 18% for car noise,
and 21% for factory noise.
In [18] a method for estimation of the voicing character
of speech spectra is presented. It is based on calculation
of a similarity between the shape of the short-term signal
magnitude spectra and the spectra of the frame-analysis
window, which is weighted by the signal magnitude spectra.
The experimental results in terms of false acceptance and
false rejection show errors of less than 5% for speech
corrupted by white noise at the local SNR of 10 dB. The main
novelties introduced in this work in relation to the state of
art are: the adaptation of V/UV as a function of background
noise and SNR, the use of a large initial set of features,s and
the use of Genetic Algorithms (GAs)for feature selection.
3. Adaptive V/UV Detection Proposed
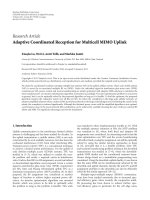
A block diagram of the adaptive V/UV detector proposed in
this paper is shown in Figure 1. A Voice Activity Detector
(VAD) classifies the input speech signal between talkspurt
and background noise. The VAD detector adopted is based
on the algorithm proposed in [3]. According to the char-
acteristics of the background noise it is possible to select
the set of parameters and the matching blocks dynamically,
so as to optimize their performance by selecting the best
configuration for that particular level and type of noise.
The matching phase of the adaptive V/UV system is based
on neural networks. A method for optimal choice of the
architecture of an NN does not exist. As shown in [11],
a neural network with 3 layers is capable of achieving
performance similar to that of a network with a larger
number of layers to solve the problem of V/UV classification.
For this reason a 3-layer FFNN was chosen. As indicated in
the previous section, various parameters have been proposed
as the starting point for V/UV speech classification. We chose
to use a vector of only a few parameters because the main
aim of the paper is to evaluate the increase in performance
that can be obtained by using an system capable of adapting
to the type of noise and the SNR rather than a nonadaptive
system. 5 parameters were chosen, in agreement with [7]
where a V/UV speech classification system using pattern
recognition techniques is proposed for the first time. We
calculated the number of nodes in the hidden layer using
an approach similar to that followed by the authors of [11].
In the clean case alone we calculated performance using
5 networks with a number of hidden layer nodes ranging
between 5 and 30. The 5-15-1 architecture was chosen
because it achieved the best tradeoff between performance
and system complexity (the gain in terms of performance
obtained by using networks with more than 15 nodes in the
hidden layer was negligible and did not justify the increase in
complexity). The V/UV detector for every class uses a 3-layer
neural network with 5 nodes in the input layer, 15 nodes in
the hidden layer, and a single output node. In the training
phase the resilient backpropagation algorithm was used:
each node uses the tansig (hyperbolic tangent) activation
function. The networks were trained to give an out-
put value of 1 for voiced speech frames and
−1for
unvoiced speech frames. The noise classifier was trained
to distinguish between N
= 4different classes of noise
(car, office, restaurant, and street noise), while the SNR
estimation block distinguishes between M
= 5values
(0 dB, 5 dB,10 dB, 15 dB, 20 dB). Considering that when the
SNR estimate exceeds a certain maximum value, the signal is
considered to beclean, and so it is not necessary to distinguish
between the various types of noise, there will be a total
of 21 blocks. 21 neural networks were trained, each with
a set of parameters selected for a specific combination of
noise type and SNR. During operations, the adaptive V/UV
system decides which noise category each frame belongs to
and estimates the SNR. On the basis of this information,
the system extracts the set of parameters selected for
that class and activates the corresponding neural network.
Classification is performed using the output of the neural
network selected.
The classifier was implemented using the TIMIT speech
corpus and its V/UV classification as a reference. The various
phonemes were grouped into two categories, Voiced and
Unvoiced, as indicated in Table 1 [19]. The TIMIT speech
corpus is subdivided into train and test categories, each of
which contains recordings of male and female speakers from
8different areas of the United States. All the audio files
were resampled at 8 kHz and scaled at
−26 dB
ovl
. (dB
ovl
is
defined as the level relative to that of a fullrange, digitized,
4 EURASIP Journal on Audio, Speech, and Music Processing
Background noise classification
Speech
signal
SNR estimation
VA D
< SNR
1
> SNR
1
< SNR
2
Clean
Type 1
Block
(1, 1)
Block
(1, 2)
Block
(1, N)
Block
(2, 1)
Block
(M−1, 1)
Block
(M−1, 2)
Block
(M−1, N)
Block
(2, 2)
Block
(2, N)
Type 2 Type N
···
···
Talkspurt
Background
noise
> SNR
M−2
< SNR
M−1
> SNR
M−1
V/UV classifier
for SNR
0.5
×(SNR
1
+SNR
2
)
and noise type 2
Figure 1: Block diagram of the adaptive V/UV detector.
Table 1: Voiced/Unvoiced phoneme classification.
Vo iced
Semivowels and Glides (l r w y hh hv el)
Vowels(iyiheheyaeaaawayahaooyow
uh uw ux er ax ix axr)
Voicedstops(bdg)
Voiced affricates (jh)
Voiced fricatives (z zh v dh)
Nasals (m n ng em en eng nx)
Flap dx (dx)
Unvoiced
Closure symbols for the stops b, d, g, p, t, k
(bcl dcl gcl pcl tck kcl)
Closure portions of jh (bjh)
Closure portions of ch (tcl)
Devoiced-schwa ax-h (ax-h)
Glottal stop q (q)
Unvoiced fricatives (s sh f th)
Unvoiced stops (p t k)
Unvoiced affricates (ch)
DC-signal: a fullrange sinusoid has a level of −3dB
ovl
).
Noise of the car, office, restaurant and street types was
added to the clean speech waveforms to create noisy speech
waveforms. The noise was digitally added to the signal in
such a way as to obtain a mean SNR of 0, 5, 10, 15, and
20 dB during activity periods. In short, considering the 4
different types of noise and the 5 different SNRs, there are 20
possible combinations. 30 miliseconds frames were extracted
from each speech sequence every 10 miliseconds. For the
training and testing of the various neural networks, two
separate sets of speakers from the TIMIT speech corpus were
used: more specifically, we used all the sentences uttered
by two speakers, one male and one female, for each of the
8different geographical areas (DR1-DR8). In this way in
both the training and test phases we used utterances by
16 different speakers with different inflections depending
on their geographical provenance. During the training of
each neural network about 8 minutes of speech were used
(7 minutes 56 seconds, including silence) from which we
extracted 28 532 vectors of examples calculated on the basis
of frames containing voiced sounds and 12 209 vectors of
examples calculated on frames containing unvoiced sounds.
In the testing phase we used more than 8 minutes of speech
(8 minutes 32 seconds, including silence) from which we
extracted a total of 43907 vectors (30 350 calculated on
frames containing voiced sounds and 13 557 calculated
on frames containing unvoiced sounds). To evaluate the
robustness of the system to types of noise other than
those used in the training phase, the test database was
extended using other noises (construction, factory, shop,
station, airport, babble, pool, and stud). In all, in the testing
phase about 8 hours, and 40 minutes of speech signal were
processed.
EURASIP Journal on Audio, Speech, and Music Processing 5
0
0
2
J
1
4
6
8
50 100
(epochs)
150 200 250
20 features
5 features
300
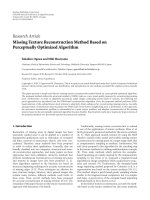
Figure 2: Separation index versus generational cycles (epochs).
Dashed line: 20 features; solid line: 5 features.
4. Adaptive Voiced/Unvoiced
Classification System
The first aim of the work was the determination of speech
parameters which will allow a more robust classification
between voiced and unvoiced frames in the presence of
various types of background noise and with different SNRs.
Various parameters were extracted from each frame:
(i) 4 LPC Spectrum based Formants F
1−4
,
(ii) 16 Mel-Cepstral based parameters MFCC
1−16
,
(iii) 16 Real Cepstrum based parameters RCEPS
1−16
,
(iv) the Energy Level log E,
(v) the estimate of the Pitch (autocorrelation based) F
0
,
(vi) 13 Autocorrelation Coefficients AC
1−13
,
(vii) 12 Linear Prediction Coefficients LPC
1−12
,
(viii) 12 Reflection Coefficients PARCOR
1−12
,
(ix) 13 Log Area Ratio Coefficients LAR
1−13
,
(x) 12 Line Spectral Frequency Coefficients LSF
1−13
,
(xi) 13 LPC Cepstral based parameter LPCC
1−13
,
(xii) the Zero Crossing Rate ZCR,
(xiii) the variance of the Linear Prediction Error σ
2
E
LPC
.
Also the first- and second-order time differences are
computed as [4, 20]
Δx
(
n
)
= x
(
n +1
)
−x
(
n − 1
)
,
ΔΔx
(
n
)
= Δx
(
n +1
)
−Δx
(
n − 1
)
.
(1)
For each frame the selection system thus had 345 values to
work on. To obtain the best subset of m variables out of
atotalofn for classification between voiced and unvoiced
in noisy conditions a certain separation criterion has to be
defined. In discriminant analysis of statistics, within-class and
between-class scatter matrices are used to formulate criteria of
class separability [21]. The within-class scatter-matrix shows
the scatter of samples around their respective expected class
vectors:
S
w
=
L
i=1
P
i
E
(
X
−M
i
)(
X
−M
i
)
T
| ω
i
=
L
i=1
P
i
Σ
i
,(2)
where P
i
is the a priori probability for class i, X is the
parameter vector, M
i
is the mean vector for class i, Σ
i
is the
covariance matrix for class i, ω
i
represents class i,andL is the
number of classes. The between-class scatter mat rix represents
the scatter of the expected vectors around the mixture mean
as
S
b
=
L
i=1
P
i
(
M
i
−M
0
)(
M
i
−M
0
)
T
,
(3)
where M
0
= E{x}=
L
i
=1
P
i
M
i
represents the expected
vector of the mixture distribution. The separation index used
J
1
was calculated from the scatter matrixes on the basis of the
following relation
J
1
= tr
S
−1
w
S
b
.
(4)
The aim was to determine an optimal subset of parameters
for classification between voiced and unvoiced frames. It is
too complex to do this via analysis of all the possible com-
binations (with n
= 345 components in the original vector,
wishing to construct a vector comprising m
= 5 components
there are 3.9561
· 10
10
possible combinations). We therefore
used a suboptimal technique based on genetic algorithms
(GAs) [22] obtaining subsets containing 5 parameters for
every noise and SNR combination. The fitness function used
to run the genetic algorithm was equal to the inverse of the
separation index, J
−1
1
. Having set the number of individuals
making up the initial population, NIND
= 86 (equal to 1/4
of the number of components, an heuristic choice that is
typically used for genetic algorithms), the first chromosome
is randomly generated, comprising a matrix of size NIND
·
n, in which each element is either 0 or 1 and such that
the number of 1 s in each row is equal to m; a selective
reproduction operator (Selch) selects a new chromosome
from the old one on the basis of the fitness functions for
each row; the new chromosome is of the same size and has a
number of 1 s per row equal to m; the crossover and mutation
operators are applied to this new chromosome. The positions
of the 1 s in the row with the lowest fitness value indicate
the m best parameters for each generation. The generational
cycle is repeated a certain number of times, and at each
generation the system stores the set of m parameters with
the best performance in terms of the separation index. At the
end of the generational cycle the set chosen is the one with
the best separation index. Ta ble 2 shows the features selected
by the GA for clean speech, while Table 3 shows the features
selected by the GA for every noise and SNR combination.
5. Automatic Noise Classification
The block that automatically classifies the type of noise
present was developed using the same approach used for
6 EURASIP Journal on Audio, Speech, and Music Processing
Table 2: List of features selected for clean speech.
CLEAN
Δ logE
LSF
2
ΔΔLSF
2
RCEPS
1
MFCC
1
Table 3: List of features selected for every noise and SNR
combination.
SNR CAR OFFICE RESTAURANT STREET
0dB
log E log E AC
9
AC
3
LSF
3
AC
9
LPCC
2
LSF
3
LPCC
4
RCEPS
1
LPCC
4
LSF
5
MFCC
1
MFCC
1
MFCC
1
ΔΔLSF
3
MFCC
2
MFCC
10
MFCC
11
MFCC
1
5dB
AC
13
AC
8
log E AC
3
LSF
2
AC
12
AC
13
LSF
3
LSF
3
RCEPS
1
LPC
2
ΔΔLSF
3
RCEPS
1
ΔΔRCEPS
1
LPCC
5
RCEPS
1
MFCC
2
MFCC
1
MFCC
5
MFCC
1
10 dB
AC
13
AC
9
AC
6
AC
5
LSF
2
AC
12
AC
13
AC
13
LSF
3
σ
2
E
LPC
σ
2
E
LPC
LSF
3
MFCC
1
RCEPS
1
LSF
3
RCEPS
1
MFCC
2
MFCC
1
MFCC
1
MFCC
1
15 dB
log E AC
13
AC
13
AC
13
AC
7
σ
2
E
LPC
σ
2
E
LPC
LSF
3
AC
13
ΔΔσ
2
E
LPC
ΔΔσ
2
E
LPC
ΔΔLSF
3
ΔΔAC
13
LSF
4
LSF
3
RCEPS
1
PARCOR
1
MFCC
1
MFCC
1
MFCC
1
20 dB
log E log E AC
13
AC
13
AC
7
AC
2
LSF
3
LSF
3
AC
13
AC
13
ΔΔLSF
3
ΔΔLSF
3
ΔAC
10
ΔAC
11
MFCC
1
RCEPS
1
PARCOR
1
ΔΔLAR
1
MFCC
2
MFCC
1
the V/UV classification of each frame (Section 4). In the
training phase 4 different noise types were used (car, office,
restaurant, and street) which include both stationary (car,
street) and highly nonstationary (office, restaurant) noises.
To develop the classification system 3-minute recordings
were used for each noise type. As in Section 4 all the available
parameters were extracted from each frame, obtaining
vectors of 345 components. Once again the separation index
used was J
1
, obtained from the scatter matrices S
w
and S
b
as in (2)and(3). Unlike voiced/unvoiced classification, in
this case the system works on L
= 4 classes to discriminate
between the 4 different types of noise. To determine the
number of components needed for correct classification 20
components were initially selected and then 5 components.
Figure 2 illustrates the trend of the separation index in the
02
dB
13
1
0
Time (s)
CAR-0
dB
CAR-0
s(n)
−
0213
Time (s)
1
20
0
SNR(n)
−
20
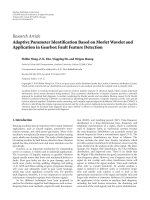
Figure 3: SNR estimate in the case of CAR noise with average SNR
set to 0 dB.
two cases considered. The parameters selected by the GA to
make up the noise classification vector were
(i) 20 components: logE, F
0
, ΔΔF
0
, ΔΔAC
13
,LPC
4
,
PARCOR
1
,LAR
1
,LSF
1
,LPCC
9
, ΔΔLPCC
9
,RCEPS
13
,
RCEPS
14
,MFCC
1
,MFCC
2
,MFCC
3
,MFCC
4
,
MFCC
10
,MFCC
16
, ΔΔMFCC
2
, ΔΔMFCC
10
,
(ii) 5 components: AC
13
, ΔΔAC
13
,LPCC
9
,MFCC
2
,
ΔΔMFCC
2
.
In both cases a 3-layer neural network was trained. The
number of nodes in the input layer is equal to the number
of components in the vector (20 in the first case; 5 in
the second). The number of nodes in the hidden layer is
double the number of nodes in the input layer (40 in the
first case; 10 in the second). The number of nodes in the
output layer is 4, corresponding to the 4 different types
of noise to be classified. The neural network was trained
by supervised learning using the resilient backpropagation
training algorithm. The hyperbolic tangent sigmoid transfer
function was used in each activation node. In the training
phase 9000 vectors were presented to the network for each
noise type (corresponding to 15 seconds of signal); the
outputs were set associating a value of +1 with the node
corresponding to the type of noise from which the input
vector was extracted and
−1 with the nodes relating to the
other three noise types. Once the network had been trained
it was tested using a further 9000 vectors for each noise type.
During the operating phase each input vector is presented to
the input nodes, and the corresponding output node values
are analysed. Classification of the vector is performed by
associating it with the type of noise related to the output
node presenting the highest value. The test phase yielded
the results shown in Tables 4 and 5 which refer, respectively,
to a system using vectors with 20 components and vectors
with 5 components. The tables give the confusion matrix,
indicating in the element in position (i, j) the number of
type i noise frames classified as type j noise, normalized
with respect to the total number of frames used to determine
EURASIP Journal on Audio, Speech, and Music Processing 7
Table 4: Misclassification using a 20-input neural network.
car street office restaurant
Car 0.9192 0 0.0784 0.0024
Street 0.0130 0.8128 0.0024 0.1717
Office 0.0481 0.0174 0.8236 0.1110
Restaurant 0.0102 0.0618 0.0408 0.8872
type i noise performance. Given the greater complexity of
the 20-input network, and to standardise the number of
parameters used for noise classification with those used
for voiced/unvoiced classification, for noise classification we
decided to use the neural network block using 5 components
as the input vector. The noise classification block has to be
activated exclusively during periods of speech inactivity so as
to avoid classification errors due to the presence of speech.
For this reason the functioning of the block is supported
by the presence of an algorithm capable of detecting speech
activity (VAD). In general, recent VAD algorithms are robust
to background noise [3, 23–26]. The VAD used for this
purpose was the SigmaVA D i l l u s t r a t e d i n [ 3]. Classification
of the noise present in a segment of speech activity is
performed by analysing the signal frames not containing
speech activity that precede the segment of speech activity.
More specifically, in the presence of speech inactivity, and
for each type of noise, the output of a bank of FIR filters is
computed according to the following relation:
y
i
(
n
)
=
N
j=1
h
j
·x
i
n − j
,
(5)
where i
= 1 4 is the index relating to the class of noise,
h
j
are the coefficients of a smoothing window obtained
considering the coefficients from N +1to2N +1ofa
Hamming window with 2N+1 points, and x
i
(n) is the output
of node i in the neural noise classification network calculated
for frame n. The presence of smoothing by means of half
a Hamming window makes it possible to compensate for
misclassification of noise types by implementing a hangover
mechanism. Considering that a change in noise type is a
relatively slow process, the system response regarding noise
type is based on an analysis of 500 miliseconds of signal. The
half of a Hamming window used makes it possible to give
more weight to the neural network output for the current
frame and progressively less weight to past frames. During
the speech activity phase noise classification is performed by
determining the index for the FIR filter bank output with the
highest value, according to the following relation:
noise
index
(
n
)
=
⎧
⎪
⎨
⎪
⎩
noise
index
(
n
−1
)
, y
i
(
n
)
= 0 ∀i,
arg
4
max
i=1
y
i
(
n
)
, otherwise,
(6)
and we set noise
index
(0) = 1. The condition noise
index
(n) =
noise
index
(n − 1) if y
i
(n) = 0foralli, together with
noise
index
(0) = 1, makes it possible to assume CAR noise
when the classifier has not yet given a valid output.
Table 5: Misclassification using a 5-input neural network.
car street office restaurant
Car 0.8689 0 0.1277 0.0033
Street 0.0052 0.6881 0.0031 0.3035
Office 0.1668 0.0068 0.6303 0.1960
Restaurant 0.0098 0.0762 0.1092 0.8048
02
dB
13
1
0
Time (s)
CAR-5
dBCAR-5
s(n)
−
0213
Time (s)
1
20
0
SNR(n)
−
20
Figure 4: SNR estimate in the case of CAR noise with average SNR
set to 5 dB.
6. Automatic SNR Estimation
Automatic SNR estimation is also performed with the aid
of the algorithm implemented bySigmaVAD. With reference
to [3], it is useful to recall that the system has two
adaptive thresholds, σ
down
and σ
up
. Before the hangover
block the system assumes that the signal contains exclusively
background noise if the output is below the threshold σ
down
and that it contains speech activity if the output is above
the threshold σ
up
. The occurrence of one of these situations
is used as a condition to update the parameters estimated
by the algorithm. Intermediate situations are solved by
the hangover block. To update the SNR estimation two
autoregressive filters were used: one to calculate the average
power of the signal in the presence of speech activity and one
to calculate the average signal power when there is no speech
activity. For each frame the signal power l is calculated. If the
output of the SigmaVAD system before the hangover block
is above the threshold σ
up
, the signal power estimate in the
presence of speech activity is updated using the following
relation:
l
N+A
(
n
)
= k
N+A
·l
N+A
(
n
−1
)
+
(
1 − k
N+A
)
·l.
(7)
If the output of the SigmaVAD system before the hangover
block is below the threshold σ
down
, the signal power estimate
in the absence of speech activity is updated using the
following relation:
l
N
(
n
)
= k
N
·l
N
(
n
−1
)
+
(
1 − k
N
)
·l.
(8)
8 EURASIP Journal on Audio, Speech, and Music Processing
0
0
5
10
V/UV error (%)
15
20
25
30
35
40
510
SNR (dB)
15 20
(a) Car
0
0
5
10
V/UV error (%)
15
20
25
30
35
40
510
SNR (dB)
15 20
(b) Office
0
0
5
10
V/UV error (%)
15
20
25
30
35
40
5
Clean
No-adaptive VUV
A_VUV
10
SNR (dB)
15 20
(c) Restaurant
0
0
5
10
V/UV error (%)
15
20
25
30
35
40
5
Clean
No-adaptive VUV
A_VUV
10
SNR (dB)
15 20
(d) Street
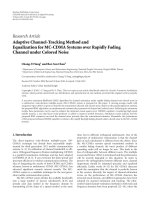
Figure 5: Performance comparison between Adaptive VUV and Nonadaptive VUV in different noise conditions.
The initial value for the background noise estimate was
assumed to be (l
N
(0)), equal to −46 dBovl, and the initial
value for the signal power estimate in the presence of
speech activity was assumed to be (l
N+A
(0)), equal to
−25.9568 dBovl (in this way we initially assume an SNR
of 20dB and an average speech signal power level of
−26 dBovl). The values of the constants of the autoregressive
filters were set, respectively, to k
N+A
= 0.95 and k
N
= 0.75 to
obtain a faster update of the background noise estimate and
a slower update of the level of presence of speech activity (so
as to smooth level variations due to utterance of the different
types of phonemes). The two are only valid when l
n+a
>l
n
,
so
SNR
(
n
)
=
⎧
⎪
⎨
⎪
⎩
10 log
10
l
n+a
/10
−10
l
n
/10
−
l
n
, l
n+a
>l
n
,
SNR
(
n
−1
)
, otherwise,
(9)
Figures 3 and 4 show the SNR in the case of CAR noise
with an average SNR in activity segments of 0 dB and
5 dB, respectively. From analysis of the figures it can be
observed that in segments where speech activity is present the
estimated SNR value follows the preset value quite faithfully.
In order to actually choose the classifier to use on the
basis of the SNR estimated, the estimation interval was
subdivided into 5 classes: C
0dB
:SNR< 2.5dB, C
5dB
:
2.5dB
≤ SNR < 7.5dB,C
10 dB
:7.5dB ≤ SNR <
12.5dB,C
15 dB
:12.5dB ≤ SNR < 17.5dB,C
20 dB
:SNR≥
17.5 dB. When the SNR estimated falls into class C
i
we will
use the parameter selected and the neural network trained
corresponding to the average SNR set for activity segments
equal to i (together with the information obtained by the
noise classifier).
7. Experimental Results
The accuracy of the V/UV classification obtained by the
system was evaluated using an objective error measure
EURASIP Journal on Audio, Speech, and Music Processing 9
0
0
10
20
V/UV error (%)
30
40
50
60
70
510
SNR (dB)
15 20
(a) Car
0
0
10
20
V/UV error (%)
30
40
50
60
70
510
SNR (dB)
15 20
(b) Office
0
0
10
20
V/UV error (%)
30
40
50
60
70
510
SNR (dB)
15 20
A_VUV
ETSI
SMV
(c) Restaurant
0
0
10
20
V/UV error (%)
30
40
50
60
70
510
SNR (dB)
15 20
A_VUV
ETSI
SMV
(d) Street
Figure 6: Performance comparison in terms of VuV ER% versus SNR in different noise conditions.
VuV ER%, which represents the percentage of erroneous
segments as compared with the overall number of segments
in the speech signal. This covers both V-to-UV and UV-to-V
errors.
The validity of the system was first compared with that
of a nonadaptive system. The graphs in Figure 5 illustrate
the trend followed by three curves. The first (labelled with
the symbol “square”) indicates the VuV
ER% obtained using
a nonadaptive system: in any background noise and SNR
conditions, this system uses for classification the vector of
5 components obtained in the clean case and the network
trained in the clean case. The second curve (labelled with
an “asterisk”) indicates the VuV
ER% obtained using the
adaptive system proposed. The third and last curve (labelled
with a “circle”) was inserted into the graphs as a reference
for comparison between the performance of the V/UV
classification system in the clean case and the various noisy
cases. As can be seen in Figure 5 the adaptive system gives
a clear improvement in performance with all types of noise
and SNR values. In the case of nonbabble noise (car, street)
the error is on average halved, while in the case of babble
noise (office, restaurant) there is less improvement as in these
conditions the noise may contain periodic components that
increase UV-to-V misclassification.
The performance of the proposed classification system
was then compared with that of other V/UV classifiers
used in two important speech coding standards: the V/UV
detection system in the ETSI ES 202 212 v1.1.2 and the
speech classification in the SMV algorithm.
The classification system in the ETSI ES 202 212 v1.1.2
front-end distinguishes between “non-speech”, “unvoiced”,
“mixed voiced” and “fully voiced” frames, whereas in the
SMV algorithm frames are classified as “silence”, “noiselike”,
“stationary unvoiced”, “nonstationary unvoiced”, “onset”,
10 EURASIP Journal on Audio, Speech, and Music Processing
0
0
10
20
V/UV error (%)
30
40
50
60
70
510
SNR (dB)
15 20
(a) Construction
0
0
10
20
V/UV error (%)
30
40
50
60
70
510
SNR (dB)
15 20
(b) Factory
A_VUV
ETSI
SMV
0
0
10
20
V/UV error (%)
30
40
50
60
70
510
SNR (dB)
15 20
(c) Shop
A_VUV
ETSI
SMV
0
0
10
20
V/UV error (%)
30
40
50
60
70
510
SNR (dB)
15 20
(d) Station
Figure 7: Performance comparison in terms of VuV ER% versus SNR in different noise conditions using noise types other than those used
during training.
“nonstationary voiced” and “stationary voiced”. In order
to compare the performance of these algorithms with that
of the system proposed here, it was necessary to regroup
the various frames classified. More specifically, in the case
of the classification system in the ETSI front-end frames
classified as “nonspeech”, “unvoiced,” and “mixed voiced”
wereidentifiedas“unvoiced”,andframesclassifiedas“mixed
voiced” and “fully voiced” as “voiced”. A frame classified as
“mixed-voiced” will therefore always be correctly classified.
In the classification system present in the SMV algorithm
the grouping was such that frames classified by the systems
as “nonstationary voiced,” and “stationary voiced” were
classified as “voiced”, whereas frames classified as “silence”,
“noise like”, “stationary unvoiced”, “nonstationary unvoiced,”
and “onset” were classified as “unvoiced”.
Performance was initially compared for the 4 noise
types (car, office, restaurant, and street) and with the 5
SNRs used to train the system. As the graph in Figure 6
shows, the performance of the proposed system is better in
comparison with the ETSI and SMV classification systems
with low SNRs (0 dB and 5 dB) or at least comparable with
higher SNRs. To evaluate the capacity for generalisation
of the adaptive system proposed, its performance was also
assessed in the presence of noise types other than those
used during the training phase. Figure 7 shows the results
obtained considering construction, factory, shop, and station
noise. Analysis of these results confirms the improvement in
performance given by the classification system proposed in
this paper. With these types of noise the improvement is as
much as 25% in very noisy environments (0 dB). Figure 8
gives the results obtained with further types of noise: airport,
babble, pool, and stud. Once again the system is more robust
than other V/UV classification systems in very noisy contexts.
The system proposed here is again more robust than
other V/UV classification systems, above all in very noisy
contexts.
EURASIP Journal on Audio, Speech, and Music Processing 11
0
0
10
20
V/UV error (%)
30
40
50
60
70
510
SNR (dB)
15 20
(a) Airport
0
0
10
20
V/UV error (%)
30
40
50
60
70
510
SNR (dB)
15 20
(b) Babble
0
0
10
20
V/UV error (%)
30
40
50
60
70
510
SNR (dB)
15 20
A_VUV
ETSI
SMV
(c) Pool
0
0
10
20
V/UV error (%)
30
40
50
60
70
510
SNR (dB)
15 20
A_VUV
ETSI
SMV
(d) Stud
Figure 8: Performance comparison in terms of VuV ER% versus SNR in different noise conditions using noise types other than those used
during training.
8. Conclusions
The paper has presented the results of a new adaptive
approach to V/UV speech classification in noisy environ-
ments when the system is tested with noises and SNRs
other than those used in the training phase. The idea is to
determine the set of features and neural networks that will
allow the best V/UV classification with different types of
noise and SNRs. The features were selected by genetic algo-
rithms. The adaptive system outperformed the main V/UV
detectors recently standardized in the field of speech coding.
The adaptive system is particularly suitable in applications
featuring the presence of highly noisy environments, that is,
with SNRs lower than 10 dB.
References
[1] L. J. Siegel, “A procedure for using pattern classification
techniques to obtain a voiced/unvoiced classifier,” IEEE Trans-
actions on Acoustics, Speech and Signal Processing, vol. 27, no.
1, pp. 83–89, 1979.
[2] W. J. Hess, “Pitch and voicing determination,” in Advances in
Speech Signal Processing, S. Furui and M. Sondhi, Eds., pp. 3–
48, Marcel Dekker, New York, NY, USA, 1991.
[3] F. Beritelli, S. Casale, and S. Serrano, “A low-complexity
speech-pause detection algorithm for communication in noisy
environments,” European Transactions on Telecommunications,
vol. 15, no. 1, pp. 33–38, 2004.
[4]J.C.JunquaandJ.P.Haton,Robustness in Automatic Speech
Recognition: Fundamentals and Applications,KluwerAcademic
Publishers, Dordrecht, The Netherlands, 1996.
[5] F. Beritelli, “A modified CS-ACELP algorithm for variable-
rate speech coding robust in noisy environments,” IEEE Signal
Processing Letters, vol. 6, no. 2, pp. 31–34, 1999.
[6] F.Beritelli,S.Casale,andS.Serrano,“AdaptiveV/UVspeech
detection based on acoustic noise estimation and classifica-
tion,” Electronics Letters, vol. 43, no. 4, pp. 249–251, 2007.
[7] B. S. Atal and L. R. Rabiner, “A pattern recognition approach
to voiced-unvoiced-silence classification with applications to
12 EURASIP Journal on Audio, Speech, and Music Processing
speech recognition,” IEEE Transactions on Acoustics, Speech,
and Signal Processing, vol. 24, no. 3, pp. 201–212, 1976.
[8] L. R. Rabiner and M. R. Sambur, “Application of an LPC
distance measure to the voiced-unvoiced-silence detection
problem,” IEEE Transactions on Acoustics, Speech, and Signal
Processing, vol. 25, no. 4, pp. 338–343, 1977.
[9] S. G. Knorr, “Reliable voiced/unvoiced decision,” IEEE Trans-
actions on Acoustics, Speech and Signal Processing, vol. 27, no.
3, pp. 263–267, 1979.
[10] H. Kobatake, “Optimization of voiced/unvoiced decisions
in nonstationary noise environments,” IEEE Transactions on
Acoustics, Speech, and Signal Processing, vol. 35, no. 1, pp. 9–
18, 1987.
[11] Y. Qi and B. R. Hunt, “Voiced-unvoiced-silence classifications
of speech using hybrid features and a network classifier,” IEEE
Transactions on Speech and Audio Processing, vol. 1, no. 2, pp.
250–255, 1993.
[12] S. Ahmadi and A. S. Spanias, “Cepstrum-based pitch detection
using a new statistical V/UV classification algorithm,” IEEE
Transactions on Speech and Audio Processing, vol. 7, no. 3, pp.
333–338, 1999.
[13]Y.Gao,E.Shlomot,A.Benyassine,J.Thyssen,H.Su,andC.
Murgia, “The SMV algorithm selected by TIA and 3GPP2
for CDMA applications,” in Proceedings of the IEEE Interna-
tional Conference on Acoustics, Speech and Signal Processing
(ICASSP ’01), vol. 2, pp. 709–712, Salt Lake City, Utah, USA,
May 2001.
[14] ETSI, Tech. Rep. ETSI ES 202 212 v1.1.2, November 2005.
[15] D. Arifianto and T. Kobayashi, “Voiced/unvoiced determina-
tion of speech signal in noisy environment using harmonicity
measure based on instantaneous frequency,” in Proceedings
of the IEEE International Conference on Acoustics, Speech,
and Signal Processing (ICASSP ’05), vol. 1, pp. 877–880,
Philadelphia, Pa, USA, March 2005.
[16] C. Shahnaz, W P. Zhu, and M. O. Ahmad, “A multifeature
voiced/unvoiced decision algorithm for noisy speech,” in
Proceedings of IEEE International Symposium on Circuits and
Systems (ISCAS ’06), pp. 2525–2528, Island of Kos, Greece,
May 2006.
[17] T. Van Pham and G. Kubin, “Low-complexity and efficient
classification of voiced/unvoiced/silence for noisy environ-
ments,” in Proceedings of the 9th International Conference on
Spoken Language Processing (ICSLP ’06), vol. 5, pp. 2198–2201,
Pittsburgh, Pa, USA, September 2006.
[18] P. Jan
ˇ
covi
ˇ
c and M. K
¨
ok
¨
uer, “Estimation of voicing-character
of speech spectra based on spectral shape,” IEEE Signal
Processing Letters, vol. 14, no. 1, pp. 66–69, 2007.
[19] X. Huang, A. Acero, and H. Hon, Spoken Language Processing,
chapter 2, Prentice Hall PTR, Englewood Cliffs, NJ, USA, 2001.
[20] S. Young, et al., The HTK Book (for HTK Version 3.3),
Engineering Department, Cambridge University, Cambridge,
UK, 2005.
[21] K. Fukunaga, Introduction to Statistical Pattern Recognition,
chapter 10, Academic Press, New York, NY, USA, 1990.
[22] D. F. Goldberg, Genetic Algorithms in Search, Optimization
and Machine Learning, Addison-Wesley, Reading, Mass, USA,
1989.
[23] M. Fujimoto and K. Ishizuka, “Noise robust voice activity
detection based on switching Kalman filter,” IEICE Transac-
tions on Information and Systems, vol. E91-D, no. 3, pp. 467–
477, 2008.
[24] M. Fujimoto, K. Ishizuka, and T. Nakatani, “A voice activity
detection based on the adaptive integration of multiple speech
features and a signal decision scheme,” in Proceedings o f
IEEE International Conference on Acoustics, Speech, and Signal
Processing (ICASSP ’08), pp. 4441–4444, Las Vegas, Nev, USA,
March-April 2008.
[25] K. Li, M. N. S. Swamy, and M. O. Ahmad, “An improved
voice activity detection using higher order statistics,” IEEE
Transactions on Speech and Audio Processing,vol.13,no.5,pp.
965–974, 2005.
[26] F. Beritelli, S. Casale, G. Ruggeri, and S. Serrano, “Performance
evaluation and comparison of G.729/AMR/fuzzy voice activity
detectors,” IEEE Signal Processing Le tters, vol. 9, no. 3, pp. 85–
88, 2002.