báo cáo hóa học:" Research Article A New Technique for the Digitization and Restoration of Deteriorated Photographic Negatives" pptx
Bạn đang xem bản rút gọn của tài liệu. Xem và tải ngay bản đầy đủ của tài liệu tại đây (7.44 MB, 13 trang )
Hindawi Publishing Corporation
EURASIP Journal on Image and Video Processing
Volume 2009, Article ID 217016, 13 pages
doi:10.1155/2009/217016
Research Article
A New Technique for the Digitization and Restoration of
Deterior ated Photographic Negat ives
George V. Landon,
1
Duncan Clarke,
2
and W. Brent Seales
3
1
Department of Computer Science, Eastern Kentucky University, Richmond, KY 40475, USA
2
Fremont Associates, LLC, Camden, SC 29020-4316, USA
3
Center for Visualization and Virtual Environments, Computer Science Department,
University of Kentucky, Lexington, KY 40506-0495, USA
Correspondence should be addressed to George V. Landon,
Received 17 February 2009; Revised 12 June 2009; Accepted 31 August 2009
Recommended by Nikos Nikolaidis
This work describes the development and analysis of a new image-based photonegative restoration system. Deteriorated acetate-
based safety negatives are complex objects due to the separation and channeling of their multiple layers that has often occurred
over 70 years time. Using single-scatter diffuse transmission model, the intrinsic intensity information and shape distortion of film
can be modeled. A combination of structured-light and high-dynamic range imaging is used to acquire the data which allows for
automatic photometric and geometric correction of the negatives. This is done with a simple-to-deploy and cost-effective camera
and LCD system that are already available to most libraries and museums. An initial analysis is provided to show the accuracy of
this method and promising results of restoration of actual negatives from a special archive collection are then produced.
Copyright © 2009 George V. Landon et al. This is an open access article distributed under the Creative Commons Attribution
License, which permits unrestricted use, distribution, and reproduction in any medium, provided the original work is properly
cited.
1. Introduction
Much of the current research in the area of document imag-
ing has focused in document acquisition and restoration
and, in particular, digitizing bound books or manuscript
pages. Acquisition and restoration of general document types
has been given focus by many groups who have made a
great deal of progress in creating fast and accurate digitiza-
tion systems. Currently, restoration of standard documents
typically consists of correcting geometric and photometric
distortions. Some works have focused mainly on geometric
correction of distorted documents [1, 2]. Other projects
have focused more on photometric correction of documents
[3, 4], while others have relied on assumed document
shapes to provide photometric and geometric corrections for
objectssuchasboundbooks[5] and folded documents [6].
Research has also been performed to scan documents that
are not typically visible with normal imaging devices [7].
However, deteriorated photographic negatives have typically
been overlooked. Digitally preserving and restoring these
deteriorating negatives is an urgent challenge that requires
an easily-accessible solution since many of them are suffering
devastating forms of deterioration [8].
A significant contribution of work has focused on the
restoration of deteriorated photographs. Digital Inpainting
[9]providesanefficient procedure for restoring areas of
loss in digital images. Inpainting has been improved in
many ways since [10–12], however, these procedures assume
total loss of data in areas requiring restoration. Content-
based representation was used to assist in automatic and
semiautomatic restorations [13]. Reflective light imaging has
also been used to detect blotches that have not fully destroyed
the underlying content [14]. Once detected, the content is
extracted from the blotches to remove the deterioration. In
a slightly different direction, a technique was developed to
remove reflections from within the photographic content
itself [15]. For an overview of photograph restoration
techniques, the reader may refer to [16]. In more recent work,
a flatbed scanner was utilized to detect surface variations in a
photograph caused by folding [17]. While the reconstruction
technique works well for detecting anomalies, the restoration
uses inpainting techniques that are not suitable for large areas
2 EURASIP Journal on Image and Video Processing
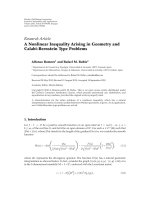
Antiabrasion
Adhesive
Emulsion
Base
Anticurl
Antihalation
Silver halide
crystal grain
Layer thickness
10–20 μm
200 μm
10–20 μm
Figure 1: The physical composition of film.
of deterioration. Moreover, most of these methods generally
focus on a scanned image of a photograph and usually
only handle standard photographic prints. One project that
does work directly with glass plate negatives [18] uses rigid
transformations to assemble broken photographs.
While these works have provided a great deal of
progress toward acquiring many types of documents, they
do not provide a way to capture documents with nonlinear
transparent properties. However, there has been work to
acquire shape and optical properties of general transparent
objects. One technique makes assumptions about the object
shape to reconstruct the surface [19]. In contrast, another
method, using scatter tracing [20], acquires the outermost
surface of complex transparent objects using assumptions
about the object composition. More recently, heat was
used as a structured-light illuminant to accurately scan
complex objects [21]; however, this type of technique is
unsuitable for delicate pieces under conservation. For some
applications, recording only the light transport of a scene
is required. Specifically, environment matting [22, 23] uses
a novel method for capturing the light transport through a
scene. The work presented here extends initial attempts at
negative scanning developed by the authors [24]. However,
to the authors’ knowledge, no other work has been directly
performed on the damaged acetate negatives.
2. Damage and Restorati on
The basic composition of film is shown in Figure 1.The
two most important components to be considered in the
research presented here are the emulsion layer and base layer.
The emulsion layer contains the photographic content of the
film, while the base layer provides support and rigidity to
the film. Therefore, the base layer itself contains no relevant
information but only provides the physical stability necessary
to keep the emulsion structurally sound.
The damage to film collections is widespread and
increasing [8]. It was once thought that the deterioration
of various laminate layers of photographic negatives, which
would make the negative unprintable, was isolated to a
very narrow set dating from the late 1940s to early 1950s.
It has since been discovered, however, that the number of
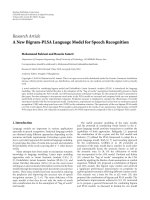
(a) The emulsion side of a deterio-
rated negative
(b)Theacetatesideofthesame
negative
Figure 2: Example of a severely damaged negative.
degraded negatives is much higher and covers a broader
period of time, from 1925 to as late as 1955. This period
of 30 years encompasses vast and diverse collections of
“safety” negatives. These negatives were produced from new
materials in order to move away from the flammability of
cellulose nitrate, which was used for still photography until
the early 1920s and in the motion picture industry well
into the 1950s. The safety film that emerged was varied
in its composition but largely based on cellulose diacetate.
This new material lessened the risk of flammability but
was not an ideal film base because of its tendency, even
under proper conservation, to absorb moisture and cause
dimensional distortion, as shown in Figure 2.Eventuallynew
polyester-based material was developed in the 1950s to solve
the dimensional instability problem. However, the diacetate
period produced millions of negatives that are now at
risk.
The worldwide response by conservators to the risk
of damage to collections is not handled uniformly. In
the best case, institutions have recognized deterioration
and have taken steps to store collections in a controlled
environment to minimize the progressive damage, but the
chemical deterioration of the acetate base can only be
slowed, not stopped. The size and importance of the affected
photographic collections cannot be overstated, with many
individual collections containing over 100 000 negatives.
The reality of budgeting, space constraints, and personnel
limitations has led to a situation where damage is continuing
and has placed many important items at risk. This has
created an urgent need for a technique that can capture the
information in each of the negatives of a large collection
before the damage causes a complete and irretrievable loss
of information.
2.1. Restoration Approaches. The primary approach to slow-
ing the deterioration of photographic negatives is correct
conservation. For many collections, it is simply too late
and the damage has already been done. At the present, the
only known solution to repair a deteriorating negative is to
strip the emulsion layer from the degraded film base and
either reattach or duplicate it onto another sheet of film
[8]. This is an irreversible physical process that is labor
intensive and expensive. However, it does solve the problem
because the flattened emulsion layer, which contains the
photographic information, becomes distortion free with a
destructive physical separation of the layers [25].
EURASIP Journal on Image and Video Processing 3
The print (or digitization, which is the creation of a
digital image of the emulsion) from a damaged negative is
distorted in two primary ways. First, the damaged acetate
becomes opaque where it has separated from the emulsion.
This introduces attenuation when light passes through the
material. We term this distortion of intensities a photometric
distortion. Second, the dimensional instability causes the
negative to become nonplanar. Since it cannot lay flat its
content is distorted when light is projected through it
onto another surface. This is a geometric distortion which
could be removed if the negatives were somehow made to
lay flat.
2.2. Digital Restoration. In contrast to physical restoration,
we present a tool for the digital restoration of photographic
negatives. While physical restoration is always an option,
there are three key benefits to a noninvasive, purely digital
approach. First, the digital approach creates a digitized
model, which is often the desired goal even when the negative
is not yet damaged. The digital model stores information
content without being subject to further damage. Second,
in contrast to physical restoration, the digital process leaves
the original negative in its current state, meaning that
conservation can continue and no changes are made that
are irreversible. If the results from a digital approach
are not acceptable, the more challenging and expensive
physical approach can still be applied. Third, the approach
can be automated, opening the possibility of streamlined
workflow to capture large collections in their entirety. It is
extremely costly and time-intensive to physically restore a
large collection in its entirety.
The two primary effects resulting from the physical
damage of the photographic negative must be overcome in
order to engineer a process that can restore an image of
the emulsion layer without the need to physically separate
and reseat the emulsion layer. We can model these effects
individually and we describe the essential points in the
following sections.
2.2.1. Photometric. The photographic information is found
in the emulsion layer of the negative. As light passes through
this layer, areas with higher silver halide density absorb more
light. Variations across the layer encode the information that
makes up the “picture.” We designate this information as
“photometric” in the sense that the intensity variations along
the emulsion layer are the crucial photometric property to be
captured. Any damage to this layer or to anything that might
block the ability to correctly record these intensity variations
will cause a photometric distortion. In the case of damaged
acetate, the light is not transmitted at a constant intensity
across the emulsion because the separated acetate attenuates
the light that would otherwise pass through that portion
of the emulsion. The result is an artifact or a photometric
distortion of the emulsion information.
2.2.2. Geometric. The correct, original shape of the emulsion
layer is a plane. Damaged negatives are no longer planar,
which creates a geometric distortion when the negative is
printed using a standard light table. These distortions are
directly related to the nonplanar shape of the negative and are
largely independent of the content of the emulsion. In other
words, a negative that is non-planar but without reduced
transmission will create a print that is photometrically
correct but has content that shows non-linear distortions.
It is important that the photometric and geometric
distortions can be treated separately, leading to a complete
solution framework for digital restoration.
3. Image-Based Modeling of
theNegativeRestoration
For some document types, full three-dimensional recon-
struction is either unnecessary or impractical when attempt-
ing digitization and restoration. Many historical documents
contain wrinkles, creases, and other high-frequency features
either beyond the accuracy of many 3D scanners or requiring
time intensive acquisition procedures. In these cases, a more
appropriate approach is to work in a pixel-by-pixel image-
based acquisition and restoration methodology. This work
develops that methodology by assembling a cost-effective
scanning system comprised of a laptop to emulate a smart
light-table and a camera to observe illumination changes in
the scene.
The area of material model formulation, using image-
based methods, and rendering has been a widely researched
area in computer graphics. Wang et al. [26]produced
a real-time renderer of plant leaves that included global
illumination effects. This work is of particular interest due
to the application of an image-based acquisition technique to
reconstruct the transmissiveness and reflectivity of the leaves.
Devices have been built to acquire the material properties of
various types of documents and other materials. Gardner et
al. [27] introduce a linear light source gantry that obtains
a Bidirectional Reflectance Distribution Function (BRDF)
of an object while providing depth and opacity estimates.
Also, Mudge et al. [28] use a light dome to obtain reflectance
properties of various materials. These works, and many
others, show the possibilities of photorealistic rendering of
acquired objects. However, the purpose of our proposed
work is not to realistically render a material but to restore
a negative to its original form by estimating the material
changes caused by deterioration.
The technique presented here exploits the transmis-
siveness of negatives to obtain a model of the document
that allows complete reconstruction of the intrinsic color,
content, and distorted shape. Also, to reduce the burden of
the system operator, there is minimal calibration required
before scanning can begin unlike many other document
digitization systems mentioned in Section 1.
The transmissive document scanner is designed to
accurately digitize and even restore content that is marred
by damage and age. The photometrically corrected content
is extracted directly during the scanning process while
working in a completely image-based realm. Moreover, the
obtained shape information can be used to restore the
shape of a geometrically warped surface with restoration
4 EURASIP Journal on Image and Video Processing
Specular transmission
Diffuse transmission
Single-scatter
diffusion
Point light
source
t
t
Observed
intensity
Figure 3: Diffuse single-scatter transmission of a back-lit light
source.
procedures described in Section 4.3.2. Consequently, image-
based techniques provide a direct way to generate restored
images without requiring metric reconstructions that add to
overall system complexity.
3.1. Physical Model. The solution presented here works
on the premise that the composition of most document
substrates is composed of numerous nonuniformly aligned
homogeneous elements. Consequently, the typical compo-
sition of document substrates follows a highly isotropic
scattering of transmitted light. The silver halide grains of the
emulsion layer in a photonegative, by design, create a diffuse
transmission of light.
The scanning method presented here will focus on
diffuse transmission. For a single-layer document, the diffuse
transmission of light can be approximated as a single-scatter
diffusion. Chandresakar [29] provides an approximation of
the single-scattering that occurs in diffuse transmission as
L
t
= L
i
e
−τ/cos θ
t
+
1
4π
φ
0
L
i
cos θ
i
cos θ
t
+cosθ
i
e
−τ/cos θ
t
−e
−τ/ cos θ
i
,
(1)
where θ
i
is the angle between the surface normal and incident
light, θ
t
is the angle between outgoing light and the surface
normal, φ
0
is the phase function, L
i
is the incident light
intensity, and τ is the material thickness.
The single-scatter transmission has been well studied
in the area of computer graphics. Frisvad et al. [30]use
Chandrasekhar’s work to create an efficient rendering system
for thin semitransparent objects. Moreover, the area of
plant/leaf rendering has been thoroughly studied [26, 31, 32]
with respect to single-scatter transmission. In a more recent
work, Gu et al. [33] model and render a thin layer of
distortions caused by dirt on a surface using fully acquired
BRDF and Bidirectional Transmission Distribution Function
(BTDF) functions.
Figure 3 shows a particular case where a light source is
translated approximately parallel to semiplanar object. For a
single-pixel observation, as the light translates, the intensity
follows a cosine-like response where the light is incident
at an angle parallel to the surface normal. The incoming
illumination angle can be calculated as cos θ
i
= ω
i
· n
where ω
i
is the incident light direction and n is the outward
surface normal. Moreover, in the case of diffuse transmission,
an assumption can be made that the greatest transmitted
intensity will occur when ω
i
n. Therefore, for the purpose
of this work, cos θ
i
will be approximated as 1.
For diffuse materials, it is safe to model the material as
a translucent material with a highly diffuse transmission of
light. Therefore, the phase function can be modeled with
isotropic scattering; thus φ
0
becomes a constant 1. The
direct transmission can be safely ignored for highly diffuse
materials, and so single-scattering becomes the only factor in
light transmission through the material. Considering these
assumptions, 1 can be approximated as
L
t
=
1
4π
L
i
1
cos θ
t
+1
e
−τ/cos θ
t
−e
−τ
,(2)
where cos θ
t
is the only varying quantity across the surface
while τ and L
i
remain constant.
The intensity increase generated when the incident light
angle, ω
i
, becomes parallel with the surface normal n will be
used to estimate the shape of the document surface. However,
for documents that are mostly specular transmissive, directly
transmit light, surface normal no longer plays a large role
in the intensity of transmitted light. Therefore, the following
scanning process only works well for documents that exhibit
diffuse transmission.
This diffuse transmission can be modeled with the BTDF:
f
t
(
ω
i
, ω
t
)
=
L
t
(
ω
t
)
L
i
(
ω
i
)
cos θ
i
dω
i
,(3)
where ω
i
is the incident light direction, ω
t
is the transmitted
light direction, L
i
(ω
i
) is the quantity of light arrive from ω
i
,
L
t
(ω
t
) is the quantity of light transmitted along ω
t
,anddω
i
is the differential solid angle. When two BTDFs are estimated
and at least one property remains constant between them, a
direct comparison can then be made between two distinct
scenes. In this case, the incident light maintains constant
flux since the sweeping illuminant repeats with the same
properties in both scenes:
L
t
(
ω
t
)
f
t
(
ω
i
, ω
t
)
cos θ
i
dω
i
=
L
t
(
ω
t
)
f
t
ω
i
, ω
t
cos θ
i
dω
i
.
(4)
Therefore, we now have two disparate cases that are modeled
by the BTDF for each small region imaged by a camera pixel.
f
t
(ω
i
, ω
t
) represents the trivial case when no media exists
between the illuminant and sensor. Using a delta function,
we can assume f
t
= 1 when ω
i
= ω
t
and cos θ
i
= 1which
leaves the relationship as
L
t
(
ω
t
)
=
L
t
(
ω
t
)
f
t
ω
i
, ω
t
cos θ
i
dω
i
dω
i
,
(5)
which gives an accurate way to estimate the transmission of
light through a scene without direct measurement.
EURASIP Journal on Image and Video Processing 5
Figure 4: An example scanner configuration.
4. Image-Based Document Scanner
By exploiting the transmissive nature of most document
materials, the new image-based acquisition technique pre-
sented here provides the direct ability to digitize and restore
multilayer photographic negatives. The design of this scanner
hinges on the premise that all necessary information in a
document can be obtained through rear-illumination of the
substrate with visible light.
Additionally, the system requires minimal calibration
in the scanning procedure. Many document digitization
systems already mentioned in this work require calibration
of both the imaging device(s) and illumination source(s).
However, this adds to the complexity of operation and may
reduce the number of personnel capable of performing a
scan. The scanner presented here works in a completely
image-based domain, with operations performed on local
pixels eliminating the need for global registration or calibra-
tion. The scanning is configured by placing a camera above a
flat-panel computer monitor as seen in Figure 4.
The data acquired with the image-based scanner allows
the optical properties of the negative layers to be decoupled
by rear-illuminating the object with time-evolving Gaussian
stripes. Two stripes are displayed: a vertical Gaussian stripe
given by
G
(
x; x
0
, σ
x
)
= ke
−(x−x
0
)
2
/2σ
2
x
(6)
and a horizontal Gaussian stripe given by
G
y; y
0
, σ
y
=
ke
−(y−y
0
)
2
/2σ
2
y
,(7)
where x
0
and y
0
are the means (X
0
), σ
x
and σ
y
are the
variance (σ), and k represents the color depth of the display
device.
The acquisition system observes two passes of the
horizontal and vertical Gaussian stripes. The initial pass is
captured with only the display device in the scene to acquire
a base case for the Gaussian parameters σ and X
0
.Thenext
pass of the stripes is captured with the document in the scene
as shown in Figure 4. After the acquisition of four sweeps,
calculations are performed on a pixel-by-pixel basis using
Acquire base HDR Gaussian stripes
Add document
Acquire HDR Gaussian stripes
Perform nonlinear
Gaussian fitting
D ΔX
0
Density map Distortion map
8-bit conversion
Surface
reconstruction
Virtual flattening
Restored document
Polygon mesh
Te x t u r e m a p
Figure 5: The scanning process.
the time-evolving Gaussian stripes observed for each one
(Figure 5). For each pixel, the intensity values are normalized
to one, and the scale factor, the Gaussian amplitude α,is
saved as the attenuation factor for that pixel. Then a non-
linear Gaussian fit is performed on the normalized intensity
values to estimate σ and X
0
. This gives two 2D Gaussian
functions for each pixel:
G
x, y : x
0
, y
0
, σ
x
, σ
y
=
e
((x−x
0
)
2
+(y−y
0
)
2
)/(σ
x
+σ
y
)
2
,(8)
G
x, y : x
0
, y
0
, σ
x
, σ
y
=
e
((x−x
0
)
2
+(y−y
0
)
2
)/(σ
x
+σ
y
)
2
. (9)
The optically distorted Gaussian properties σ
x
, σ
y
, x
0
,and
y
0
are given by (9). The difference between the Gaussian
parameters in (8)and(9) gives an estimation of the optical
changes due to the object in the scene.
By inspecting the variations in these parameters one-by-
one, it is possible to estimate three unique optical properties
from the negative:
(i) amplitude (α
→ α
): attenuation,
(ii) mean (X
0
→ X
0
): surface normal,
(iii) variance (σ
→ σ
): density.
However, since the parameters rely on the transmission of the
light through large variations in media, the limited dynamic
range of the imaging device greatly effects the non-linear
fitting.
4.1. Dynamic Range Considerations. When digital cameras
image a scene by taking a digital photograph, an analog-
to-digital conversion takes place. The main technological
element in this process is a charge coupled device (CCD).
The CCD measures the irradiance, E, for the duration of
exposure time (Δt
e
) when an image is captured. However,
limited dynamic range of the CCD and quantization in
the Analog/Digital conversion often lead to data loss that
typically appears as saturation.
6 EURASIP Journal on Image and Video Processing
0
50
100
150
200
250
Intensity values
−15 −10 −50 51015
(a) Shows the time-evolving intensity profile of 5 expo-
sures for a single camera pixel using normal 8-bit images
Shutter speed
87.5ms
137.5ms
187.5ms
237.5ms
287.5ms
(b) 87.5 ms shutter speed, the left shows
illumination without document and the right
shows illumination with document in scene
(c) 287.5 ms shutter speed, the left shows
illumination without document and the right
shows illumination with document in scene
3
4
5
6
7
8
Radiance values
−15 −10 −50 51015
(d) The resultant Gaussian profile
in radiance values
Figure 6: The intermediate steps in calculating High Dynamic Range Imaging (HDRI).
Asingleimagecapturedfromthecamera,asseen
in Figure 6(c), shows the loss of information due to the
dynamic range compression. The radiance values at the
peak of the Gaussian stripes are all mapped to the same
intensity values by the imaging device which greatly reduces
the accuracy of Gaussian fitting algorithms. The intensity
profile for one pixel at varying exposure rates is shown in
Figure 6(a). In this example, all but the fastest shutter speed
suffers from data loss. However, to solely use this exposure
rate would also be insufficient since there would be data
loss for areas with less transmitted light such as when the
document is in place which is shown in Figure 6(b).
To compensate for this loss of data, High-Dynamic Range
Imaging (HDRI) techniques have been developed. Debevec
and Malik [34] extended previous work by acquiring multi-
ple images of the same scene under varying exposure rates.
Then the response function for a scene is directly calculated
using representative pixels under varying exposures. Once
the response function is computed, the set of images can be
combined into a floating point radiance map representative
of the true radiance in the scene.
The response function is estimated by choosing a single
representative pixel that demonstrates a large dynamic range
in the scene. Then the image response curve is defined by
(10):
g
I
(x,e)
=
ln E
x
+lnΔt
e
.
(10)
While many digital imaging devices provide response curve
customization in hardware, we developed this system to
accommodate a wide range of image devices.
4.2. Acquiring Document Content. Correcting photometric
distortion in imaged documents that contain folds, creases,
and other distortions have previously been addressed [6,
35, 36]. In particular, we have developed two different
techniques to reduce these photometric distortions of stan-
dard paper documents [3, 4]. However, a more complex
model must be used to correct photometric distortion of
transparent documents.
The photometric content of the emulsion layer in a
photonegative is encoded directly by the relative densities of
the silver halide grains. When viewing a planar photonegative
under rear-illumination, the resultant image is produced by
varying amounts transmitted light due to absorption caused
by density variations in the emulsion layer. Reflected light
from the base layer can be considered constant which leaves
absorption and transmission as the only spatially varying
variables when imaging a negative. However, when viewing
a negative with a deteriorating base layer, the light transport
becomesmuchmorecomplex.
Reflected light now introduces multiple reductions in
the transmitted light due to the non-uniform shape of the
base layer and separations, or channels, that form between
the emulsion and acetate layers. Typically, the amplitude of
transmitted light, α
, would be used in a ratio to calculate
the attenuation of transmitted light α
/α.However,α
contains error introduced by the acetate layer of the negative.
Therefore, another method must be used to extract the
density information of only the emulsion layer. We choose a
method that factors out the measured intensities and instead
uses the change in differential area of radiant exitance to
estimate the emulsion density.
The variance of the time-varying Gaussian stripes for
each pixel provides a direct method to calculate the dif-
ferential area on the display device that contributes to the
illumination of the document for each pixel in the imaging
device. If we consider the variance, σ, for both x and y
Gaussian profiles, this effectively creates an elliptical region
EURASIP Journal on Image and Video Processing 7
n
d
d
dA
dA
Figure 7: The differential areas of radiance estimated by the
variances of both time-varying Gaussians shown on the display
surface.
on the display surface as shown in Figure 7. Once both scans
are performed, we are left with two ellipses for each imaged
pixel: the base contribution (dA
= πσ
x
σ
y
) and the negative
contribution (dA
= πσ
x
σ
y
). The differential solid angle dω
can be calculated directly from the differential area using
dω
= dAcos θ/d
2
. This can be plugged directly into (5)
which gives
L
t
(
ω
t
)
L
t
(
ω
t
)
f
t
ω
i
, ω
t
dA
dA
.
(11)
Both values of cos θ
equal 1 since ω
i
, the direction of the
solid angle, is parallel to the surface normal as discussed in
Section 3.1. Also, as will be discussed in Section 4.3, d and
d
, the distance between the surface area and the illuminant,
are unknown quantities in the image-based implementation,
so for estimation d
d
.
Next, to estimate the density D, L
t
will be scaled by
the measured amplitude of the light transmitted through
the negative. By normalizing each pixel transmission by the
measured amplitude, we effectively reduce the contribution
that the various forms of reflection play in the imaged
density. It should also be noted that f
t
(ω
i
, ω
t
) approaches
1 when the transmission is at its maximum. Therefore,
D
L
t
(
ω
t
)
dA
dA
(12)
is used to reconstruct the photometric content from the
emulsion layer. This change in the differential area provides
key information in how the transmissivity of the scene
has changed when adding the negative and keeping the
illumination constant. While we hold to the photographic
term density for the reduced transmission induced by the
negative, physics and graphics literature typically uses the
term absorption synonymously.
We w oul d exp ec t dA > dA
since any additional media
in the light path should introduce some form of attenuation.
When dA
dA
, this suggests that there is a much higher
opacity due to increased density in the emulsion layer.
Consequently, when dA
dA
, it can safely be assumed that
the pixel contains relatively little information.
Once we acquire the result of (12) for each pixel, we can
obtain the density map D
(u,v)
. The density map is acquired
in floating point values; so a conversion step must take place
n
θ
d
ΔX
0
Figure 8: Diffuse Transmission of a back-lit light source where
the known-quantity ΔX
0
is used to estimate the surface normal
n (dashed line shows observed illumination when negative is not
present).
to generate a standard 8-bit greyscale or 32-bit color image
using the following:
I
(
u, v
)
=
D
(u,v)
+ t
s
, (13)
where t is an intensity translation and s is a scale factor. The
values for s and t are determined empirically.
4.3. Distortion Shape Estimation. Continuing the discussion
from Section 4.3.2, the diffuse transmission of light can be
used to directly estimate the surface orientation for each pixel
observation on the document surface. Moreover, for non-
planar documents relative variations in surface orientation
provide a direct method to estimate local surface shape
variations.
The change between the base position of the Gaussian
stripe and the modified position provides a basic light-
transport model for one or more layered documents. As
the time-evolving Gaussian stripe moves across the display
device, the observed transmitted intensities will also vary
depending on the single-scatter diffusion given in (1). The
shifts of the Gaussian peak, given by (Δx
0
, Δy
0
), are the pixel-
wise orientations used to estimate the orientation of the
surface for x and y directions:
θ
x
= arcsine
Δx
0
d
x
, θ
y
= arcsine
Δy
0
d
y
.
(14)
However, (14) has the unknown quantities d
x
and d
y
since
the surface depth remains unknown as shown in Figure 8.
Therefore, for estimation purposes the mean values of both
(Δx
0
and Δy
0
)areusedford
x
and d
y
;so(14)becomes
θ
x
arcsine
⎛
⎝
Δx
0
Δx
0
⎞
⎠
, θ
y
arcsine
⎛
⎝
Δy
0
Δy
0
⎞
⎠
.
(15)
8 EURASIP Journal on Image and Video Processing
To estimate the surface normal, the orientation angles are
used in
n;
θ
x
, θ
y
,1
T
. (16)
The normal vector is typically accessed as a unit surface
normal where
(n
2
x
+ n
2
y
+ n
2
z
) = 1. Then the surface normal
can be defined as
n
θ
x
, θ
y
,1
T
θ
2
x
+ θ
2
y
+1
.
(17)
It should be noted that the sign of these normal angles may
be globally ambiguous. Similar to the bas-relief ambiguity
in shape-from-shading [37], the surface function may be the
inverted version of the correct surface.
4.3.1. Surface Reconstruction. Once the surface normals are
estimated for each pixel, it is straightforward to calculate
the surface gradient at these positions. The surface gradient
is defined as ∂z/∂x
θ
x
/
θ
2
x
+ θ
2
y
+1 in x and ∂z/∂y
θ
y
/
θ
2
y
+ θ
2
y
+1 in y. With known surface gradients, an
integrable surface reconstruction, introduced by Frankot and
Chellappa [38], can be calculated. Examples of these surfaces
are shown in Figures 15(e) and 16(e).
4.3.2. Correcting the Geometric Distortion. By acquiring a 3D
map of the emulsion layer, registered to a 2D image of the
emulsion density, we are able to apply a digital flattening
technique we have developed for other applications [2, 7, 39].
This digital flattening is based on a particle system model
of the substrate material (originally the substrate was paper
on which text is written). The model can be relaxed to
assume the shape of a plane, subject to physical modeling
constraints on the particles of the model. By enforcing
rigidity constraints we can simulate the resulting distortions
that come from pushing the non-planar model to a plane.
We have shown that this technique can be very accurate
at removing depth distortions for page images when the
starting 3D model is faithfully acquired.
5. Error
In this work, two major sources of error are encountered.
First, the perspective projection of the imaging device adds
low-frequency error in X
0
. Second, the dynamic range con-
straints of the imaging device greatly reduced the accuracy of
the Gaussian stripe detection.
5.1. Perspective Projection Correction. A global error is intro-
duced into the normal map due to the prospective projection
of the imaging system. As the distance from the camera’s
optical center increases, the angle of incidence on the surface
also increases. This creates a systematic shift across the
normal map that increases toward the edges of the image. An
example of this error when performing a synthetic scan on a
plane is shown in Figure 9(d).
(a) The synthetic light table (b) The scanning environ-
ment with the plane in place
(c) The plane on the fully
illuminated light table
(d) The surface gradients for
the plane where lighter inten-
sity shows larger difference in
X
0
values
Figure 9: A synthetic scan of a planar object.
To compensate for this error, it is possible to take
advantage of the frequency domain where the error occurs.
Since the error presents itself as very low-frequency noise, a
Gaussian bandpass frequency filter, H(u,v), is applied to the
Fourier transform of surface normal components in both the
X(u, v)andY(u, v) directions.
Once the filter is generated, the surface normals may
be filtered using X
(u, v) = X(u, v)H(u, v)andY
(u, v) =
Y(u, v)H(u, v). These processed values are then reduced
of the error induced by perspective imaging. Therefore,
the surface estimation more accurately portrays the actual
document shape configuration.
5.2. Error Analysis. To study the accuracy of the scanning
system and investigate sources of error, synthetic scans were
performed virtually. Utilizing Autodesk 3D Studio Max,
environments, closely matching the real-world scanning
compositions, were developed to test various aspects of the
system.
5.2.1. Synthetic Plane. The first test of the proposed scanning
procedure was built using a plane with textured animation
that played the sweeping stripe in both directions and
a semitransparent plane with a checkerboard texture as
seen in Figure 9(c). This test provided the groundwork
for estimating the feasibility of the scanner. The pla-
nar test demonstrated the noise introduced by the per-
spective projection of the imaging device. This can be
seen by the surface gradients acquired for the plane in
Figure 9(d).
To correct the low-frequency noise, the band-pass fre-
quency filters are applied to the surface normal estimations
(Δx
0
, Δy
0
). Figure 10 shows that the resultant surface as the
low-frequency band-pass is increased.
EURASIP Journal on Image and Video Processing 9
Figure 10: Estimated surface shape with decreasing low-frequency
band-pass.
(a) Synthetic illumi-
nation device
(b) Synthetic scan
with sphere in place
(c) Side view of the
spherical object
Figure 11: A synthetic scan of a hemisphere developed in Autodesk
3D Studio Max.
5.2.2. Synthe tic Sphere. Next a semitransparent check-
ered hemisphere was synthetically scanned. This polygonal
hemisphere was placed on the rear-illumination source,
Figure 11(a), while a camera observed each of the light stripe
positions as seen in Figure 11(b). This scan was performed
with 600 stripe positions in both the x and y orientations
using a virtual camera with 640
×480 resolution. Then, once
both Δσ and ΔX
0
are estimated, the surface is reconstructed
using the method described in Section 4.3.1 as shown in
Figure 12(b).
To test the accuracy of the scanning and surface recon-
struction, the difference between the actual sphere surface
and the estimated surface is shown in Figure 12(c).Overall,
the results were acceptable for an image-based device.
6. Results
Once the estimation of the synthetic results was satisfactorily
obtained, the physical scanner was built using a Windows
XP-based 1.6 GHz Pentium M Laptop with a 15
LCD
running at 1024
× 768 resolution and a 640 × 480 FireWire
greyscale camera obtaining the scan images. By keeping
minimal hardware requirements, we hope to make the
scanner available to the largest amount of users possible.
The scan itself consists of displaying 650 vertical stripes
and 400 horizontal stripes for both the base and scanning
steps. For each stripe position, 7 images are acquired with
decreasing exposure speeds which require 7350 images for
each scan. The initial scans took roughly 0.5 second per
image capture; so the entire scan took approximately 1 hour.
Also, performing the non-linear Gaussian estimation for
each pixel required a total of 30 minutes.
The first result of restoring a photographic negative is
performed on a recording of a monument. Figure 13(a)
shows how the separation between the layers creates channel-
ing with nonuniform transmission of light when the negative
is imaged in the normal process. The photometrically
corrected negative is shown in Figure 13(d). The surface
−50
0
50
100
150
200
250
300
y
0 50 100 150 200 250 300 350
x
(a) Synthetic sphere depth map
−50
0
50
100
150
200
250
300
y
0 50 100 150 200 250 300 350
x
(b) Reconstructed sphere depth map
−50
0
50
100
150
200
250
300
y
0 50 100 150 200 250 300 350
x
40
35
30
25
20
15
10
5
(c) Absolute difference of depth maps
(d) Estimated sphere shape
Figure 12: The analysis of a hemisphere developed in Autodesk 3D
Studio Max.
10 EURASIP Journal on Image and Video Processing
(a) The imaged back-lit film (b) The inverted negative
(c) The estimated surface gradi-
ents
(d) The photometrically corrected
image (density map)
Figure 13:AscanofthenegativeshowninFigure 2:anexample
photographic recording of a tombstone.
(a) The original deteriorated film
negative
(b) The original deteriorated film
positive
(c) The surface gradient magni-
tudes
(d) The density map
Figure 14: An architectural photographic record from Lexington,
Kentucky, USA.
orientations are shown in Figure 13(c).Ascanbeseenby
these images, the acquisition process effectively decouples
the photographic content from the shape information while
excluding attenuation effects caused by the layer separations.
The next example is an architectural recording of a home.
Figure 14(b) shows the positive image of the photograph
with obvious distortions in photometry and geometry. The
photometrically corrected version of the negative is shown
in Figure 14(d) and the surface orientations are shown in
Figure 14(c).
The third example shows another architectural record-
ing. Again, this negative suffers from the same severe
deterioration that is common in acetate film. Figure 15(a)
(a) Original negative image (b) Original positive image
(c) The surface gradient magni-
tudes
(d) The density map
(e) Estimated surface for Figure 15 (f) The negative with both pho-
tometric and geometric error cor-
rected
Figure 15: Another architectural photographic record from Lexing-
ton, Kentucky, USA.
shows the negative acquired with a standard scanning
process. The shape information is shown in Figure 15(c) and
the content is shown in Figure 15(d). While some areas of
the photometric content are restored, there are some areas
where the acquisition method failed to accurately capture
the negative. We believe that this is mainly due to the
low resolution scanning performed on these initial results.
Figure 15(e) shows the estimated surface. This geometry
is then used for virtual flattening to correct dimensional
warping with the result shown in Figure 15(f).
Figure 17(a) shows a closeup of a warped area of the
negative from Figure 14.InFigure 17(a),acrackinthe
emulsion layer is marked in solid white. This area contains
some information loss where the material has chipped away,
but much of the content remains. It can be seen through
the geometric flattening process shown in Figure 17(b) that
both sides of the crack are brought back together during
restoration. Also, a close-up of Figure 15 shows the resultant
geometrically flattened negative in Figure 17(d) with a side-
by-side comparison on the unflattened photo (Figure 17(c)).
EURASIP Journal on Image and Video Processing 11
(a) Original negative image (b) Original positive image
(c) The surface gradient magni-
tudes
(d) The density map
(e) Estimated surface (f) Estimated surface with texture
(g) The difference between the orig-
inal photometric contented and the
photometric correction
Figure 16: Another architectural photographic record from Lexing-
ton, Kentucky, USA.
Figure 16 shows the photograph of a farm. Notice the
large photometric distortions caused by the large areas of
separation between the acetate and emulsion layers in the
negative. The is observable in the shape information; see
Figures 16(c), 16(e),and16(f). For clarity, the difference
between the the original and photometrically corrected
image is shown in Figure 16(g).
7. Future Work
This work will be extended by developing a comprehensive
ground-truth analysis suite to provide a metric for the overall
restoration accuracy of the system. Moreover, we plan to
perform a digital restoration on a deteriorated photonegative
and then perform a physical restoration on the negative to
provide an accurate ground-truth comparison Also, future
work will use more complex structured-light patterns to
greatly decrease the acquisition time.
Moreover, increasing both the display and imaging
resolution will achieve higher accuracy results. In some
initial tests using a higher-resolution camera (2.5 MP) and
(a) A close-up of the negative in
Figure 14(b)
(b) The flattened result
(c) A close-up of the negative in
Figure 15(d)
(d) The flattened result
Figure 17: The geometric correction of negatives from Figure 14
and Figure 15.
higher-resolution display (0.8 MP) we were able to generate
promising results. Figure 18 shows theses higher-resolution
test results. We are convinced by the similarity in texture
between Figures 18(b) and 18(e) that these increases in
resolution will only improve our results.
Also, we are currently looking into providing ground-
truth comparisons by having physical restoration performed
on the virtually-restored negatives presented here.
8. Conclusion
In this work, we have demonstrated a cost-effective and
fully automatic acquisition system that acquires shape and
content information separately for photographic negatives.
Using single-scatter diffuse transmission as the basis for the
document scanning system, successful results are shown.
These complex documents can now be scanned and restored
virtually. This presents the first known virtual restoration
method for safety negatives.
12 EURASIP Journal on Image and Video Processing
(a) Zoom in of the
distorted region
(b) Photometrically
correct region
(c) Acquired shape
information
(d) Photographic negative with the region the
high-resolution scan marked
(e) An undistorted region from
the original negative showing
similar content (a tree trunk)
Figure 18: A high-resolution scan of a portion of the negative from Figure 14.
Acknowledgments
The authors would like to thank the University of Kentucky
Libraries Special Collections and Digital Programs for access
to the acetate safety negatives. They would also like to thank
the reviewers for their detailed and constructive comments.
References
[1] L. Zhang, Y. Zhang, and C. Tan, “An improved physically-
based method for geometric restoration of distorted doc-
ument images,” IEEE Transactions on Pattern Analysis and
Machine Intelligence, vol. 30, no. 4, pp. 728–734, 2008.
[2] M. S. Brown and W. B. Seales, “Image restoration of arbitrarily
warped documents,” IEEE Transactions on Pattern Analysis and
Machine Intelligence, vol. 26, no. 10, pp. 1295–1306, 2004.
[3] G. V. Landon, Y. Lin, and W. B. Seales, “Towards automatic
photometric correction of casually illuminated documents,”
in Proceedings of the IEEE Computer Socie ty Conference on
Computer Vision and Pattern Recognition (CVPR ’07),pp.1–
8, Minneapolis, Minn, USA, June 2007.
[4] M. Sun, R. Yang, L. Yun, G. Landon, B. Seales, and M. S.
Brown, “Geometric and photometric restoration of distorted
documents,” in Proceedings of the 10th IEEE International
Conference on Computer Vision (ICCV ’05), vol. 2, pp. 1117–
1123, October 2005.
[5] H. Cao, X. Ding, and C. Liu, “A cylindrical surface model to
rectify the bound document image,” in Proceedings of the 9th
IEEE International Conference on Computer Vision (ICCV ’03),
vol. 1, pp. 228–233, 2003.
[6] M. S. Brown and Y C. Tsoi, “Geometric and shading correc-
tion for images of printed materials using boundary,” IEEE
Transactions on Image Processing, vol. 15, no. 6, pp. 1544–1554,
2006.
[7] W. B. Seales and Y. Lin, “Digital restoration using volumetric
scanning,” in Proceedings of the 4th ACM/IEEE-CS Joint
Conference on Digital Libraries (JCDL ’04), pp. 117–124, ACM,
Tucson, Ariz, USA, June 2004.
[8] D. G. Horvath, The Acetate Negative Survey: Final Report,
The University of Louisville, Ekstrom Library, Photographic
Archives, Louisville, Ky, USA, 1987.
[9] M. Bertalmio, G. Sapiro, V. Caselles, and C. Ballester,
“Image inpainting,” in Proceedings of the ACM Interna-
tional Conference on Computer Graphics and Interactive Tech-
niques (SIGGRAPH ’00), K. Akeley, Ed., pp. 417–424, ACM
Press/Addison-Wesley Longman, July 2000.
[10] M. Bertalmio, L. Vese, and G. S. S. Osher, “Simultaneous
structure and texture image inpainting,” in Proceedings of the
IEEE Computer Society Conference on Computer Vision and
Pattern Recognition (CVPR ’03), vol. 2, pp. 707–712, June 2003.
EURASIP Journal on Image and Video Processing 13
[11] A. Criminisi, P. P
´
erez, and K. Toyama, “Region filling and
object removal by exemplar-based image inpainting,” IEEE
Transactions on Image Processing, vol. 13, no. 9, pp. 1200–1212,
2004.
[12] S. Roth and M. J. Black, “Fields of experts: a framework for
learning image priors,” in Proceedings of the IEEE Computer
Society Conference on Computer Vision and Pattern Recognition
(CVPR ’05), vol. 2, pp. 860–867, IEEE Computer Society, San
Diego, Calif, USA, June 2005.
[13] E. Ardizzone, H. Dindo, U. Maniscalco, and G. Mazzola,
“Damages of digitized historical images as objects for content
based applications,” in Proceedings of the 14th European Signal
Processing Conference (EUSIPCO ’06), EURASIP, Florence,
Italy, September 2006.
[14] V. Bruni, A. Crawford, A. C. Kokaram, and D. Vitulano,
“Digital removal of blotches with variable semitransparency
using visibility laws,” in Proceedings of the 2nd International
Symposium on Advances in Brain, Vision, and Artificial Intelli-
gence (BVAI ’07), pp. 254–263, Naples, Italy, October 2007.
[15] R. Szeliski, S. Avidan, and P. Anandan, “Layer extraction from
multiple images containing reflections and transparency,”
in Proceedings of the IEEE Computer Socie ty Conference on
Computer Vision and Pattern Recognition (CVPR ’00), vol. 1,
pp. 246–253, 2000.
[16] F. Stanco, G. Ramponi, and A. de Polo, “Towards the
automated restoration of old photographic prints: a survey,”
in Proceedings of the IEEE Region 8 Computer as a Tool
(EUROCON ’03), vol. 2, pp. 370–374, September 2003.
[17] R. Pintus, T. Malzbender, O. Wang, R. Bergman, H. Nachlieli,
and G. Ruckenstein, “Photo repair and 3D structure from
flatbed scanners,” in Proceedings of the 4th International Con-
ference on Computer Vision Theory and Applications (VISAPP
’09), vol. 1, pp. 40–50, Lisboa, Portugal, February 2009.
[18] F. Stanco, L. Tenze, G. Ramponi, and A. de Polo, “Virtual
restoration of fragmented glass plate photographs,” in Proceed-
ings of the 12th IEEE Mediterranean Electrotechnical Conference
(MELECON ’04), vol. 1, pp. 243–246, Dubrovnik, Yugoslavia,
May 2004.
[19] M. Ben-Ezra and S. K. Nayar, “What does motion reveal about
transparency?” in Proceedings of the 9th IEEE International
Conference on Computer Vision (ICCV ’03), vol. 2, pp. 1025–
1032, Nice, France, October 2003.
[20] N. J. W. Morris and K. N. Kutulakos, “Reconstructing the
surface of inhomogeneous transparent scenes by scatter-trace
photography,” in Proceedings of the 11th IEEE International
Conference on Computer Vision (ICCV ’07), pp. 1–8, October
2007.
[21] G. Eren, O. Aubreton, F. Meriaudeau, et al., “Scanning from
heating: 3D shape estimation of transparent objects from local
surface heating,” Optics Express, vol. 17, no. 14, pp. 11457–
11468, 2009.
[22] D. E. Zongker, D. M. Werner, B. Curless, and D. H. Salesin,
“Environment matting and compositing,” in Proceedings of the
26th Annual Conference on Computer Graphics and Interactive
Techniques, pp. 205–214, ACM Press/Addison-Wesley, New
York, NY, USA, 1999.
[23] Y Y. Chuang, D. E. Zongker, J. Hindorff, B. Curless, D. H.
Salesin, and R. Szeliski, “Environment matting extensions:
towards higher accuracy and realtime capture,” in Proceedings
of the 27th Annual Conference on Computer Graphics and
Interactive Techniques, pp. 121–130, ACM Press/Addison-
Wesley, New York, NY, USA, 2000.
[24] G. V. Landon, W. B. Seales, and D. Clarke, “A new system
to acquire and restore document shape and content,” in
Proceedings of the 5th ACM/IEEE International Workshop on
Projector Camera Systems (PROCAMS ’08), pp. 1–8, ACM,
Marina del Rey, Calif, USA, August 2008.
[25] Chicago Albumen Works, />Detacetatefilms.html.
[26] L. Wang, W. Wang, J. Dorsey, X. Yang, B. Guo, and H Y. Shum,
“Real-time rendering of plant leaves,” in Proceedings of the
International Conference on Computer Graphics and Interactive
Techniques (SIGGRAPH ’06),p.5,ACM,Boston,Mass,USA,
July-August 2006.
[27] A. Gardner, C. Tchou, T. Hawkins, and P. Debevec, “Linear
light source reflectometry,” ACM Transactions on Graphics, vol.
22, no. 3, pp. 749–758, 2003.
[28] M. Mudge, J P. Voutaz, C. Schroer, and M. Lum, “Reflection
transformation imaging and virtual representations of coins
from the hospice of the grand st. bernard,” in Proceedings of the
6th International Sy mposium on Virtual Reality, Archaeology
and Cultural Heritage (VAST ’05), pp. 29–39, 2005.
[29] S. Chandrasekhar, Radiative Transfer,Dover,NewYork,NY,
USA, 1960.
[30] J. R. Frisvad, N. J. Christensen, and P. Falster, “Efficient light
scattering through thin semi-transparent objects,” in Proceed-
ings of the 3rd International Conference on Computer Graphics
and Interactive Techniques in Australasia and Southeast Asia
(GRAPHITE ’05), pp. 135–138, ACM, Dunedin, New Zealand,
November-December 2005.
[31] Y. M. Govaerts, S. Jacquemoud, M. M. Verstraete, and S. L.
Ustin, “Three-dimensional radiation transfermodeling in a
dicotyledon leaf,” Applied Opt ics, vol. 35, pp. 6585–6598, 1996.
[32] B. D. Ganapol, L. F. Johnson, P. D. Hammer, C. A. Hlavka,
and D. L. Peterson, “LEAFMOD: a new within-leaf radiative
transfer model,” Remote Sensing of Environment,vol.63,no.2,
pp. 182–193, 1998.
[33] J. Gu, R. Ramamoorthi, P. Belhumeur, and S. Nayar, “Dirty
glass: rendering contamination on transparent surfaces,” in
Proceedings of the 18th Eurographics Workshop on Rendering
Techniques, pp. 159–170, June 2007.
[34] P. E. Debevec and J. Malik, “Recovering high dynamic range
radiancemaps from photographs,” in Proceedings of the 24th
Annual Conference on Computer Graphics and Interactive
Techniques, pp. 369–378, August 1997.
[35] T. Wada, H. Ukida, and T. Matsuyama, “Shape from shading
with interreflections under a proximal light source: distortion-
free copying of an unfolded book,” International Journal of
Computer Vision, vol. 24, no. 2, pp. 125–135, 1997.
[36] E. Prados, F. Camilli, and O. Faugeras, “A unifying and
rigorous shape from shading method adapted to realistic data
and applications,” Journal of Mathematical Imaging and Vision,
vol. 25, no. 3, pp. 307–328, 2006.
[37] P. N. Belhumeur, D. J. Kriegman, and A. L. Yuille, “The bas-
relief ambiguity,” International Journal of Computer Vision, vol.
35, no. 1, pp. 33–44, 1999.
[38] R. T. Frankot and R. Chellappa, “A method for enforcing inte-
grability in shape fromshading algorithms,” IEEE Transactions
on Pattern Analysis and Machine Intelligence, vol. 10, no. 4, pp.
439–451, 1988.
[39] M. S. Brown and W. B. Seales, “Document restoration using
3D shape: a general deskewing algorithm for arbitrarily
warped documents,” in Proceedings of the IEEE International
Conference on Computer Vision (ICCV ’01), vol. 2, pp. 367–
374, 2001.