báo cáo hóa học:" Research Article Optical Music Recognition for Scores Written in White Mensural Notation" docx
Bạn đang xem bản rút gọn của tài liệu. Xem và tải ngay bản đầy đủ của tài liệu tại đây (9.07 MB, 23 trang )
Hindawi Publishing Corporation
EURASIP Journal on Image and Video Processing
Volume 2009, Article ID 843401, 23 pages
doi:10.1155/2009/843401
Research Article
Optical Music Recognition for Scores Written in White
Mensural Notat ion
Lorenzo J. Tard
´
on, Simone Sammar tino, Isabel Barbancho,
Ver
´
onica G
´
omez, and Antonio Oliver
Departamento de Ingenier
´
ıa de Comunicaciones, E.T.S. Ingenier
´
ıa de Telecomunicaci
´
on, Universidad de M
´
alaga,
Campus Universitario de Teatinos s/n, 29071 M
´
alaga, Spain
Correspondence should be addressed to Lorenzo J. Tard
´
on,
Received 30 January 2009; Revised 1 July 2009; Accepted 18 November 2009
Recommended by Anna Tonazzini
An Optical Music Recognition (OMR) system especially adapted for handwritten musical scores of the XVII-th and the early
XVIII-th centuries written in white mensural notation is presented. The system performs a complete sequence of analysis stages:
the input is the RGB image of the score to be analyzed and, after a preprocessing that returns a black and white image with
corrected rotation, the staves are processed to return a score without staff lines; then, a music symbol processing stage isolates the
music symbols contained in the score and, finally, the classification process starts to obtain the transcription in a suitable electronic
format so that it can be stored or played. This work will help to preserve our cultural heritage keeping the musical information of
the scores in a digital format that also gives the possibility to perform and distribute the original music contained in those scores.
Copyright © 2009 Lorenzo J. Tard
´
on et al. This is an open access article distributed under the Creative Commons Attribution
License, which permits unrestricted use, distribution, and reproduction in any medium, provided the original work is properly
cited.
1. Introduction
Optical Music Recognition (OMR) aims to provide a com-
puter with the necessary processing capabilities to convert a
scanned score into an electronic format and even recognize
and understand the contents of the score. OMR is related
to Optical Character Recognition (OCR); however, it shows
several differences based on the typology of the symbols to
be recognized and the structure of the framework [1]. OMR
has been an active research area since the 70s but it is in
the early 90s when the first works for handwritten formats
[2] and ancient music started to be developed [3, 4]. Some
of the most recent works on ancient music recognition are
due to Pugin et al. [5], based on the implementation of
hidden Markov models and adaptive binarization, and to
Caldas Pinto et al. [6], with the development of the project
ROMA (Reconhecimento
´
Optico de M
´
usica Antiga) for the
recognition and restoration of ancient music manuscripts,
directed by the Biblioteca Geral da Universidade de Coimbra.
Of course, a special category of OMR systems deal with
ancient handwritten music scores. OMR applied to ancient
music shows several additional difficulties with respect to
classic OMR [6]. The notation can vary from one author to
anotheroramongdifferent scores of the same artist or even
within the same score. The size, shape, and intensity of the
symbols can change due to the imperfections of handwriting.
In case of later additional interventions on the scores, other
classes of symbols, often with different styles, may appear
superimposed to the original ones. The thickness of the staff
lines is not a constant parameter anymore and the staff lines
are not continuous straight lines in real scores. Moreover,
the original scores get degraded by the effect of age. Finally,
the digitized scores may present additional imperfections:
geometrical distortions, rotations, or even heterogeneous
illumination.
A good review of the stages related to the OMR process
can be found in [7]or[8]. These stages can be described as
follows: correction of the rotation of the image, detection and
processing of staff lines, detection and labeling of musical
objects, and recognition and generation of the electronic
descriptive document.
Working with early scores makes us pay a bit more
attention to the stages related to image preprocessing, to
include specific tasks devoted to obtain good binary images.
2 EURASIP Journal on Image and Video Processing
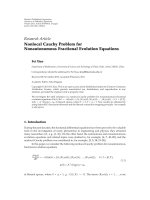
(a) Fragment of a score written in the style of Stephano di Britto
(b) Fragment of a score written in the style of Francisco Sanz
Figure 1: Fragments of scores in white mensural notation showing
the two different notation styles analyzed in this work.
This topic will also be considered in the paper together with
all the stages required and the specific algorithms developed
to get an electronic description of the music in the scores.
The OMR system described in this work is applied to
the processing of handwritten scores preserved in the Archivo
de la Catedral de M
´
alaga (ACM). The ACM was created
at the end of the XV-th century and it contains music
scores from the XV-th to the XX-th centuries. The OMR
system developed will be evaluated on scores written in white
mensural notation. We will distinguish between two different
styles of notation: the style mainly used in the scores by
Stephano di Britto and the style mainly used by Francisco
Sanz (XVII-th century and early XVIII-th century, resp.). So,
the target scores are documents written in rather different
styles (Figure 1): Britto (Figure 1(a)) uses a rigorous style,
with squared notes. Sanz (Figure 1(b)) shows a handwritten
style close to the modern one, with rounded notes and
vertical stems with varying thickness due to the use of a
feather pen. The scores of these two authors, and others
of less importance in the ACM, are characterized by the
presence of frontispieces, located at the beginning of the first
page in Sanz style scores, and at the beginning of each voice
(two voices per page) in Britto style scores. In both cases, the
lyrics (text) of the song are present. The text can be located
above or below the staff, and its presence must be taken into
account during the preprocessing stage.
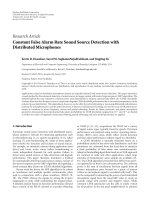
The structure of the paper follows the different stages of
the OMR system implemented, which extends the descrip-
tion shown in [7, 9], a scheme is shown in Figure 2. Thus, the
organization of the paper is the following. Section 2 describes
the image preprocessing stage, which aims to eliminate or
reduce some of the problems related to the coding of the
material and the quality of the acquisition process. The
main steps of the image preprocessing stage are explained in
Digitalized color
image of the score
Selection of the area of interest
&
elimination of unessential elements
RGB to greyscale conversion
&
compensation of illumination
Staff splitting
&
correction of rotation
Staffs
processing
Combination of elements
of the same music symbol
Binarization
Correction of rotation
Preprocessing
OMR
Isolation of staffs
Scaling of score
Blanking of staff lines
Isolation of elements
Extraction of features of music symbols
Training database
Classification
Location of the position of the symbols
Music engraving
Classifier
Processing of
music symbols
k-NN
Mahalanobis distance
Fisher discriminant
Figure 2: Stages of the OMR system.
EURASIP Journal on Image and Video Processing 3
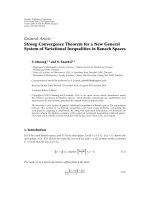
(a) (b)
(c) (d)
Figure 3: Examples of the most common imperfections encountered in digitized images. From (a) to (b): extraneous elements, fungi and
mold darkening the background, unaligned staves and folds, and distorted staves due to the irregular leveling of the sheet.
the successive subsections: selection of the area of interest,
conversion of the color-space, compensation of illumination,
binarization and correction of the image rotation. Section 3
shows the process of detection and blanking the staff lines.
Blanking the staff lines properly appears to be a crucial stage
for the correct extraction of the music symbols. Section 4
presents the method defined to extract complex music
symbols. Finally, the classification of the music symbols is
performed as explained in Section 5. The evaluation of the
OMR system is presented in Section 6. Section 7 describes
the method used to generate a computer representation of
the music content extracted by the OMR system. Finally,
some conclusions are drawn in Section 8.
2. Image Preprocessing
The digital images of the scores to process suffer several types
of degradations that must be considered. On one hand, the
scores have marks and blots that hide the original symbols;
the papers are folded and have light and dark areas; the color
of the ink varies appreciably through a score; the presence
of fungi or mold affects the general condition of the sheet,
an so forth. On the other hand, the digitalization process
itself may add further degradations to the digital image.
These degradations can take the form of strange objects that
appear in the images, or they may also be due to the wrong
alignment of the sheets in the image. Moreover, the irregular
leveling of the pages (a common situation in the thickest
books) often creates illumination problems. Figure 3 shows
some examples of these common imperfections.
A careful preprocessing procedure can significantly
improve the performance of the recognition process. The
preprocessing stage considered in our OMR system includes
the following steps.
(a) selection of the area of interest and elimination of
nonmusical elements,
(b) grayscale conversion and illumination compensation,
(c) image binarization,
(d) correction of image rotation.
These steps are implemented in different stages, applying
the procedures to both the whole image and to parts of
the image to get better results. The following subsections
describe the preprocessing stages implemented.
4 EURASIP Journal on Image and Video Processing
(a) (b)
Figure 4: Example of the selection of the active area. (a) selection of the polygon; (b) results of the rectangular minimal area retrieval.
(a) (b)
Figure 5: Example of blanking unessential red elements. (a) original score. (b) processed image.
2.1. Selection of the Area of Interest and Elimination of
Nonmusical Ele ments. Inordertoreducethecomputational
burden (reducing the total amount of pixels to process) and
to obtain relevant intensity histograms, an initial selection of
the area of interest is done to remove parts of the image that
do not contain the score under analysis. A specific region of
interest ROI extraction algorithm [10]hasbeendeveloped.
After the user manually draws a polygon surrounding the
area of interest, the algorithm returns the minimal rectangle
containing this image area (Figure 4).
After this selection, an initial removal of the nonmusical
elements is carried out. In many scores, some forms of
aesthetic embellishments (frontispieces) are present in the
initial part of the document which can negatively affect
the entire OMR process. These are color elements that are
removed using the hue of the pixels (Figure 5).
2.2. Grayscale Conversion and Illumination Compensation.
The original color space of the acquired images is RGB. The
musical information of the score is contained in the position
EURASIP Journal on Image and Video Processing 5
and shapes of the music symbols, but not in their color, so the
images are converted to grayscale. The algorithm is based on
the HSI (Hue, Saturation, Lightness, Intensity) model and, so,
the conversion implemented is based on a weighted average
[10]:
I
grayscale
=
0.30 · R +0.59 · G +0.11 · B,
(1)
where R, G,andB are the coordinates of the color of each
pixel.
Now, the process of illumination compensation starts.
The objective is to obtain a more uniform background so that
the symbols can be more efficiently detected. In our system,
the illumination cannot be measured, it must be estimated
from the available data.
The acquired image I(x, y) is considered to be the
product of the reflectance R(x, y) and illumination L(x, y)
fields [11]:
I
x, y
=
R
x, y
·
L
x, y
.
(2)
The reflectance R(x, y) measures the light reflection char-
acteristic of the object, varying from 0, when the surface is
completely opaque, to 1 [12]. The reflectance contains the
musical information.
The aim is to obtain an estimation P(x, y) of the
illumination L(x, y)toobtainacorrectedimageC(x, y)
according to [11].
C
x, y
=
I
x, y
P
x, y
=
R
x, y
· L
x, y
P
x, y
≈
R
x, y
,
(3)
InordertoestimateP(x, y), the image is divided into a
regular grid of cells, then, the average illumination level is
estimated for each cell (Figure 6). Only the background pix-
els of each cell are used to estimate the average illumination
levels. These pixels are selected using the threshold obtained
by the Otsu method [13]ineachcell.
The next step is to interpolate the illumination pattern
to the size of the original image. The starting points for
the interpolation precess are placed as shown in Figure 6.
The algorithm used is a bicubic piecewise interpolation
with a neighborhood of 16 points which gives a smooth
illumination field with continuous derivative [14]. Figure 6
shows the steps performed for the compensation of the
illumination.
2.3. Image Binarization. In our context, the binarization
aims to distinguish between the pixels that constitute the
music symbols and the background. Using the grayscale
image obtained after the process described in the previous
section, a threshold τ,with0<τ<255, must be found to
classify the pixels as background or foreground [10].
Now, the threshold must be defined. The two methods
employed in our system are the iterative average method [10]
and the Otsu method [13], based on a deterministic and a
probabilistic approach, respectively.
Figure 7 shows an example of binarization. Observe that
the results do not show marked differences. So, in our system,
the user can select the binarization method at the sight of
their performance on each particular image, if desired.
2.4. Correction of Image Rotation. The staff lines are a main
source of information of the extent of the music symbols
and their position. Hence, the processes of detection and
extraction of staff lines are, in general, an important stage
of an OMR system [9]. In particular, subsequent procedures
are simplified if the lines are straight and horizontal. So, a
stage for the correction of the global rotation of the image is
included. Note that other geometrical corrections [15]have
not been considered.
The global angle of rotation shown by the staff lines must
be detected and the image must be rotated to compensate
such angle. The method used for the estimation of the
angle of rotation makes use of the Hough transform. Several
implementations of this algorithm have been developed for
different applications and the description can be found in
anumberof[16–18]. The Hough transform is based on a
linear transformation from a standard (x, y) reference plane
to a distance-slope one (ρ, Θ)withρ
≥ 0andΘ ∈ [0,2π].
The (ρ,Θ) plane, also known as Hough plane, shows some
very important properties [18].
(1) a point in the standard plane corresponds to a
sinusoidal curve in the Hough plane,
(2) a point in the Hough plane corresponds to a straight
line in the standard plane,
(3) points of the same straight line in the standard plane
correspond to sinusoids that share a single common
point in the Hough plane.
In particular, property (3) can be used to find the rotation
angle of the image. In Figure 8, the Hough transform of
an image is shown where two series of large values in
the Hough plane, corresponding to the values
∼180
◦
and
∼270
◦
, are observed. These values correspond to the vertical
and horizontal alignments, respectively. The first set of
peaks (
∼180
◦
) corresponds to the vertical stems of the
notes; the second set of peaks (
∼270
◦
) corresponds to the
approximately horizontal staff lines. In the Hough plane, the
Θ dimension is discretized with resolution of 1 degree, in our
implementation.
Once the main slope is detected, the difference with
270
◦
is computed, and the image is rotated to correct
its inclination. Such procedure is useful for images with
global rotation and low distortion. Unfortunately, most of
the images of the scores under analysis have distortions
that make the staff appear locally rotated. In order to
overcome this inconvenience, the correction of the rotation
is implemented only if the detected angle is larger than
2
◦
. In successive steps of the OMR process, the rotation of
portions of each single staff is checked and corrected using
the technique described here.
3. Staff Processing
In this section, the procedure developed to detect and
remove the staff lines is presented. The whole procedure
includes the detection of the staff lines and their removal
using a line tracking algorithm following the characterization
in [19]. However, specific processes are included in our
6 EURASIP Journal on Image and Video Processing
(a) (b)
(c) (d)
Figure 6: Example of compensation of the illumination. (a) original image (grayscale); (b) grid for the estimation of the illumination (49
cells), the location of the data points used to interpolate the illumination mask is marked; (c): average illumination levels of each cell; (d):
illumination mask with interpolated illumination levels.
implementation, like the normalization of the score size
and the local correction of rotation. In the next sub-
sections, the stages of the staff processing procedure are
described.
3.1. Isolation of the Staves. This task involves the following
stages.
(1) estimation of the thickness of the staff lines,
(2) estimation of the average distance between the staff
lines and between staves,
(3) estimation of the width of the staves and division of
the score,
(4) revision of the staves extracted.
In order to compute the thickness of the lines and the
distances between the lines and between the staves, a useful
tool is the so called row histogram or y-projection [7, 20].
This is the count of binary values of an image, computed row
by row. It can be applied to both black foreground pixels and
white background pixels (see Figure 9). The shape of this fea-
ture and the distribution of its peaks and valleys, are useful to
identify the main elements and characteristics of the staves.
EURASIP Journal on Image and Video Processing 7
(a) Original RGB image (b) Image binarized by the iterative average
method
(c) Image binarized by the Otsu method
Figure 7: Examples of binarization.
3.1.1. Estimation of the Thickness of the Staff Lines. Now,
we consider that the preliminary corrections of image
distortions are sufficient to permit a proper detection of the
thickness of the lines. In Figure 10, two examples of the shape
of row histograms for distorted and corrected images of the
same staff are shown. In Figure 10(a), the lines are widely
superimposed and their discrimination is almost impossible,
unlike the row histogram in Figure 10(b).
A threshold is applied to the row histograms to obtain
the reference values to determine the average thickness of
the staff lines. The choice of the histogram threshold should
be automatic and it should depend on the distribution
of black/white values of the row histograms. In order to
define the histogram threshold, the overall set of histogram
values are clustered into three classes using K-means [21]
to obtain the three centroids that represent the extraneous
small elements of the score, the horizontal elements different
from the staff lines, like the aligned horizontal segments of
the characters, and the effective staff lines (see Figure 11).
Then, the arithmetic mean between the second and the third
centroids defines the histogram threshold.
The separation between consecutive points of the row
histogram that cut the threshold (Figure 12) are, now, used
in the K-means clustering algorithm [21] to search for two
clusters. The cluster containing more elements will define the
average thickness of the five lines of the staff. Note that the
clusters should contain five elements corresponding to the
thickness of the staff lines and four elements corresponding
the the distance between the staff lines in a staff.
3.1.2. Est imation or the Average Distance between the Staff
Lines and between the Staves. In order to divide the score
into single staves, both the average distance among the staff
lines and among the staves themselves must be computed.
Figure 13 shows an example of the row histogram of
the image of a score where the parameters described are
indicated.
In this case, the K-means algorithm [21]isapplied
to the distances between consecutive local maxima of the
histogram over the histogram threshold to find two clusters.
The centroids of these clusters, represent the average distance
between the staff lines and the average distance between
the staves. The histogram threshold is obtained using the
technique described in the previous task (task 1) of the
isolation of staves procedure).
3.1.3. Estimation of the Width of the Staff and Division of the
Score. Now the parameters described in the previous stages
are employed to divide the score into its staves. Assuming
that all the staves have the same width for a certain score,
the height of the staves is estimated using:
W
S
= 5 · T
L
+4· D
L
+ D
S
,
(4)
where W
S
, T
L
, D
L
and D
S
stand for the staff width, the
thickness of the lines, the distance between the staff lines and
the distance between the staves, respectively. In Figure 14,
it can be observed how these parameters are related to the
height of the staves.
As mentioned before, rotations or distortions of the
original image could lead to a wrong detection of the line
thickness and to the fail of the entire process. In order to
avoid such situation, the parameters used in this stage are
calculated using a central portion of the original image. The
original image is divided into 16 cells and only the central
part (4 cells) is extracted. The rotation of this portion of the
imageiscorrectedasdescribedinSection 2.4, and then, the
thickness and width parameters are estimated.
3.1.4. Revision of the Staves Extracted. In some handwritten
music scores, the margins of the scores do not have the same
8 EURASIP Journal on Image and Video Processing
1200
1400
1600
1800
2000
2200
2400
ρ-distance
100 150 180 200 250 270 300 350
Θ-angle
2000
1500
1000
500
0
(b)
1500
1000
500
0
2400
2200
2000
1800
1600
1400
1200
100
150
180
200
250
270
300
350
2000
1500
1000
500
0
(a) (c)
Figure 8: Example of the application of the Hough transform on a score. The original image (a) and its Hough transform in 2D (b) and 3D
(c) views. The two sets of peaks corresponding to
∼180
◦
and ∼270
◦
are marked.
width and the extraction procedure can lead to a wrong
fragmentation of the staves. When the staff is not correctly
cut, at least one of the margins is not completely white,
conversely, some black elements are in the margins of the
image selected. In this case, the row histogram of white pixels
can be used to easily detect this problem by simply checking
the first and the last values of the white row histogram (see
Figures 15(a) and 15(b)), and comparing these values versus
the maximum. If the value of the first row is smaller than
the maximum, the selection window for that staff is moved
up one line. Conversely, if the value of the last row of the
histogram is smaller than the maximum, then the selection
window for that staff is moved down on line. The process is
repeated until a correct staff image, with white margins and
containing the whole five lines is obtained.
3.2. Scaling of the Score. In order to normalize the dimen-
sions of the score and the descriptors of the objects before
any recognition stage, a scaling procedure is considered. A
reference measure element is required in order to obtain a
global scaling value for the entire staff. The most convenient
parameter is the distance between the staff lines. A large set
of measures have been carried out on the available image
samples and a reference value of 40 pixels has been decided.
The scaling factor S, between the reference value and the
current lines distance is computed by
S
=
40
D
L
,(5)
where D
L
is the distance between the lines of the staff mea-
sured as described in Section 3.1.2. The image is interpolated
EURASIP Journal on Image and Video Processing 9
White pixels histogram
Image rows
1200 1000 800 600
(a)
Image columns
(b)
Black pixels histogram
Image rows
200 400 600 800 1000
(c)
Figure 9: Row histograms computed on a sample score (b). Row histograms for white and black pixels are plotted in (a) and (c), respectively.
(a) Row histogram of a distorted image of a staff
(b) Row histogram of the corrected image of the same staff
Figure 10: Example of the influence of the distortion of the image on the row histograms.
(a)
Image rows
0 100 200 300 400 500 600 700 800 900
Absolute frequency (black pixels per row)
250
200
150
100
50
0
1st centroid
2nd centroid
Optimal threshold
3rd centroid
(b)
Figure 11: Example of the determination of the threshold for the row histogram: The detection threshold is the arithmetic mean between
the centroids of the second and the third clusters, obtained using K-means.
10 EURASIP Journal on Image and Video Processing
Absolute frequency (black pixels per row)
20 40 60 80 100 120 140 160
Image rows
0
100
200
300
400
500
600
700
800
900
Line width
Threshold
Figure 12: Example of the process of detection of the thickness of
the lines. For each peak (in the image only the first peak is treated as
example), the distance between the two points of intersection with
the fixed threshold is computed. The distances extracted are used in
a K-means clustering stage, with two clusters, to obtain a measure
of the thickness of the lines of the whole staff.
Absolute frequency (black pixels per row)
200 400 600 800 1000
Image rows
0
100
200
300
400
500
600
700
800
900
1000
Lines distance Staffs distance
Threshold
Figure 13: Example of the process of detection of the distance
between the staff lines and between the staves. After the threshold
is fixed, the distances between the points of intersection with the
thresholds are obtained and a clustering process is used to group
the values regarding the same measures.
Line thickness
1/2staffs distance
Lines distance
Figure 14: The height of the staff is computed on the basis of the
line thickness, the line distances and the staff distances.
to the new size using the nearest neighbor interpolation
method (zero order interpolation) [22].
3.3. Local Correction of the Rotation. In order to reduce
the complexity of the recognition process and the effect
of distortions or rotations, each staff is divided vertically
into four fragments (note that similar approaches have been
reported in the literature [20]). The fragmentation algorithm
locates the cutting points so that no music symbols are cut.
Also, it must detect non musical elements (see Figure 16), in
case they have not been properly eliminated.
The procedure developed performs the following steps.
(1) split the staff into four equal parts and store the three
splitting points,
(2) compute the column histogram (x-projection) [7],
(3) set a threshold on the column histogram as a multiple
of the thickness of the staff lines estimated previously,
(4) locate the minimum of the column histogram under
the threshold (Figure 16(b)),
(5) select as splitting positions the three minima that are
the closest to the three points selected at step (1).
This stage allows to perform a local correction of
the rotation for each staff fragment using the procedure
described in Section 2.4 (Figure 17). The search for the
rotation angle of each staff fragment is restricted to a range
around 270
◦
(horizontal lines): from 240
◦
to 300
◦
.
3.4. Blanking of the Staff Lines. The staff lines are often
an obstacle for symbol tagging and recognition in OMR
systems [23]. Hence, a specific staff removal algorithm has
been developed. Our blanking algorithm is based on tracking
the lines before their removal. Note that the detection of
the position of the staff lines is crucial for the location of
music symbols and the determination of the pitch. Notes
and clefs are painted over the staff lines and their removal
can lead to partially erase the symbols. Moreover, the lines
can even modify the real aspect of the symbols filling holes
or connecting symbols that have to be separated. In the
literature, several distinct methods for line blanking can be
found [24–30], each of them with a valid issue in the most
general conditions, but they do not perform properly when
applied to the scores we are analyzing. Even the comparative
study in [19] is not able to find a clear best algorithm.
The approach implemented in this work uses the row
histogram to detect the position of the lines. Then, a moving
window is employed to track the lines and remove them. The
details of the process are explained through this section.
To begin tracking the staff lines, a reference point for each
staff line must be found. To this end, the approach shown
in Section 3.1.1 is used: the row histogram is computed on
a portion of the staff, the threshold is computed and the
references of the five lines are retrieved.
Next, the lines are tracked using a moving window of
twice the line thickness plus 1 pixel of height and 1 pixel
of width (Figure 18). The lines are tracked one at a time.
The number of black pixels within the window is counted,
EURASIP Journal on Image and Video Processing 11
400 500 600 800 900 1000 1100
Absolute frequency (white pixels per row)
180
160
140
120
100
80
60
40
20
0
Image rows
(a) Row histogram of the white pixels for a correctly extracted staff
400 500 600 800 900 1000 1100
Absolute frequency (white pixels per row)
180
160
140
120
100
80
60
40
20
0
Image rows
(b) Row histograms of the white pixels for an incorrectly extracted staff
Figure 15: Example of the usage of the row histogram of the white pixels to detect errors in the computation of the staff position. In (a),
the staff is correctly extracted and the first and the last row histogram values are equal to the maximum. In (b), the staff is badly cut and the
value of the histogram of the last row is smaller than the maximum value.
if this number is less than twice the line thickness, then
the window is on the line, the location of the staff line is
marked, according to the center of the window, and, then, the
window is shifted one pixel to the right. Now, the measure is
repeated and, if the number of black pixels keeps being less
than twice the thickness of the line, the center of mass of the
group of pixels in the window is calculated and the window is
shifted vertically 1 pixel towards it, if necessary. The vertical
movement of the window is set to follow the line and it is
restricted so as not to follow the symbols. Conversely, if the
number of black pixels is more than twice the line thickness,
then the window is considered to be on a symbol, the location
of the staff line is marked and the window is shifted to the
right with no vertical displacement.
Now, the description of the process of deletion of the
staff lines follows: if two consecutive positions of the analysis
window reveal the presence of the staff line, the group of
pixels of the window in the first position is blanked, then the
windows are shifted one pixel to the right and the process
continues. This approach has shown very good performance
for our application in most of cases. Only when the thickness
of the staff lines presents large variations, the process leaves a
larger number of small artifacts. In Figure 19, an example of
the application of the process is shown.
4. Processing of Music Symbols
At this point, we have a white and black image of each
staff without the staff lines, the music symbols are present
together with artifacts due to parts of the staff lines not
deleted, spots, and so forth. The aim of the procedure
described in this section is to isolate the sets of black pixels
that belong to the musical symbols (notes, clefs, etc.), putting
together the pieces that belong to the same music symbol.
Therefore, two main steps can be identified: isolation of
music elements and combination of elements that belong to
the same music symbol. These steps are considered in the
following subsections.
4.1. Isolation of Music Elements. The isolation process must
extract the elements that correspond to music symbols or
parts of music symbols and to remove the artifacts. The
nonmusical elements may be due to staff line fragments
not correctly removed in the blanking stage, text or other
elements like marks or blots. The entire process can be split
into two steps.
(1) tagging of elements,
(2) removal of artifacts.
12 EURASIP Journal on Image and Video Processing
(a) Sample staff with optimal vertical divisions (dashed line)
Absolute frequency
(black pixels per row)
0 200 400 600 800 1000 1200
Image columns
0
20
40
60
80
100
120
140
160
180
200
Histogram
Equal distance portions
Closest minimums
Threshold
Minimums
(b) Column histogram of the black pixels. The threshold (solid line), the
minima under the threshold (circles), the line that divide the staff in equal
parts (thick line) and the optimal division lines found (dashed lines) are
shown. The arrows show the shift from the initial position of the division
lines to their final location.
Figure 16: Vertical division of the staves.
4.1.1. Tagg ing of Elements. An element is defined as a group
of pixels isolated from their neighborhood. Each of these
groups is tagged with a unique value, the pixel connectivity
rule [31] is employed to detect the elements using the 4-
connected rule.
4.1.2. Removal of Artifacts. Small fragments coming from an
incomplete removal of the staff lines, text and other elements
must be removed before starting the classification of the
tagged object. This task performs two different tests.
The elements, that are smaller than the dot (the music
symbol for increasing half the value of a note) are detected
and removed. The average size is fixed apriori, evaluating
a set of the scores to be recognized and using the distance
between staff lines as reference. Now, other elements (text in
most cases) generally located at the edges of the staff will
be removed. The top and the bottom staff lines are used
as reference; if there is any element beyond this lines, it is
checked if the element is located completely outside the lines,
then, it is removed. An example of the performance of this
strategy is shown in Figure 20.
4.2. Combination of Elements Belonging to the Same Music
Symbol. At this stage, we deal a number of music symbols
composed by two or more elements, spatially separated and
with different tags. In order to properly feed the classifier,
(a)
(b)
Figure 17: An example of the correction of the rotation of staff
fragments: the inclination values of the fragments of the staff (a)
are detected using the Hough transform and corrected (b).
Figure 18: Moving window used to track the staff lines. The
window is shifted rightward and vertically, depending on the
amount of black pixels in it.
the different parts of the same symbol must be joined and a
single tag must be given.
The process to find the elements that belong to the same
music symbol is based on the calculation of the row and
column histograms for each pair of tagged objects and the
detection of the common parts of them. After a pair of
objects that share parts of their projections is found, the
elements are merged together (see Figure 21), a single tag is
assigned and the process continues.
There are cases, as the double whole (breve) or the key
of C, that are characterized by the presence of two or more
horizontal bands (Figure 22). The strategy used to merge
such symbols is similar to the one employed before. The
two bands of a double whole will show a nearly coincident
column histogram, while their row histograms will be almost
completely separated (Figure 23); hence, the check of the
overlapofbothhistogramsisnotsufficient. Then, the
overlap of the column histograms is checked measuring the
separation of the two maxima. This separation must be below
a threshold and, conversely, the row histograms must show a
null overlap to merge this objects (Figure 23).
In spite of these processes, the classifier will receive some
symbols that do not correspond to real music symbol, hence,
the classifier should be able to perform a further inspection
EURASIP Journal on Image and Video Processing 13
(a) (b)
Figure 19: An example of blanking the staff lines. (a) original image. (b) processed image.
(a) (b)
Figure 20: Blanking of extraneous elements. (a) Initial staff fragment. (b) Staff fragment after the removal of the extraneous elements.
based on the possible coherence of the notation and, as
suggested in [32, 33], on the application of music laws.
5. Classification
At this stage, the vectors of features extracted for the
unknown symbols must be compared against a series of
patterns of known symbols. The classification strategy and
the features to employ have to be decided. In this section, the
features that will be used for the classification are described.
Then, the classifiers employed are presented [31, 34]. Finally,
the task of identification of the location of the symbols is
considered.
5.1. Extraction of Features of Music Sy mbols. A common
classification strategy is based on the comparison of the
numerical features extracted for the unknown objects with
a reference set [17]. In an OMR system, the objects are the
music symbols, isolated and normalized by the preceding
stages, then a set of numerical features must be extracted
from them to computationally describe these symbols [35,
36]. In this work, four different types of features have been
chosen. These features are based on:
(1) fourier descriptors,
(2) bidimensional wavelet transform coefficients,
(3) bidimensional Fourier transform coefficients,
(4) angular-radial transform coefficients.
These descriptors will be extracted from the scaled music
symbols (See Section 3.2) and used in different classification
strategies, with different similarity measures.
14 EURASIP Journal on Image and Video Processing
120
100
80
60
40
20
0
Absolute frequency
(black pixels per column)
200
180
160
140
120
100
80
60
40
20
Image rows
Absolute frequency
(black pixels per row)
02040
20 40 60 80
Image column
Figure 21: Row and column histograms for two differently tagged
fragments of a half-note. Both, column and row histograms, are
partially overlapped.
5.1.1. Fourier Descriptors. The Fourier transform of the set
of coordinates of the contour of each symbol is computed
to retrieve the vector of Fourier descriptors which is an
unidimensional robust and reliable representation of the
image [37]. The low frequency components represent the
shape of the object, while the highest frequency values follow
the finest details. The vector of coordinates of the contour of
the object (2D) must be transformed into a unidimensional
representation. Two options are considered to code the
contour.
(1) Distance to the centroid:
z
(
n
)
=
(
x
(
n
)
− x
c
)
2
+
y
(
n
)
− y
c
2
,(6)
(2) complex coordinates with respect to the centroid:
z
(
n
)
=
(
x
(
n
)
− x
c
)
+ j
y
(
n
)
− y
c
,(7)
where x
c
and y
c
are the coordinates of the centroid and
x(n)andy(n) are the coordinates of the nth point of
the contour of the symbol. The Fourier descriptors are
widely employed in the recognition of shapes, where the
invariance with respect to geometrical transformations and
invariance with respect to changes of the initial point selected
(a)
(b)
Figure 22: Two examples of music symbols composed by horizontal
bands. The key of C and the double whole (shaded areas in the
staff).
for tracking the contour are important. In particular, the
zero frequency coefficient corresponds to the centroid, so a
normalization of the vector of coordinates by this value gives
invariance against translation. Also, the normalization of the
coefficients with respect to the first coefficient can provide
invariance against scaling. Finally, if only the modulus of
the coefficients is observed, invariance against rotation and
against changes in the selection of the starting point of the
edge vector contour is achieved.
EURASIP Journal on Image and Video Processing 15
30
20
10
0
Absolute frequency
(black pixels per column)
300
250
200
150
100
50
Image rows
Absolute frequency
(black pixels per row)
03060
50 100
Image column
Lines distance
Figure 23: Row and Column histograms for two differently tagged
fragments of a double whole. Column histograms are nearly
completely overlapped, while the row ones are separated a distance
which is smaller than the separation between the staff lines.
For the correct extraction of these features, the symbols
must be reduced to a single black element, with no holes. To
this end a dilation operator is applied to the symbols to fill the
white spaces and holes (Figure 24), using a structural element
fixed apriorifor each type of the music notations considered.
However, the largest holes may still remain (as in the inner
part of the G clef, see Figure 25(b)). Hence, all the edges are
tracked using a backtracking bug follower algorithm [17],
their coordinates are retrieved and the smaller contours are
removed.
5.1.2. Bidimensional Wavelet Transform Coefficients. The
wavelet transform is based on the convolution of the original
signal with a defined function with a fixed shape (the
mother function) that is shifted and scaled to best fit the
signal itself [10]. After applying the transformation, some
coefficients will be used for the classification. In our case,
the mother wavelet will be the CDF 5/3 biorthogonal wavelet
(Cohen-Daubechies-Feauveau), also called the LeGall 5/3,
widely used in JPEG 2000 lossless compression [38]. The
coefficients are obtained computing the wavelet transform
of each symbol framed in its tight bounding box. Only the
coefficients with the most relevant information are kept. This
selection is done taking into account both the frequency
content (the first half of the coefficients) and their absolute
value (the median of the absolute value of the horizontal
component). Finally, the coefficients are employed to com-
pute the following measures used as descriptors: sum of
absolute values, energy, standard deviation, mean residual
and entropy.
5.1.3. Bidimensional Fourier Transform Coefficients. As the
wavelet transform, the Fourier transform is used to obtain
a bidimensional frequency spectrum. The coefficients of the
transform are selected depending on their magnitude and a
series of measures are obtained (as in Section 5.1.2). Note
that, according to the comments in Section 5.1.1, only the
modulus of the coefficients is taken into account.
5.1.4. Angular-Radial Transform Coefficients. The angular
radial transform is a region-based shape descriptor that can
represent the shape of an object (even a holed one) using a
small number of coefficients [39]. The transform rests on a
set of basis functions V
m,n
(ρ, Θ),thatdependontwomain
parameters (m and n) related to an angle (Θ)andaradius
(ρ) value. In our case, 12 angular functions and 3 radial
functions are built to define 36 basis functions. Then, each
basis function is iteratively integrated for each location of
the image of the symbol to obtain a total amount of 35
descriptors (the first one is used to normalize the others). In
order to speed up the extraction of the coefficients, a LUT
(look-up table) approach is employed [40].
In order to calculate the coefficients, the image is
represented in a polar reference system with origin located at
the position of the centroid of the symbol. Then, a minimum
circle, to be used by the transform procedure (see Figure 26)
[39], is defined as the smallest circle that completely contains
the symbol. The centroid has been computed in two different
ways: as the centroid of the contour of the symbol and as the
center of the bounding box. This leads to two different sets
of angular-radial transform coefficients: ART1 and ART2,
respectively.
5.2. Classifiers
5.2.1. K-NN Classification. The k-NN classifier is one of
the simplest ones, with asymptotically optimal performance.
The class membership of an unknown object is obtained
computing the most common class among the k nearest
known elements, for a selected distance measure. Note that
the performance of the procedure depends on the number of
training members of each class [31].
For our classifier, the statistics of order one and two of
each feature and for each class of symbol are computed. The
features that do not allow to distinguish among different
classes are rejected.
The two sets of Fourier descriptors (Section 5.1.1)are
entirely included, leading to the two sets of 30 features.
Similarly, the whole two sets of 35 coefficients obtained
by the angular-radial transform (Section 5.1.4)arekept.
The first three parameters obtained by the bidimensional
16 EURASIP Journal on Image and Video Processing
(a) Original image (b) Dilated image (c) Tracked contour
Figure 24: Example of the processing stages aimed to track the contour of a half-note.
(a) Original image (b) Dilated image (with hole) (c) Contour tracked on the corrected image
Figure 25: Figure 25: Example of the process aimed to extract the coordinates of the contour of a symbol. The dilation of the complex
structure of the G clef leads to the presence of a hole, that has to be corrected before edge tracking.
wavelet transform (Section 5.1.2) are used: the two energy
related measures and its standard deviation, because they
are the only ones showing a reasonable reliability for the
discrimination of classes. Finally, only the sum of the
absolute values of the bidimensional Fourier transform
(Section 5.1.3) is retained, for the same reason.
The two distance measures employed are
(i) square residuals, for Fourier descriptors:
d
=
30
i=1
FDa
i
− FDb
i
2
,(8)
where
FDa
i
and FDb
i
are the Fourier descriptors of
the unknown symbol a and the training one b,
(ii) absolute residuals of the angular-radial, wavelet and
Fourier transforms:
d
=
n
i=1
Fa
i
− Fb
i
,(9)
where
Fa
i
and Fb
i
are the angular-radial transform
coefficients (n
= 35), the wavelet transform coeffi-
cients (n
= 3) or the single parameter selected from
the Fourier transform (n
= 1), for the unknown
element a and the training element b.
EURASIP Journal on Image and Video Processing 17
120
210
150
240
330
0
30
270
300
90
60
180
1
0.8
0.6
0.4
0.2
Figure 26: A half-note symbol represented in a polar reference
system, suitable for the calculation of the ART coefficients.
5.2.2. Classifiers Based on Mahalanobis Distance. The Maha-
lanobis distance [41] is used in a classification procedure to
measure the distance of the feature vector of an object to
the centroid of each class. The definition of this measure rest
on the dissimilarity measure between two multidimensional
random variables, calculated using the covariance matrix C
X
as
d
2
y, X
=
y − x
T
· C
−1
X
y − x
,
(10)
where the distance is computed between the features vector
y of the unknown symbol and the centroid x of the class X.
Note that the inverse of C
X
is required, so C
X
must be
nonsingular. To this end, the number of training elements
with linear independence of each class should not be smaller
than the dimension of the feature vector. Since there are
some rare (not commonly used) musical objects in the data
available, a reduced number of features is required. We
have selected 12 features, among the ones with the smallest
variance within a class, to guarantee that C
−1
X
exists.
5.2.3. Classifiers Based on the Fisher Linear Discriminant.
The Fisher linear discriminant approach is based on the
search of a linear combination of the vector of features
such that the dissimilarity between two classes is as large
as possible [31]. In particular, the Fisher linear discriminant
aims to represent two clouds of multidimensional vectors in
a favorable unidimensional framework [42]. To this end, a
projection vector
w, for the vectors of features x is found,
such that the projections Y
= w
T
x form two clouds of
elements of the two classes, projected on a line, such that the
lines distance is as large as possible. Then, the membership
of an unknown symbol (vector of features) is derived from
the location of its projection. In particular, a k-NN approach
can be used and it can also be assumed that the projections
of the vectors of features follow a Gaussian distribution [42].
This model can be used to compute the probability that a
certain projection belongs to a certain distribution (class).
Both approaches are implemented in this work.
Note that the Fisher linear discriminant is defined in
a two-class framework whilst an OMR system aims to
recognize the proper symbol among several classes, so, an
exhaustive search for the class membership is done.
5.2.4. Building the Training Database. About eighty scores
written in white mensural notation in the two styles consid-
ered (Stephano di Britto and Maestro Sanz notation styles)
have been analyzed. These scores contain more than 6000
isolated music symbols. About 55% of the scores are written
with the style of di Britto and about 60% of the scores of each
style correspond to these two authors. Note that we have not
found significative differences in the results and the features
obtained for these main authors with respect to the results
and features obtained for others. A minimum of 15 samples
of the less common symbols (classes) are stored. When the
samples of a certain class are not enough to reach the lower
limit of 15, the necessary elements are generated artificially
using nonlinear morphological operations.
5.3. Locating the Symbol Position (Pitch). Thefinaltask
related to the recognition of music symbols is the determina-
tion of the position of each of them in the staff. Note that, at
this stage, the accurate tracking of the staff lines has already
been performed and their positions, throughout the whole
staff, are known.
The exact positions of the lines and the spaces of the
staves must be defined. The spaces between the staff lines are
located according to the following relation: S
i
= L
i
+ D
L
/2,
where S
i
stands for the location of the ith space, L
i
represents
the position of the ith line and D
L
is the separation between
consecutive staff lines. Then, the row histogram of the black
pixels of each extracted symbol is computed using a tight
bounding box. This histogram is aligned with the staff at
the right position. Then, the maximum of the histogram is
located and the staff line or the space between staff lines
closest to the location of this maximum is used to define the
location of the symbol under analysis (Figure 27).
Observe that there exist two classes of symbols for which
the position is not relevant: the longa silence and the C clef.
Also note that other alternatives could be used to
determine the pitch of the symbols. For example, the location
of the bounding box in the scaled score together with the
location and shape of the model of the symbol in the box
would be enough to accomplish this task.
6. Evaluation of the System Performance
Two main tasks are directly related to the global success of
the recognizer: the extraction and the classification of the
symbols. Thus, the evaluation of the OMR system is based
on the analysis of the results of these two stages.
18 EURASIP Journal on Image and Video Processing
Figure 27: Example of the determination of the line/space membership of a quarter-note (in gray) for pitch detection. The row histogram
of the black pixels of the note (dashed line) shows a maximum close to the third line, identified by the third peak of the row histogram of the
black pixels of the staff (solid line).
Figure 28: An example of incorrectly extracted symbols. Line
fragments link two notes.
6.1. Performance Evaluation of the Algorithm of Symbol
Extraction. Themainsourceoferrorsoftheextractionstage
is the process of blanking the staff lines [43]. When the staff
lines are not correctly blanked, undesired interconnections
between objects appear, which lead to the extraction of
strange symbols, whose shape cannot be recognized at
all (Figure 28).Suchproblemismuchmorefrequentin
Sanz style samples, but this seems to be due to the worse
conditions of the scores that use this notation style. In
Ta bl e 1, the success rates in the extraction process are shown.
The “symbols correctly extracted” do not show any blot
or mark, the “symbols extracted with errors” show some
black pixels or lines fragments and, finally, the “symbols
completely lost” are the ones the algorithm is not able to
detect at all.
Both, the symbols correctly extracted and the ones
extracted with errors are included in the evaluation of the
classifier, as described in the next sections.
6.2. Implementation Results of the k-NN Classifier. The k-NN
classifier works with the set of Fourier descriptors that uses
Table 1: Success rates of the extraction algorithm for samples
written in the notation styles of Britto and Sanz.
Notation
style
%ofsymbols
correctly
extracted
%ofsymbols
Extracted with
errors
% of symbols
completely
lost
Britto 80.58% 12.81% 6.61%
Sanz 64.98% 14.34% 20.68%
the distance of the contour points to the centroid, a fixed
percentage of the wavelet transform coefficients, the Fourier
transform coefficients and the two sets of angular-radial
transform coefficients. Three different values of neighbors
k have been employed: 1, 3, and 5. In Tabl e 2, the correct
classification rates are shown.
The results are generally better for the scores that use
the notation style of Britto than for the ones that use Sanz
notation style. This is mainly due to the generally lower
quality of arts of the scores written in Sanz notation style
and, also, to the different discrimination capabilities of the
features when applied to different notation styles.
In general, the Fourier descriptors used show good
performance, showing the best results for symbols hardly
recognizable, and partially extracted. This is mainly due to
the approach used for the selection of the largest object in
the framework, based on the contours (Section 5.1.1). The
wavelet coefficients seem to be more heavily influenced by
the worst conditions of Sanz style scores, but the classifier
attains reasonable results when using the k-NN method.
Recall that the k-NN shows a high degree of dependence on
the robustness of the features employed. This is the reason
for the poor results obtained using the Fourier transform
coefficients, when only one feature is used (Section 5.2.1).
Finally, the results of the k-NN classifier implemented with
the angular-radial transform (ART) coefficients are the best
ones. The method that uses the centroid computed as the
center of gravity of the contour of the objects shows slightly
better classification rates than the approach that uses the
center of the bounding box of the object.
EURASIP Journal on Image and Video Processing 19
Table 2: Correct classification rates for the k-NN method for symbols correctly extracted and partially extracted. The methods employed for
the extraction of the vectors of features are: the Fourier descriptor, with the edge function computed by distance from the centroid (FD1),
the Wavelet transform coefficients (WTC), the Fourier transform coefficients (FTC) and the two sets of angular-radial transform coefficients
based on center of gravity of the edges (ART1) and on the center of the bounding box (ART2).
K-NN classifier results
Classification rate with entire symbols Classification rate with partial symbols
Notation style Notation style
Britto Sanz Britto Sanz
K = 1 72.31% 57.80% 64.52% 29.41%
FD1 K
= 3 73.33% 58.40% 61.29% 29.41%
K
= 5 74.87% 61.04% 64.52% 26.47%
K = 1 63.08% 40.26% 16.13% 5.88%
WTC K
= 3 68.72% 46.75% 16.13% 8.82%
K
= 5 74.36% 51.30% 16.13% 11.76%
K = 1 48.72% 35.71% 0% 2.94%
FTC K
= 3 48.72% 40.91% 0% 2.94%
K
= 5 53.33% 44.81% 0% 2.94%
K = 1 95.90% 79.87% 58.06% 20.59%
ART1 K
= 3 95.38% 78.57% 61.29% 26.47%
K
= 5 95.38% 81.82% 70.97% 26.47%
K = 1 94.36% 75.32% 22.58% 32.35%
ART2 K
= 3 91.79% 72.73% 41.93% 35.29%
K
= 5 91.79% 70.12% 51.61% 38.23%
Table 3: Correct classification rates for the classifier based on the
Mahalanobis distance. The vectors of features are obtained from the
angular-radial transform coefficients, with reference on the center
of gravity of the contour (ART1) and on the center of the bounding
box (ART2).
Mahalanobis distance classifier results
Classification rate Classification rate
with entire symbols with partial symbols
Notation style Notation style
Britto Sanz Britto Sanz
ART1 74.36% 59.09% 12.90% 35.29%
ART2 69.23% 56.49% 48.39% 23.53%
6.3. Implementation Results of the Classifier Based on the
Mahalanobis Distance. As mentioned before, the calculation
of the Mahalanobis distance depends on the size of the
matrix of features. In order to assure the nonsingularity
of the covariance matrix, the number of features employed
was reduced to twelve due to the amount of available data
and limited by some rare symbols. The reduction of the
number of features employed led, in our opinion, to a
degradation of the general performance of the method. For
this reason, only the process based on the angular-radial
transform coefficients returns acceptable results. In Ta ble 3 ,
the correct classification rates for the Mahalanobis approach
implemented with the ART coefficients are shown.
Better results would be expected if more training ele-
ments of all the classes were available, thus allowing to use
larger vectors of features in this procedure.
6.4. Implementation Results of the Fisher Linear Discriminant.
As in the case of the Mahalanobis classifier, the need of
the inverse of the covariance matrix forces to reduce the
number of usable features. Two strategies are used to decide
the membership of the unknown element after the projection
of its vector of features: the k-NN classification and the
Gaussian approach. The Fourier descriptors show acceptable
results only when the Gaussian approach is used. The results
are shown in Ta ble 4.
Again, the results obtained using the angular radial trans-
form coefficients with reference at the center of gravity of
the contour ART1 are better than the alternative approaches.
Note that there is no marked difference between the k-
NN and the Gaussian method of classification using the
projections of the vectors of features.
7. Computer Music Representation
After all the stages of the OMR system are completed
(Figure 2), the recognized symbols can be employed to write
down the score in different engraving styles or even to make
it sound. Nowadays, there is no real standard for computer
symbolic music representation [8], although different repre-
sentation formats (sometime linked to certain applications)
are available. Among them, MusicXML [44]isaformatto
20 EURASIP Journal on Image and Video Processing
Figure 29: Original images for the recognition and transcription example.
Table 4: Correct classification rates for the Fisher method for both the symbols correctly extracted and partially extracted. The vectors of
features employed are the Fourier descriptors of the distance to the centroid of the contour points (FD1) and the two sets of angular-radial
transform coefficients with center at the centroid of the contour and at the center of bounding box, ART1 and ART2, respectively. The choice
of the membership is done using a k-NN and Gaussian approach.
Fisher linear classifier results
Classification rate with entire symbols Classification rate with partial symbols
Notation style Notation style
Britto Sanz Britto
Sanz
K = 1 73.33% 59.74% 41.94%
20.59%
ART1 k-NN K
= 3 74.87% 64.28% 45.16%
17.65%
K
= 5 75.38% 64.28% 41.94%
17.65%
K = 1 67.18% 45.45% 45.16%
17.65%
ART2 k-NN K
= 3 67.18% 47.40% 45.16%
20.59%
K
= 5 67.18% 49.35% 45.16%
20.59%
ART1 Gaussian
72.31% 59.06% 32.26%
23.53%
ART2 Gaussian
63.08% 46.10% 45.16%
20.59%
FD1 Gaussian
62.05% 51.95% 35.48%
29.41%
represent western music notation from the 17th century
onwards. WEDELMUSIC [45] is a XML compliant format
which can include the image of the score and an associated
WAV or MIDI file and it is mainly aimed to support the
development of new emerging applications. GUIDO [46]is
a general purpose language for representing scores. More
recently, MPEG-SMR (Symbolic Music Representation) [47]
aims to become a real standard to cope with computer
music representation and the related emerging needs of new
interactive music applications.
In our case, we have selected Lilypond [48] for music
engraving. This program, and associated coding language,
is part of the GNU project and accepts an ASCII input to
engrave the score. It determines the spacing by itself, and
breaks lines and pages to provide a tight and uniform layout.
An important feature in our context is that it can draw the
score in modern notation and, with minimum changes, the
score in white mensural notation can also be obtained [49].
Additionally, the program can also generate the MIDI file
of the typed score [50] so that the recognized score can be
listened.
We will show an example of the usage of this tool. In
Figure 29, a sample piece of a four voices work is shown.
In Figure 30, sample code to obtain the transcription of
the score using both the original notation and modern
notation is shown (Figure 31). Observe that the text that
describes the music symbols and pitches is virtually the
same for both types of notation. When the score is to be
written in white mensural notation, Figure 30(a), the code
for Lilypond can be directly obtained from the output of the
OMR process described since there is a one-to-one relation
between the music symbol-pitch recognized and the code
EURASIP Journal on Image and Video Processing 21
(a) LilyPond code for white mensural notation (b) LilyPond code for modern notation
Figure 30: Sample Lilypond code (ASCII) to engrave the score in white mensural notation and in modern notation.
(a) Ancient notation transcription of the music contained in Figure 29
(b) Modern notation transcription of the music contained in Figure 29
Figure 31: Scores transcribed in both white mensural notation and modern notation of the original score shown in Figure 29.
required to describe that symbol-pitch in Lilypond. If the
target score must be written using modern notation, some
slight changes must be done in order to properly fill the
measures maintaining the correct duration of the notes. For
example, observe, in Figure 30(b), how the last note of the
soprano voice (brevis in white mensural notation) has been
written as a quarter-note tied to a whole-note tied to a
half-note-dot, instead of as a square note (a square note
=
two whole notes). These changes need to be done by hand
since the version of Lilypond employed does not make such
corrections automatically.
Observe that the headers are different (Figure 30),
depending on the type of notation selected. Also, note that
the code for the modern notation includes, at the end,
the command
\midi{} [50] to generate the corresponding
MIDI file.
22 EURASIP Journal on Image and Video Processing
8. Conclusions and Discussion
A complete OMR system for the analysis of manuscript
music scores written in white mensural notation of the XVII-
th and early XVIII-th centuries has been presented and
two different notation styles have been considered. Multiple
methods for the extraction of features of the music symbols
are implemented and the resulting vectors are employed in
several classification strategies.
User interaction has been limited to the selection of
an initial ROI and the choice of some of the processing
techniques available in the system at certain stages. Also,
the calculation of the Hough transform used to correct
the global rotation of the image, which is the process that
takes longer computation time in the system implemented,
can be replaced by the manual introduction of the rotation
angle.
In the experiments, it has been observed that, in spite
of the size of the database of scores used for training, the
presence of some rare symbols had an important influence
on the system. Some of the classification strategies have been
adapted to use a reduced number of features in order to cope
with these rare symbols in the same way as with the other
common symbols. Hence, the methods that do not suffer
from the scarceness of the reference elements are the ones
that attain the best performance.
The best combination of techniques involves the usage
of the k-NN method and the vectors of features based
on the angular-radial transform (ART) coefficients. Success
rates reach about 95% of symbols correctly recognized. Such
performance is attained using a k-NN classifier that employs
a large number of features (35 angular radial transform
coefficients) that are able to represent, with high level of
reliability, the very complex shape of the extracted symbols.
An open source program for music engraving (Lilypond)
has been found useful to produce new scores from the
ones processed using modern notation or white mensural
notation, as in the original scores. Also, MIDI files could be
automatically generated.
The trend for future developments of the system is
mainly based on the improvement of the performance of the
preprocessing steps. In fact, these stages are very important
for the development of the OMR system. Also, a largest
database of training data could allow to use more robustly
some of the classification strategies evaluated, like the ones
based on the Fisher linear discriminant, which are actually
limited by the availability of samples of objects of certain rare
classes.
Acknowledgments
This work has been funded by the Ministerio de Educati
´
on
y Ciencia of the Spanish Government under Project no.
TSI2007-61181 and by the Junta de Andaluc
´
ıa under Project
Number P07-TIC-02783. The authors are grateful to the
personinchargeoftheArchivodelaCatedraldeM
´
alaga,
who allowed the utilization of the data sets used in this
work.
References
[1] D. Bainbridge and T. Bell, “The challenge of optical music
recognition,” Computers and the Humanities,vol.35,no.2,pp.
95–121, 2001.
[2] J. Wolman, J. Choi, S. Asgharzadeh, and J. Kahana, “Recog-
nition of handwritten music notation,” in Proceedings of the
International Computer Music Conference, pp. 125–127, San
Jose, Calif, USA, 1992.
[3] W. McGee and P. Merkley, “The optical scanning of medieval
music,” Computers and the Humanities, vol. 25, no. 1, pp. 47–
53, 1991.
[4] N. P. Carter, “Segmentation and preliminary recognition
of madrigals notated in white mensural notation,” Machine
Vision and Applications, vol. 5, no. 3, pp. 223–230, 1992.
[5] L. Pugin, J. A. Burgoyne, and I. Fujinaga, “Goal-directed
evaluation for the improvement of optical music recognition
on early music prints,” in Proceedings of the 7th ACM/IEEE
Joint Conference on Digital Libraries (JCDL ’07), pp. 303–304,
Vancouver, Canada, June 2007.
[6] J. Caldas Pinto, P. Vieira, M. Ramalho, M. Mengucci, P. Pina,
and F. Muge, “Ancient music recovery for digital libraries,” in
Proceedings of the 4th European Conference on Research and
Advanced Technology for Digital Libraries,LectureNotesin
Computer Science, pp. 24–34, January 2000.
[7] I. Fujinaga, Adaptive optical music recognition, Ph.D. thesis,
Faculty of Music, McGill University, June 1996.
[8] M. Droetboom, I. Fujinaga, and K. MacMillan, “Optical music
interpretation,” in Proceedings of the IAPR International Work-
shop on Structural, Syntactic and Statistical Pattern Recognition ,
Lecture Notes in Computer Science, pp. 378–386, 2002.
[9] D. Bainbridge, “Optical music recognition,” Progress Report 1,
Department of Computer Science, University of Canterbury,
1994.
[10] R. C. Gonz
´
alez and R. E. Woods, Di gital Image Processing,
Prentice-Hall, Upper Saddle River, NJ, USA, 2007.
[11] O. Trabocchi and F. Sanfilippo, “Efectos de la iluminaci
´
on,”
Tech. Rep., Ingeniero en Automatizaci
´
on Y Control Industrial,
Universidad Nacional de Quilmes, 2005.
[12] F. Sanfilippo and O. Trabocchi, “Tipos de iluminaci
´
on,” Tech.
Rep., Ingeniero en Automatizaci
´
on Y Control Industrial,
Universidad Nacional de Quilmes, 2005.
[13] N. Otsu, “A threshold selection method from gray-level his-
tograms,” IEEE Transactions on Systems, Man and Cybernet ics,
vol. 9, no. 1, pp. 62–66, 1979.
[14] H. Lu and P. D. Cary, “Deformation measurements by
digital image correlation: implementation of a second-order
displacement gradient,” Experimental Mechanics, vol. 40, no.
4, pp. 393–400, 2000.
[15] R. Lobb, T. Bell, and D. Bainbridge, “Fast capture of sheet
music for an agile digital music library,” in Proceedings of the
International Symposium on Music Information Retrieval,pp.
145–152, 2005.
[16] I. Pitas, Digital Image Processing Algorithms and Applications,
Wiley-Interscience, New York, NY, USA, 2000.
[17] W. K. Pratt, Digital Image Processing,JohnWiley&Sons,New
York, NY, USA, 2007.
[18]R.O.DudaandP.E.Hart,Pattern Classification and Scene
Analysis, John Wiley & Sons, New York, NY, USA, 1973.
[19] C. Dalitz, M. Droettboom, B. Pranzas, and I. Fujinaga,
“A comparative study of staff removal algorithms,” IEEE
Transactions on Pattern Analysis and Machine Intelligence, vol.
30, no. 5, pp. 753–766, 2008.
EURASIP Journal on Image and Video Processing 23
[20] M. Szwoch, “A robust detector for distorted music staves,” in
Proceedings of the 11th International Conference on Computer
Analysis of Images and Patterns (CAIP ’05), vol. 3691, pp. 701–
708, September 2005.
[21] C. W. Therrien, Decision Estimation and Classification: An
Introduction to Pattern Recognition and Related Topics,John
Wiley & Sons, New York, NY, USA, 1989.
[22] J. S. Lim, Two-Dimensional Signal and Image Processing,
Prentice-Hall, Upper Saddle River, NJ, USA, 1990.
[23] D. Blostein and H. S. Baird, “A critical survey of music image
analysis,” in Structured Document Image Analysis,H.S.Baird,
H. Bunke, and K. Yamamoto, Eds., pp. 405–434, Springer,
Berlin, Germany, 1992.
[24] D. Pruslin, Automatic recognition of sheet music, Ph.D. thesis,
Massachusetts Institute of Technology, Cambridge, Mass,
USA, June 1966.
[25] D. S. Prerau, Computer pattern recognition of standard engraved
music notation, Ph.D. thesis, Massachusetts Institute of Tech-
nology, Cambridge, Mass, USA, September 1970.
[26] A. Andronico and A. Ciampa, “On automatic pattern recog-
nition and acquisition of printed music,” in Proceedings of
the International Computer Music Conference (ICMC ’82),pp.
245–278, 1982.
[27] J. V. Mahoney, Automatic analysis of musical score images,M.S.
thesis, Massachusetts Institute of Technology, Cambridge,
Mass, USA, 1982.
[28] J. W. Roach and J. E. Tatem, “Using domain knowledge in
low-level visual processing to interpret handwritten music: an
experiment,” Pattern Recognition, vol. 21, no. 1, pp. 33–44,
1988.
[29] N. P. Carter, Automatic recognition of printed music in the
context of electronic publishing, Ph.D. thesis, University of
Surrey, February 1989.
[30] H. Kato and S. Inokuchi, “The recognition system of printed
piano using musical knowledge and constraints,” in Proceed-
ings of IAPR Workshop on Syntactic and Structured Pattern
Recognition, pp. 231–248, June 1990.
[31] R.O.Duda,P.E.Hart,andD.G.Stork,Pattern Classification,
Wiley-Interscience, New York, NY, USA, 2000.
[32] K. C. Ng and R. D. Boyle, “Recognition and reconstruction of
primitives in music scores,” Image and Vision Computing, vol.
14, no. 1, pp. 39–46, 1996.
[33] V. G. Gezerlis and S. Theodoridis, “Optical character recog-
nition of the Orthodox Hellenic Byzantine music notation,”
Pattern Recognition, vol. 35, no. 4, pp. 895–914, 2002.
[34] S. Theodoridis and K. Koutroumbas, Pattern Recognition,
Academic Press, New York, NY, USA, 2006.
[35] R. Llobet, J. P
´
erez, and R. Paredes, “T
´
ecnicas reconocimiento
de formas aplicadas al diagn
´
ostico de c
´
ancer asistido por
ordenador,” RevistaeSalud.com, vol. 2, no. 7, 2006.
[36] M. Sonka, V. Havac, and R. Boyle, Image Processing, Analysis
and Machine Vision, Cambridge University Press, Cambridge,
UK, 1993.
[37] C. T. Zahn and R. Z. Roskies, “Fourier descriptors for plane
closed curves,” IEEE Transactions on Computers, vol. 21, no. 3,
pp. 269–281, 1972.
[38] C. Christopoulos, A. Skodras, and T. Ebrahimi, “The
JPEG2000 still image coding system: an overview,” IEEE
Transactions on Consumer Electronics
, vol. 46, no. 4, pp. 1103–
1127, 2000.
[39] S K. Hwang and W Y. Kim, “Fast and efficient method for
computing ART,” IEEE Transactions on Image Processing, vol.
15, no. 1, pp. 112–117, 2006.
[40] M. H
¨
oynck and J R. Ohm, “Shape retrieval with robustness
against partial occlusion,” in Proceedings of the IEEE Interna-
tional Conference on Acoustics, Speech, and Signal Processing
(ICASSP ’03), vol. 3, pp. 593–596, Hong Kong, April 2003.
[41] R. De Maesschalck, D. Jouan-Rimbaud, and D. L. Massart,
“Tutorial: the Mahalanobis distance,” Chemometrics and Intel-
ligent Laboratory Systems, vol. 50, pp. 1–8, 2000.
[42] H. Stark and J. W. Woods, Probability Random Processes &
Estimation Theory for Engineers, Prentice-Hall, Upper Saddle
River, NJ, USA, 1994.
[43] D. Bainbridge and T. C. Bell, “Dealing with superimposed
objects in optical music recognition,” in Proceedings of the
6th International Conference on Image Processing and Its
Applications, vol. 2, pp. 756–760, Dublin, Ireland, July 1997.
[44] M. Good, “MusicXML for notation and analysis,” in The Vir-
tual Score: Representation, Retrieval, Restoration,W.B.Hewlett
and E. Selfridge-Field, Eds., Computing in Musicology, no. 12,
pp. 113–124, MIT Press, 2001.
[45] P. Bellini and P. Nessi, “WEDELMUSIC format: and XML
music notation format for emerging applications,” in Proceed-
ings of the 1st International Conference on WEB Delivering of
Music (WEDELMUSIC ’01), pp. 79–86, 2001.
[46] H. H. Hoos, K. A. Hamel, K. Reinz, and J. Kilian, “The
GUIDO notation format. A novel approach for adequately
representing score-level music,” in Proceedings of the Interna-
tional Computer Music Conference, pp. 451–454, 1998.
[47] P. Bellini, P. Nesi, and G. Zoia, “Symbolic music representation
in MPEG,” IEEE Multimedia, vol. 12, no. 4, pp. 42–49, 2005.
[48] “LilyPond music notation for everyone,” 2009, http://lily-
pond.org/web/index.
[49] H W. Nienhuys and J. Nieuwenhuizen, “Lilypond, a system
for automated music engraving,” in Proceedings of the 14th Col-
loquium on Musical Informatis, pp. CIM-1–CIM-6, Florence,
Italy, 2003.
[50] “Gnu lilypond—notation reference,” 2009, http://lilypond
.org/doc/v2.12/Documentation/user/lilypond.pdf.