báo cáo hóa học:" Research Article Rate Distortion Analysis and Bit Allocation Scheme for Wavelet Lifting-Based Multiview Image Coding" potx
Bạn đang xem bản rút gọn của tài liệu. Xem và tải ngay bản đầy đủ của tài liệu tại đây (1.23 MB, 13 trang )
Hindawi Publishing Corporation
EURASIP Journal on Advances in Signal Processing
Volume 2009, Article ID 394065, 13 pages
doi:10.1155/2009/394065
Research Article
Rate Distortion Analysis and Bit Allocation Scheme for
Wavelet Lifting-Based Multiview Image Coding
Pongsak Lasang1 and Wuttipong Kumwilaisak2
1 Media
Processing Group, Panasonic Singapore Laboratories (PSL), Block 1022 Tai Seng Avenue 06-3530, Singapore 534415
and Multimedia Laboratory, Department of Electronics and Telecommunication, Faculty of Engineering,
King Mongkut’s University of Technology, Thonburi 126 Prachauthis Road, Bangmod, Tungkru, Bangkok 10140, Thailand
2 Communication
Correspondence should be addressed to Wuttipong Kumwilaisak,
Received 10 January 2009; Revised 17 May 2009; Accepted 13 August 2009
Recommended by Lisimachos P. Kondi
This paper studies the distortion and the model-based bit allocation scheme of wavelet lifting-based multiview image coding.
Redundancies among image views are removed by disparity-compensated wavelet lifting (DCWL). The distortion prediction of
the low-pass and high-pass subbands of each image view from the DCWL process is analyzed. The derived distortion is used
with different rate distortion models in the bit allocation of multiview images. Rate distortion models including power model,
exponential model, and the proposed combining the power and exponential models are studied. The proposed rate distortion
model exploits the accuracy of both power and exponential models in a wide range of target bit rates. Then, low-pass and high-pass
subbands are compressed by SPIHT (Set Partitioning in Hierarchical Trees) with a bit allocation solution. We verify the derived
distortion and the bit allocation with several sets of multiview images. The results show that the bit allocation solution based
on the derived distortion and our bit allocation scheme provide closer results to those of the exhaustive search method in both
allocated bits and peak-signal-to-noise ratio (PSNR). It also outperforms the uniform bit allocation and uniform bit allocation
with normalized energy in the order of 1.7–2 and 0.3–1.4 dB, respectively.
Copyright © 2009 P. Lasang and W. Kumwilaisak. This is an open access article distributed under the Creative Commons
Attribution License, which permits unrestricted use, distribution, and reproduction in any medium, provided the original work is
properly cited.
1. Introduction
In recent years, multiview image coding has become an
interesting research area due to its various multimedia
applications such as 3-dimensional television, free-viewpoint
television, and video surveillance. A set of multiview images
is taken by several cameras from different angles. These
cameras aim at the same objects to capture the depth of
the objects and other useful information. This generates a
huge data volume, which makes efficient compression of
multiview images necessary.
Most multiview image compression algorithms in literature try to reduce intraview and interview redundancies
among image views. In [1], Tong and Gray studied the interview redundancy and the disparity compensated predictive
coding for multiview images. Magnor et al. [2] proposed the
multiview image coding technique based on the texture map
and model-aided prediction. In video coding, the efficient
motion compensation schemes using a lifting technique [3–
5] have been proposed to reduce redundancies between
video frames, when the wavelet transform is used. It was
shown that this guarantees the invertibility at the synthesis
side. In addition, using a wavelet compression framework,
the scalable property and high-energy compaction can be
achieved [3]. The wavelet lifting techniques used for coding
multiview images were first proposed in [6, 7]. The disparity
compensation is incorporated into the lifting structure called
disparity-compensated lifting to transform the light fields
across the views. Haar and 5/3 wavelets are used as the
wavelet kernels. The wavelet coefficients in each subband are
coded using SPIHT algorithm [8] in a blockwise basis. In [9],
Anantrasirichai et al. achieved a spatial scalability of image
views via in-band disparity estimation and compensation
with the wavelet lifting scheme. The adaptive wavelet lifting
framework used for disparity compensation was proposed
by Lasang et al. [10]. The mode of disparity compensation
2
is selected among Haar, 5/3, or a new proposed wavelet
lifting scheme. The criterion in the selection is based on the
Minimum Mean Square Error (MMSE) and some selected
image features. In their work, the SPIHT codec is also used
for coding wavelet coefficients.
To optimally code multiview images with a lifting
technique, the bit rate should be allocated to different
subbands with the objective to maximize the reconstructed
multiview image quality. Without a model, we may need to
exhaustively search for the optimal bit allocation solution.
This makes the multiview image coding very complex. The
first bit allocation algorithm was proposed by Shoham and
Gersho [11]. The algorithm provides the optimal solution
to the problem for an arbitrary set of quantizers. Since
this algorithm needs to compute the rate-distortion (R-D)
characteristics for all available quantizers, it has a high computational complexity. The complexity of such algorithm
can be significantly reduced, if the R-D characteristics can
be accurately approximated. Lin and Ortega [12] used a
polynomial-spline function to fit the R-D curve for the
optimal bit allocation. In [13], the analytical model is
used to approximate the empirical R-D curve. However,
the scope of these algorithms is limited to a wide range
of bit rate. In [14], Rajpoot investigated the combination
of different R-D models to represent the accurate R-D
characteristics for a wide range of bit rate. Even though
many previous works examine various multiview image
coding techniques and the R-D models for encoding image
and video contents, there are not many works examining the development of distortion analysis and an R-D
model to use in the bit allocation and to code multiview
images.
In this paper, we derive the distortion and present the
model-based bit allocation scheme for wavelet lifting-based
multiview image coding. The derived framework can reduce
the complexity in searching for the suitable solution of
bit allocation in image subbands. The redundancies among
image views are first removed by DCWL. The redundancy
removal is performed on the macroblock level with the
block size of 16 × 16 pixels. The distortion prediction of
the low-pass and high-pass subbands of each image view
obtained from the DCWL process is analyzed. Together
with the derived distortion, a rate distortion model is
used in the model-based bit allocation to obtain the bit
allocation solution. We study and analyze the accuracy and
performance of the model-based bit allocation schemes,
when different rate distortion models including exponential
model [15], power model [16], and the proposed rate
distortion combining both exponential and power models
are used. The proposed rate distortion model exploits the
accuracy of both models in a wide range of target bit rates.
The bit allocation framework allocates bits to all subbands
of image views with the goal to minimize distortion of the
reconstructed multiview images. Low-pass and high-pass
subband components are compressed by SPIHT with the
bit allocation solution derived from the model-based bit
allocation scheme.
Figure 1 shows the overall framework of the proposed
multiview image coding. First the system inputs a set of
EURASIP Journal on Advances in Signal Processing
Bit allocation
Input
multi-view
image
Low-pass,
Disparity- high-pass
Spatial
compensated
analysis
analysis
Disparity
estimation
Entropy Bitstream
coding
(SPIHT)
Disparity vectors
Figure 1: The overview framework of the proposed multiview
image coding.
multiview images that will be used to encode. Then, blockbased disparity estimation is performed to estimate the
disparity vectors. At disparity-compensated (DC) analysis,
the estimated disparity vectors are used to compensate the
disparity between image views. Then, the wavelet lifting
is performed. The wavelet coefficients from DCWL are
compressed using SPIHT codec [8]. The bit rate used in
SPIHT codec for encoding each subband is computed from
the rate distortion model, in which finally the compressed
bitstream will be produced.
The remainder of this paper is organized as follows.
In Section 2, we present the disparity-compensated wavelet
lifting. In Section 3, we analyze and derive the distortion
prediction of multiview image, when disparity compensation
with the wavelet lifting scheme is used. In Section 4, we
describe the model-based bit allocation to different subbands
of multiview images based on the derived distortion and
different rate-distortion models. The experimental results
are shown in Section 5. The conclusion remarks and future
works are given in Section 6.
2. Disparity-Compensated Wavelet Lifting
The lifting scheme is used to construct the discrete wavelet
transform (DWT) as investigated in [17]. In general, highpass (H) and low-pass (L) subband decompositions can be
achieved with a sequence of predict (P) and update (U) steps
from the lifting structure. There are more than one possible
wavelet lifting structures used to code multiview images such
as Haar or 5/3 wavelet lifting.
The analysis side of the lifting scheme decomposes
multiview images to H and L subbands. Suppose that we
have N image views. We divide this group of image views into
even views, X2i , and odd views, X2i+1 , where i = 0, . . . , N/2 ,
which are similar and highly correlated in general. In the
context of multiview image coding, the disparity estimation
and compensation can be effectively integrated into the P
and U steps. The synthesis side reconstructs the multiview
images from H and L subbands by inverting U and P
steps in the analysis side. Figures 2 and 3 show the first
level decompositions of the DCWL Haar and 5/3 types,
respectively.
EURASIP Journal on Advances in Signal Processing
3
Analysis side
Synthesis side
X2i
X2i
+
Li
+
−b2i+1,2i
b2i+1,2i
P
−a2i,2i+1
X2i+1
Li
U
P
U
+
Hi
a2i,2i+1
X2i+1
+
Hi
(a)
(b)
Figure 2: The first level decomposition of DCWL Haar type.
Analysis side
X0
Predict
+
H0
U
L1
U
+
a4,3
P
−b3,4
L2
L2
+
X4
.
.
.
.
.
.
(a)
X3
+
U
.
.
.
.
.
.
a2,3
H1
b3,4
X4
P
U
H1
P
X2
−b3,2
U
+
−a4,3
P
+
b3,2
−a2,3
a2,1
−b1,2
L1
X1
+
b1,2
+
a0,1
H0
Update
U
P
P
U
+
X2
X0
−b1,0
U
P
.
.
.
L0
b1,0
P
−a2,1
X3
L0
+
−a0,1
X1
Synthesis side
.
.
.
(b)
Figure 3: The first level decomposition of disparity compensated 5/3 wavelet lifting.
In the DCWL Haar type, the disparity compensation is
performed by using only a single adjacent view as a reference
view, whereas 5/3 type uses two adjacent views. Specifically,
DCWL Haar type uses image view i − 1 or image view i +
1 to reduce the redundancy in image view i, while DCWL
5/3 type uses both of them. It is possible to use more than
two reference image views in DCWL. For example, to predict
image view i, we may use image views i−1, i+1, i−3, i+3, i−5,
i + 5, . . .. In other words, an even view is predicted from odd
views, and an odd view is predicted from even views. In this
way, it is guaranteed that all image views can be recovered at
the synthesis side of wavelet lifting.
For DCWL Haar type, the ith low-pass (Li ) and high-pass
(Hi ) components can be written as
Hi = X2i+1 − a2i,2i+1 P X2i , d2i+1 → 2i ,
(1)
Li = X2i + b2i−1,2i U Hi−1 , −d2i−1 → 2i .
The ith low-pass (Li ) and high-pass (Hi ) components
for DCWL 5/3, which uses two reference frames to perform
disparity compensation, can be written as
Hi = X2i+1 − a2i,2i+1 × P X2i , d2i+1 → 2i
− a2i+2,2i+1 × P X2i+2 , d2i+1 → 2i+2 ,
(2)
Li = X2i + b2i−1,2i × U Hi−1 , −d2i−1 → 2i
+ b2i+1,2i × U Hi , −d2i+1 → 2i ,
where dn → m denotes the set of disparity vectors from image
view n to image view m. P(Xm , dn → m ) is the prediction
step, which is the disparity compensation of image Xm using
dn → m . U(Hk , −dl → j ) is the update step using Hk and inverse
disparity vector −dl → j . The scaling factors am,n and bm,n are
4
EURASIP Journal on Advances in Signal Processing
Table 1: Scaling factors in the P and U steps in different lifting
types.
Lifting modes
am,n
Haar mode
1
5/3 mode
1
2
bm,n
1
2
1
4
used in the P and U steps, respectively. All the subscripts,
denoting view indices, are restricted between 0 and N − 1,
where N is the number of image views.
We adopt the weighting scheme in [18]. Specifically, am,n
is set to the inverse of the number of reference views and bm,n
is set to am,n /2. Table 1 summarizes the scaling factors in the
lifting modes. Figure 4 illustrates the reference image views
used in disparity compensation with DCWL Haar and 5/3
types.
At the synthesis side, the inverse U and P steps recover
views X2i and X2i+1 from the subbands. The reconstructed
images for DCWL Haar can be written as
known as “multiconnected pixels.” These kinds of pixels
influence the distortion computation of the reconstructed
images. Therefore, their effects are taken into account during
the distortion prediction. The example of connected pixels
and unconnected pixels between image views 0 and 1 is
shown in Figure 5, when parallel views are being captured.
The distortion of reconstructed connected pixels has
the influence from multiple reference image views in both
forward and reverse disparity prediction, whereas the distortions of reconstructed unconnected pixels have the influences
from only reference image views in forward or reverse
direction. Let f and r be the ratios of connected pixels in
forward and reverse directions of the reference images, where
0 ≤ f ≤ 1, 0 ≤ r ≤ 1, and f + r ≤ 1. Consider the use of the
5/3 wavelet lifting in disparity compensation. First, consider
the connected pixel area. Based on Table 1, let am,n = a and
bm,n = b for all m and n. The distortion corresponding to the
connected pixels of views X2i and X2i+1 can be expressed as
DC,X2i = DLi − b × DHi + DHi−1 ,
DC,X2i+1 = DHi + a × DX2i + DX2i+2
= DHi + a × DLi − a × b × DHi + DHi−1
X2i = Li − b2i−1,2i × U Hi−1 , −d2i−1 → 2i ,
(3)
X2i+1 = Hi + a2i,2i+1 × P X2i , d2i+1 → 2i .
+ a × DLi+1 − a × b × DHi + DHi+1
= (1 − 2 × a × b) × DHi + a × DLi − a × b × DHi−1
The reconstructed multiview images for DCWL 5/3 can
be expressed as
X2i = Li − b2i−1,2i × U Hi−1 , −d2i−1 → 2i
− b2i+1,2i × U Hi , −d2i+1 → 2i ,
(4)
X2i+1 = Hi + a2i,2i+1 × P X2i , d2i+1 → 2i
+ a2i+2,2i+1 × P X2i+2 , d2i+1 → 2i+2 ,
where X2i and X2i+1 are the reconstructed versions of image
views X2i and X2i+1 . Li and Hi are the reconstructed versions
of low-pass and high-pass subband i of Li and Hi . Note that
at the synthesis side the reconstructed image views may not
be equal to those in the analysis side due to the lossy coding
by the quantization process or the truncation of wavelet
coefficients in each subband.
3. Distortion Analysis of Wavelet Lifting-Based
Multiview Image Coding
In this section, we analyze the distortion of wavelet liftingbased multiview image coding. In multiview image coding
context, to reduce redundancies among image views, the
similar pixels from adjacent views are estimated (i.e., disparity prediction in P step). Pixels are classified as “connected
pixels,” if good matches can be found in the overlapped
regions between image views. Otherwise, pixels are classified
as “unconnected pixels” as pixels in the nonoverlapped
regions in either forward or backward directions. The
connected pixels with more than one disparity vectors are
+ a × DLi+1 − a × b × DHi+1 ,
(5)
where DC,X2i and DC,X2i+1 are the distortions in the connected
pixel area of image views X2i and X2i+1 , which are caused by
forward and backward prediction, respectively. The scaling
factor a (predict operator) and the scaling factor b (update
operator) are set to 1/2 and 1/4, respectively (for 5/3
wavelet lifting [18]). In this paper, the multiconnected pixels
are treated as the regular connected pixels. Therefore, its
distortion computation is the same as (5). We also use
the same scaling factors (a = 1/2, b = 1/4) for the
multiconnected pixels. Note that the update operator can be
computed based on the number of multiconnected pixels; see
[19].
Next, let us consider the distortion in the unconnected
pixel area. When only the image views used for forward
prediction are used, the distortion of views X2i and X2i+1 can
be written as
DU f ,X2i = DLi − b f × DHi ,
DU f ,X2i+1 = a f × DLi + 1 − a f × b f × DHi ,
(6)
where DU f ,X2i and DU f ,X2i+1 are the distortions in the unconnected pixel area of image views X2i and X2i+1 , which are
caused by the forward prediction.
When only the image views used for backward prediction
are used, the distortion of views X2i and X2i+1 can be written
as
DUr ,X2i = DLi − br × DHi ,
DUr ,X2i+1 = ar × DLi + (1 − ar × br ) × DHi ,
(7)
EURASIP Journal on Advances in Signal Processing
5
V4
V4
V3
V3
V2
V2
V1
V1
V0
V0
(a) Haar mode
(b) 5/3 mode
Figure 4: Illustration of the reference image views in DCWL Haar and 5/3 types.
Table 2: The average of f and r ratio of different test images.
Test images
Tsukuba
Teddy
Venus
Race1
Unconnected pixels (reverse)
Connected pixels
Unconnected pixels (forward)
Average of f ratio
0.02343750
0.02734375
0.01171875
0.0625000
Average of r ratio
0.01931250
0.02539062
0.02148437
0.05468750
The experimental results in Section 5 (see Figure 6) support
the above assumption.
From (5), we will obtain
View 0
View 1
DC,X2i = DLi − 2 × b × DHi ,
Figure 5: The example shown the unconnected, connected, and
occluded pixels, when we consider image view 0 and 1 (reference
view).
where DUr ,X2i and DUr ,X2i+1 are the distortions in the unconnected pixel area of image views X2i and X2i+1 , which are
caused by the backward prediction. The scaling factors b f ,
a f , br and ar can be computed based on Table 1. More
specifically, we set a f = ar = 1 and b f = br = 1/2.
We can compute the total distortion of multiview X2i and
X2i+1 from all areas as
DX2i = 1 − f − r × DC,X2i + f × DU f ,X2i + r × DUr ,X2i ,
DC,X2i+1 = 2 × a × DLi + (1 − 4 × a × b) × DHi .
If we set a f = ar = a and b f = br = b, from (8), the total
distortion of multiview X2i and X2i+i can be written as
DX2i = DLi − 2 − f − r × b × DHi ,
DX2i+1 = 2 − f − r × a × DLi
(11)
+ 1 − 4 − 3 × f − 3 × r × a × b × D Hi .
When all blocks can find good matches (i.e., image views
are fully overlapped and f , r = 0), based on Table 1 (a = 1/2,
b = 1/4) (11), we can write the total distortions of X2i and
X2i+1 as
DX2i+1 = 1 − f − r × DC,X2i+1 + f × DU f ,X2i+1 + r × DUr ,X2i+1 .
(8)
DX2i = DLi −
1
× D Hi ,
2
Assume that every pixel in view X2i+1 can be possibly
predicted from two adjacent reference views (view X2i and
X2i+2 ). Based on our observation from several multiview
test images, most contents of different image views are close
to one another, when cameras are not shifted significantly
among image views. Therefore, the disparity compensation
can remove redundancy significantly. Based on the fact
discussed above, if the distortions of image views are equally
distributed, we can write the distortion of L and H subbands
as
DX2i+1 = DLi +
1
× D Hi .
2
DHk ∼ DHk−1 ∼ DHk+1 ,
=
=
∼
DLk ∼ DLk−1 = DLk+1 .
=
(9)
(10)
(12)
For the multiview test images used in this paper, the
average ratios of f and r are shown in Table 2.
Note that the ratios in Table 2 will be used to analyze the
distortion and bit allocation of multiview test images in the
experimental result.
4. Rate-Distortion Model and Bit Allocation
In this section, we study the use of the rate distortion model
to perform the bit allocation to the multiview image coding
based on the derived distortion in Section 3.
6
EURASIP Journal on Advances in Signal Processing
Tsukuba: H subbands
35
700
500
Distortion
600
25
Distortion
30
Tsukuba: L subbands
20
15
400
300
10
200
5
100
0
0
0.1 0.3 0.5 0.7 0.9 1.1 1.3 1.5 1.7
Rate (bpp)
0 0.1 0.2 0.3 0.4 0.5 0.6 0.7 0.8 0.9 1
Rate (bpp)
Actual H0
Actual H1
Proposed
Exponential model
Power model
Actual L0
Actual L1
Actual L2
Proposed
Exponential model
Power model
(a)
Teddy: H subbands
Teddy: L subbands
35
800
30
700
600
Distortion
Distortion
25
20
15
500
400
300
10
200
5
100
0
0
0.2
0.4
Actual H0
Actual H1
Proposed
0.6
0.8
Rate (bpp)
1
0
0.1 0.3 0.5 0.7 0.9 1.1 1.3 1.5 1.7 1.9
Rate (bpp)
1.2
Actual L0
Actual L1
Proposed
Exponential model
Power model
Exponential model
Power model
(b)
35
Venus: H subbands
900
Venus: L subbands
800
30
700
Distortion
Distortion
25
20
15
500
400
300
10
200
5
0
600
100
0
0.1 0.3 0.5 0.7 0.9 1.1 1.3 1.5 1.7
Rate (bpp)
0 0.1 0.2 0.3 0.4 0.5 0.6 0.7 0.8 0.9 1
Rate (bpp)
Actual H0
Actual H1
Proposed
Exponential model
Power model
Actual L0
Actual L1
Actual L2
Proposed
Exponential model
Power model
(c)
Figure 6: Comparison of the accuracy of the rate distortion models for H subband (left) and L subband (right) of different test sequences
(a) Tsukuba, (b) Teddy, and (c) Venus.
EURASIP Journal on Advances in Signal Processing
7
4.1. Rate-Distortion Model. An accurate rate distortion
model plays an important role in multimedia compression
and transmission due to its efficiency in computation and
low complexity. At high bit rate, the exponential model
matches well with rate distortion characteristic [16]. If we
model the distribution of wavelet coefficients as a Laplacian
distribution and define distortion as De,l (Xr , Xo ) = |Xr −
Xo |, where Xr and Xo are the reconstructed image and the
original image, respectively, the rate distortion function can
be written as [15]
R De,l = ln
σ
;
De,l
0 < De,l < σ,
(13)
where σ is the standard deviation of wavelet coefficients. De,l
is the distortion from the exponential model, when we model
the distribution of wavelet coefficients as a Laplacian source
and R is a coding bit rate.
When we model the distribution of wavelet coefficients
as a Gaussian distribution and define distortion as
R De,g =
1
σ2
;
log
2
De,g
0 < De,g < σ 2 ,
(14)
where σ 2 is the source variance. Laplacian and Gaussian
source models are widely used for source modeling because
of their mathematical tractability [20]. We can write a
general form of the exponential model of both Laplacian and
Gaussian sources as [15]
De (R) = α × e−β×R ,
(15)
where De (R) is a general form of the exponential model and
α and β are the constants depended on the source type.
At a low bit rate region, the power model is highly
accurate to represent rate-distortion function [16]. This
model can be used for both Gaussian and Laplacian sources.
A general form of the power model can be written as
D p (R) = η × R−γ ,
(16)
where η and γ are constants depended on the source type.
However, the exponential model or the power model
may not accurately represent the rate-distortion function
over a wide range of bit rate. We experimentally compare
the accuracy of the exponential and the power models with
the actual data using different test images in Section 5 (see
Figure 6). We found that both models are not able to fit the
actual data in a whole range of bit rate. Therefore, we propose
a combined rate-distortion model. It exploits the advantages
of both exponential and power models by trying to capture
rate distortion function precisely in a whole range of bit rate.
The proposed rate distortion model can be written as
Dt (R) = ω1 × De (R) + ω2 × D p (R)
= ω1 × α × e−β×R + ω2 × η × R−γ ,
(17)
where De (R) is the exponential distortion component, D p (R)
is the power distortion component, and ω1 and ω2 are the
weights of the exponential and the power components, where
0 ≤ ω1 ≤ 1, 0 ≤ ω2 ≤ 1, and ω1 + ω2 = 1. α, β,
η, and γ are the parameters characterizing the proposed
distortion model. We compute the parameters α, β, η, and
γ using the least square method, in which we use 7 actual RD points. We observed that the actual R-D points are lined
in between the R-D points of the exponential and power
models (see Figure 6 in Section 5). Therefore, we empirically
set ω1 = ω2 = 0.5 in this paper as an example for a specific
test sequence used in this paper, which give minimum MSE
of overall R-D points between the combined model and
the actual R-D points. Note that the above choice may not
give minimum MSE for other test sequences. Therefore, ω1
and ω2 may be adaptively tuned for low and high bit rate
differently depending on the image test sequences.
4.2. Model-Based Subband Bit Allocation. The bit allocation
can be formulated as an optimization problem, which aims
to minimize the total distortion in a presence of a rate
constraint [11]. The total distortion can be expressed as a
weighted sum of the distortion of L and H subbands. This is
because the distortions from (11) can be written in terms of
DLk and DHk . The total distortion of all frames can be written
as
DX2i+1 =
DX2i +
∀i
∀i
ρL j × DL j +
∀j
∀j
ρH j × DH j ,
(18)
where ρLk and ρHk are the constants, which are used to weight
the distortion between L and H subbands, respectively. With
the assumption that the distortion is equally distributed [21],
the total distortion can be simplified as
DX2i+1 = DL ×
DX2i +
∀i
∀i
ρL j + DH ×
∀j
ρH j .
∀j
(19)
Using (17) as the representation of DL and DH , we obtain
−γ
DL = ω1,L × αL × e−βL ×RL + ω2,L × ηL × RL L ,
−γ
DH = ω1,H × αH × e−βH ×RH + ω2,H × ηH × RH H ,
(20)
where DL and RL are the distortion and the rate of L subband.
DH and RH are the distortion and the rate of H subband.
Let Rtotal be the total rate used to code multiview images,
let Rhd,DV be a number of bits used for coding the disparity
vectors and header information, and let Rtexture be a number
of bits used to code the texture information. We know that
Rtexture = Rtotal − Rhd,DV .
(21)
With the definition of distortion and rate described
above, the problem in allocating bits to L and H subbands
can be formulated as follows.
Problem 1. Given a bit rate constraints Rtexture for coding the
multiview images, find the optimal bit allocation of L and H
subbands such that
⎧
⎨
min⎩DL ×
⎫
⎬
ρLk + DH ×
∀k
∀k
ρHk ⎭,
(22)
8
EURASIP Journal on Advances in Signal Processing
under the constraint
RL ×
bLk + RH ×
∀k
bHk ≤ Rtexture ,
(23)
∀k
where bLk and bHk are the ratios of number of bits in Lk and
Hk subbands.
To facilitate the equations, we define
f (RL , RH ) = DL ×
ρLk + DH ×
ρHk ,
∀k
g(RL , RH ) = RL ×
∀k
bLk + RH ×
∀k
(24)
bHk − Rtexture .
∀k
We reformulate the problem as
min f (RL , RH )
subject to
(25)
Step 1:
Initialize parameter μ > 0 and select the
parameter εμ > 0, θ ∈ (0, 1) and the final stop
tolerance εSTOP . Choose the starting point RL , RH
and s > 0, and evaluate the objective function,
constraints, and their derivatives at RL , RH .
Step 2:
Repeat until E(RL , RH , s; 0) ≤ εSTOP :
(1) Apply sequential quadratic programming
method [24] with trust regions, starting from
(RL , RH , s), to find an approximate
solution (R+ , R+ , s+ ) of (28) satisfying
L
H
E(R+ , R+ , s+ ; μ) ≤ εμ .
L
H
(2) Set μ ← θμ , εμ ← θεμ ,
(RL , RH ) ← (R+ , R+ ), s ← s+ .
L
H
End
Algorithm 1
g(RL , RH ) ≤ 0.
We use a nonlinear programming method [22, 23] to obtain
the optimal solution. Therefore (25) can be written as
⎧
⎨
m
min⎩ f (RL , RH ) − μ ×
(i)
i=1
⎫
⎬
ln s ⎭
E RL , RH , s; μ = max
(26)
subject to
The approximate solution (RL , RH , s) satisfying E(RL , RH ,
s; μ) ≤ εμ , where E measures the closeness to the optimal
solution, is defined by [23]
∇ f (RL , RH ) + G(RL , RH )
Sλ − μe
g(RL , RH ) + s = 0,
where μ > 0 is the barrier parameter and the vector of slack
variable s = (s(1) , . . . , s(m) )T is assumed to be positive.
To compute the optimal bit rate allocation of L and H
subbands, we set up a cost function based on the Lagrangian
cost function as
J(RL , RH , s, λ)
⎛
= f (RL , RH ) − ⎝μ ×
m
g(RL , RH ) + s
∞
,
(30)
where ∞ is L∞ -norm. The tolerance εμ is decreased from
one iteration to the next and must converge to zero. The
parameters μ and εμ will be reduced by a constant factor
θ ∈ (0, 1).
Now, the optimal solution of RL and RH can be derived.
The algorithm [23] is described in Algorithm 1.
5. Experimental Results
⎞
ln s(i) ⎠ + λT × g(RL , RH ) + s ,
i=1
(27)
where λ ∈ Rm are the Lagrange multipliers.
To obtain the optimal solution (RL , RH , s) of (27), we take
partial derivative of (27) respective to RL and RH and we will
obtain
∇RL ,RH J(RL , RH , s, λ) = ∇ f (RL , RH ) + G(RL , RH ) × λ = 0,
∇S J(RL , RH , s, λ) = −μ × S−1 × e + λ = 0,
(28)
where
G(RL , RH ) = ∇g (1) (RL , RH ), . . . , ∇g (m) (RL , RH )
∞,
∞,
(29)
is the matrix of constraint gradients, in which superscripts
indicating components of a vector, e = [1, . . . , 1]T , and S =
diag(s(1) , . . . , s(m) ). ∇ is a derivative operator.
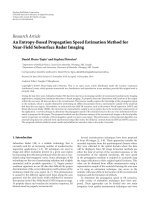
In this section, we present a sequence of experimental results
to analyze distortion and bit allocation of multiview images.
We use several test multiview images [25] including Tsukuba,
Teddy, Venus, and Race1 [26]. Each set of multiview images
is composed of 5 image views. The disparity compensation
is done in the macroblock level with the size of 16 ×
16 pixels. The residue error after the disparity compensation
is encoded by SPIHT codec [8]. We utilize the 5/3 wavelet lifting for disparity compensation to demonstrate the developed
distortion model and the bit rate allocation.
5.1. Model Accuracy. First, we verify the accuracy of the
proposed rate distortion model. We assume that wavelet
coefficients obtained from the disparity wavelet lifting have
a Laplacian distribution [27]. In our experiments, the actual
distortion of reconstructed images is computed for the
specific bit rates. Then, we compute the distortion of each
specific bit rate from different models (using (15), (16),
and (17)) with the same set of bit rate. Figure 6 show the
comparison of the accuracy of the proposed rate-distortion
EURASIP Journal on Advances in Signal Processing
9
Table 3: The average of the mean square error (MSE) between the actual distortion and the computed distortion of different rate distortion
models.
Average MSE (Mean Square Error)
Power model
Images
Subbands
Tsukuba
L
H
2725.079
16.963
4009.917
6.844
79.747
2.393
Teddy
L
H
2702.424
4.404
5378.732
4.517
161.205
0.7153
Venus
L
H
2758.407
7.2376
8469.384
4.4242
435.03
1.8295
Exponential model
Proposed model
Table 4: Comparison of subband bit allocation at target bit rate 0.95 bpp.
Test images
Tsukuba
Uniform allocation
RLk (bpp)
RHk (bpp)
PSNR (dB)
Exponential model
Power model
Proposed
Exhaustive search
0.95
0.95
36.907
1.462503
0.181246
38.6491
1.436343
0.220485
38.8251
1.377565
0.308653
39.040
1.35
0.350
39.1678
RLk (bpp)
0.95
1.515464
1.316667
1.414911
1.3967
RHk (bpp)
PSNR (dB)
0.95
34.383
0.101804
36.21824
0.4
36.20671
0.252633
36.43267
0.280
36.4482
Venus
RLk (bpp)
RHk (bpp)
PSNR (dB)
0.95
0.95
34.7772
1.5072
0.1142
36.75062
1.30173
0.4224
36.59987
1.6333
0.33
36.82036
1.392667
0.286
36.8684
Race1
RLk (bpp)
RHk (bpp)
0.95
0.95
1.460413
0.18438
1.183333
0.6
1.388267
0.2926
1.360667
0.334
PSNR (dB)
41.4842
41.8316
42.1802
42.3751
42.4426
Teddy
model, exponential model, and power model with the actual
rate distortion curves of H subband and L subband, when
Tsukuba, Teddy, and Venus are used as test images. We can
see that the proposed model outperforms the exponential
and power models in fitting the rate-distortion curve. Notice
that the actual rate-distortion curves of H0 and H1 as well
as the actual distortion curves of L0 and L1 are close to each
other, which verifies the assumption of equally distributed of
distortion in Section 3, when the cameras capturing different
image views are not shifted significantly from one another.
Table 3 shows the average of the mean square error (MSE)
between the actual distortion and the computed distortion
of different models (range from 0.05 bpp ∼ 1.2 bpp for
H subband and 0.1 bpp ∼ 2.0 bpp for L subband). The
proposed model gives the minimum MSE comparing to the
exponential and power models.
5.2. Bit Allocation Performance. Next, we examine the use
of the proposed algorithm in a rate allocation problem. The
solution of this rate allocation problem will be used to encode
the H and L subbands of multiview images using SPIHT
codec. Table 4 shows the comparison on the rate allocation
performance comparing the proposed rate distortion model,
the exponential model, the power model, the uniform rate
allocation, and the exhaustive search rate allocation. The
exhaustive search is considered as the best solution. For the
exhaustive search, we start with 0.002 bit per pixel and the
increment step size is 0.002 bit per pixel. The target bit rate
is set to be 0.95 bit per pixel (bpp). As we can see from
Table 4, rate allocation using our proposed rate distortion
model gives a very close result to the exhaustive search in
various test images. Moreover, it outperforms the uniform
rate allocation and also uniform rate allocation based on
the normalized energy (i.e., proportionally allocate bits to
subbands based on their energies) of L and H subbands in
terms of average PSNR in the range of 1 ∼ 2 dB and 0.2 ∼
0.6 dB comparing with the exponential and power models.
Figures 7 and 8 show the average Peak-Signal-to-Noise Ratio
(PSNR) of the reconstructed multiview images of Tsukuba
and Teddy images over a wide range of target bit per pixel.
The results in the log-log domain of the average PSNR [28]
of the reconstructed images are also shown in Figures 9 and
10. We also computed the average gains using the method in
[28]. As the results, the proposed method gives 1.7 ∼ 2 dB
average gains over the uniform bit allocation, 0.3 ∼ 1.4 dB
for the uniform bit allocation with normalized energy, and
0.2 ∼ 0.3 dB average gains over the power and exponential
models, respectively. An example of the reconstructed signal
(H and L subbands) of Tsukuba image is shown in Figure 11.
We conclude from the results that the proposed ratedistortion model provides much closer average PSNR results
to those using the exhaustive search than the exponential and
power models. It also gives significant improvement over the
uniform bit allocation almost 2 dB.
10
EURASIP Journal on Advances in Signal Processing
Comparison of average PSNR of Tsukuba test image
Comparison of average PSNR of Tsukuba test image
40
38
38
36
36
34
40
39.4
38.8
38.2
37.6
37
0.8 0.85 0.9 0.95 1 1.05 1.1
32
30
28
26
24
0
0.1 0.2 0.3 0.4 0.5 0.6 0.7 0.8 0.9
Rate (bpp)
Uniform allocation
Uniform (normalised energy)
Exponential model
1
PSNR (dB)
42
40
PSNR (dB)
42
34
30
28
26
24
1.1 1.2
43
Power model
Proposed
Exhaustive search
Figure 7: PSNR comparison of Tsukuba test image when using
different bit allocation methods.
44
47.5
48
48.5
45
46
47
48
10 × log (number of bit-per-view)
49
Power model
Proposed
Exhaustive search
Uniform allocation
Uniform (normalised energy)
Exponential model
Figure 9: PSNR comparison of Tsukuba test image as in Figure 7
using method in [28].
Comparison of average PSNR of Teddy test image
40
Comparison of average PSNR of Teddy test image
40
38
38
36
34
34
PSNR (dB)
36
PSNR (dB)
40
39.4
38.8
38.2
37.6
37
47
32
32
37.6
30
37
36.4
28
35.8
26
35.2
34.6
0.8 0.85 0.9 0.95 1
24
0
0.1
0.2
0.3
0.4
0.5 0.6 0.7
Rate (bpp)
Uniform allocation
Uniform (normalised energy)
Exponential model
32
37.6
37
36.4
35.8
35.2
34.6
47
30
28
0.8
0.9
26
1.05 1.1
1
1.2
Power model
Proposed
Exhaustive search
Figure 8: PSNR comparison of Teddy test image when using
different bit allocation methods.
5.3. Complexity. We measure the complexity of 5 different bit
allocation methods using the processing time. The program
was run on the PC with Intel 1.86 GHz CPU and 512 MB
of RAM. For each method, we measure the processing time
in each submodule. The processing time from different
methods is shown in Table 5. The target bit rate is 0.95 bpp.
Note that the processing time of the common modules,
such as disparity estimation and compensation, is not
included in the table since all methods are same. Although,
from Table 5, the model-based methods require additional
processing time for computing 7 actual R-D points and
24
43
44
47.5
48
45
46
47
48
10 × log (number of bit-per-view)
Uniform allocation
Uniform (normalised energy)
Exponential model
48.5
49
Power model
Proposed
Exhaustive search
Figure 10: PSNR comparison of Teddy test image as in Figure 8
using method in [28].
model parameters, SPIHT encoding/decoding process and
synthesis are performed only once. Comparing the proposed
model with other two models, the total processing time is
almost the same even though the proposed model requires
extra time for computing model parameters but it is just a
fraction of second.
On the other hands, the exhaustive search method takes
up much more processing time. In this paper, we use
4750 points for each given bit rate and search for the
allocated bit that gives the best PSNR. This means that the
exhaustive search method requires 4750 times of SPIHT
EURASIP Journal on Advances in Signal Processing
11
(a)
(b)
Figure 11: The reconstructed signal of H (a) and L (b) subbands. H and L subbands are encoded with bit rate 0.14 bpp and 0.74 bpp,
respectively.
Table 5: The processing time of different bit allocation methods. The target bit rate is 0.95 bpp.
Bit allocation methods
Processing time (seconds)
Obtaining 7 actual R-D
points
Computing model
parameters
Obtaining number of bit
SPIHT + Synthesis
to be allocated
Total time
Uniform
—
—
—
48.687
48.678
Power model
101.094
0.240
0.797
50.266
152.397
Exponential model
101.094
0.261
0.750
57.391
159.496
Proposed
101.094
0.501
0.750
53.313
155.658
Exhaustive search
—
—
0.112
68504.500
68504.612
encoding/decoding and synthesis to be processed. From
Table 5, the exhaustive search requires processing time 430
times more than the model-based approach to perform bit
rate allocation to multiview images.
In addition to the processing time, we also analyze the
growth rate of complexity in terms of Big O notation. We
divide the algorithm into two parts: solving optimization
problem and SPIHT encoding. The power and exponential
models use the same optimization algorithm to allocate bits
for L and H subbands and the complexity of the first part of
both models is O(n log(n/ε)), where n is the iteration step
and ε is the tolerance. Thus, the complexity of the combined
model is O(2n log(n/ε)). For the second part, the complexity
of the SPIHT [29] is O(α0 m2 ), where the input image is with
the size of m × m, and α0 is the constant specifying per pixel
complexity of DWT for a wavelet filter of a specific length.
Therefore, the total complexity of the proposed combined
model is O(2n log(n/ε) + α0 m2 ). For the exhaustive search,
the total complexity including SPIHT is O((n!)(α0 m2 )).
6. Conclusion and Future Works
This paper presented the distortion analysis and the bit
allocation framework for multiview image coding with
disparity-compensated wavelet lifting technique. The distortion prediction of multiview image coding is analyzed. The
new rate distortion model combining the exponential and
power models was proposed. Using the derived distortion
and the proposed rate-distortion model, the bit allocation method among subbands was described. Experimental
results showed that the proposed rate-distortion model
can approximate the actual rate-distortion characteristics
of image very well in a wide range of target bit rate.
Moreover, using the proposed rate-distortion model in
the rate allocation problem for coding multiview images
provides close results of the optimal bit allocation and PSNR
to the multiview image coding using the exhaustive search
for the optimal bit rate allocation.
There are several possible future research extensions.
First, the proposed framework can be further extended to
multiview video both in distortion analysis and bit rate
allocation. The framework of distortion analysis and bit
allocation for multiview video will be more complex than
multiview image because we need to consider all video
frames in both the same and different views. Second,
more advance rate distortion models can be considered to
improve the model-based bit allocation to obtain the coding
results as close to the exhaustive search as possible. Third,
12
distortion analysis and bit allocation of multiview image
and video coding using multireference frames (i.e., more
than two frames as used in 5/3 disparity wavelet lifting)
are interesting issues because using multireference frames
can improve the compression ratio of multiview image and
video compression. Finally, the distortion analysis and bit
allocation framework of multiview image and video can be
further investigated in another transform domain such as
DCT domain and in industrial image and video compression
standards such as JPEG-2000 or H.264.
Acknowledgments
This paper is partly supported by Panasonic Singapore Laboratories (SPL) and Faculty of Engineering, King Mongkut’s
University of Technology, Thonburi via National Research
University Research Fund of Thai Government.
References
[1] X. Tong and R. M. Gray, “Coding of multi-view images for
immersive viewing,” in Proceedings of the IEEE International
Conference on Acoustics, Speech and Signal Processing (ICASSP
’00), vol. 4, pp. 1879–1882, Istanbul, Turkey, June 2000.
[2] M. Magnor, P. Ramanathan, and B. Girod, “Multi-view coding
for image-based rendering using 3-D scene geometry,” IEEE
Transactions on Circuits and Systems for Video Technology, vol.
13, no. 11, pp. 1092–1106, 2003.
[3] A. Secker and D. Taubman, “Motion-compensated highly
scalable video compression using an adaptive 3D wavelet
transform based on lifting,” in Proceedings of the IEEE
International Conference on Image Processing (ICIP ’01), vol.
2, pp. 1029–1032, October 2001.
[4] L. Luo, J. Li, S. Li, Z. Zhuang, and Y. Q. Zhang, “Motion
compensated lifting wavelet and its application in video
coding,” in Proceedings of the IEEE International Conference on
Multimedia and Expo (ICME ’01), vol. 2, pp. 365–368, August
2001.
[5] B. Pesquet-Popescu and V. Bottreau, “Three-dimensional lifting schemes for motion compensated video compression,” in
Proceedings of the IEEE International Conference on Acoustics,
Speech and Signal Processing (ICASSP ’01), vol. 3, pp. 1793–
1796, May 2001.
[6] C.-L. Chang, X. Zhu, P. Ramanathan, and B. Girod, “Interview wavelet compression of light fields with disparitycompensated lifting,” in Visual Communications and Image
Processing, vol. 5150 of Proceedings of SPIE, pp. 694–706,
Lugano, Switzerland, July 2003.
[7] B. Girod, C.-L. Chang, P. Ramanathan, and X. Zhu, “Light
field compression using disparity-compensated lifting,” in
Proceedings of the IEEE International Conference on Acoustics,
Speech and Signal Processing (ICASSP ’03), vol. 4, pp. 760–763,
April 2003.
[8] A. Said and W. A. Pearlman, “A new, fast, and efficient image
codec based on set partitioning in hierarchical trees,” IEEE
Transactions on Circuits and Systems for Video Technology, vol.
6, no. 3, pp. 243–250, 1996.
[9] N. Anantrasirichai, C. N. Canagarajah, and D. R. Bull, “Multiview image coding with wavelet lifting and in-band disparity compensation,” in Proceedings of the IEEE International
Conference on Image Processing (ICIP ’05), vol. 3, pp. 33–36,
September 2005.
EURASIP Journal on Advances in Signal Processing
[10] P. Lasang, W. Kumwilaisak, and A. Kaewpunya, “Multiview image coding via image feature matching and adaptive
disparity-compensated wavelet lifting technique,” in Proceedings of the 25th Picture Coding Symposium (PCS ’06), Beijing,
China, April 2006.
[11] Y. Shoham and A. Gersho, “Efficient bit allocation for an
arbitrary set of quantizers,” IEEE Transactions on Acoustics,
Speech, and Signal Processing, vol. 36, no. 9, pp. 1445–1453,
1988.
[12] L.-J. Lin and A. Ortega, “Bit rate control using piecewise
approximated rate-distortion characteristics,” IEEE Transactions on Circuits and Systems for Video Technology, vol. 8, no. 4,
pp. 446–459, 1998.
[13] J. Li, P.-Y. Cheng, and C.-C. J. Kuo, “Embedded wavelet packet
image coder with fast rate-distortion optimized decomposition,” in Visual Communications and Image Processing, vol.
3024 of Proceedings of SPIE, pp. 1077–1088, San Jose, Calif,
USA, February 1997.
[14] N. M. Rajpoot, “Model based optimal bit allocation,” in
Proceedings of the Data Compression Conference (DCC ’04), p.
558, March 2004.
[15] T. G. Cover and J. A. Thomas, Elements of Information Theory,
John Wiley & Sons, New York, NY, USA, 1991.
[16] S. Mallat and F. Falzon, “Analysis of low bit rate image
transform coding,” IEEE Transactions on Signal Processing, vol.
46, no. 4, pp. 1027–1042, 1998.
[17] W. Sweldens, “The lifting scheme: a construction of second
generation wavelets,” SIAM Journal on Mathematical Analysis,
vol. 29, no. 2, pp. 511–546, 1998.
[18] N. Mehrseresht and D. Taubman, “Adaptively weighted update
steps in motion compensated lifting based scalable video compression,” in Proceedings of the IEEE International Conference
on Image Processing (ICIP ’03), vol. 3, pp. 771–774, September
2003.
[19] B. Girod and S. Han, “Optimum update for motioncompensated lifting,” IEEE Signal Processing Letters, vol. 12,
no. 2, pp. 150–153, 2005.
[20] H.-M. Hang and J.-J. Chen, “Source model for transform
video coder and its application—part I: fundamental theory,”
IEEE Transactions on Circuits and Systems for Video Technology,
vol. 7, no. 2, pp. 287–298, 1997.
[21] T. Rusert, K. Hanke, and J.-R. Ohm, “Transition filtering and
optimized quantization in interframe wavelet video coding,”
in Visual Communications and Image Processing, vol. 5150 of
Proceedings of SPIE, pp. 682–693, Lugano, Switzerland, July
2003.
[22] R. H. Byrd, M. E. Hribar, and J. Nocedal, “An interior point
algorithm for large-scale nonlinear programming,” SIAM
Journal on Optimization, vol. 9, no. 4, pp. 877–900, 1999.
[23] R. H. Byrd, J. C. Gilbert, and J. Nocedal, “A trust region
method based on interior point techniques for nonlinear
programming,” Mathematical Programming A, vol. 89, pp.
149–185, 2000.
[24] R. H. Byrd, J. C. Gilbert, and R. A. Tapia, “A trust region
method based on interior point techniques for nonlinear
programming,” Report OTC 96/02, Optimization Technology
Center, Northwestern University, Evanston, Ill, USA, 1996.
[25] />[26] />[27] F. Bellifemine, A. Capellino, A. Chimienti, R. Picco, and
R. Ponti, “Statistical analysis of the 2D-DCT coefficients of
the differential signal for images,” Signal Processing: Image
Communication, vol. 4, no. 6, pp. 477–488, 1992.
EURASIP Journal on Advances in Signal Processing
[28] G. Bjontegaard, “Calculation of average PSNR differences
between RD-curves,” ITU SG16 VCEG-M33, April 2001.
[29] N. Splrjan, S. Grgic, and M. Grgic, “Modified SPIHT algorithm for wavelet package image coding,” Real-Time Imaging,
vol. 11, pp. 378–388, 2005.
13