báo cáo hóa học:" Research Article Analysis of the Effects of Finite Precision in Neural Network-Based Sound Classifiers for Digital Hearing Aids" pot
Bạn đang xem bản rút gọn của tài liệu. Xem và tải ngay bản đầy đủ của tài liệu tại đây (776.19 KB, 12 trang )
Hindawi Publishing Corporation
EURASIP Journal on Advances in Signal Processing
Volume 2009, Article ID 456945, 12 pages
doi:10.1155/2009/456945
Research Article
Analysis of the Effects of Finite Precision in Neural
Network-Based Sound Classifiers for Digital Hearing Aids
Roberto Gil-Pita (EURASIP Member), Enrique Alexandre, Lucas Cuadra
´
(EURASIP Member), Raul Vicen, and Manuel Rosa-Zurera (EURASIP Member)
Departamento de Teor´a de la Se˜ al y Comunicaciones, Escuela Polit´cnica Superior, Universidad de Alcal´ ,
ı
n
e
a
28805 Alcala de Henares, Spain
Correspondence should be addressed to Roberto Gil-Pita,
Received 1 December 2008; Revised 4 May 2009; Accepted 9 September 2009
Recommended by Hugo Fastl
The feasible implementation of signal processing techniques on hearing aids is constrained by the finite precision required to
represent numbers and by the limited number of instructions per second to implement the algorithms on the digital signal
processor the hearing aid is based on. This adversely limits the design of a neural network-based classifier embedded in the hearing
aid. Aiming at helping the processor achieve accurate enough results, and in the effort of reducing the number of instructions per
second, this paper focuses on exploring (1) the most appropriate quantization scheme and (2) the most adequate approximations
for the activation function. The experimental work proves that the quantized, approximated, neural network-based classifier
achieves the same efficiency as that reached by “exact” networks (without these approximations), but, this is the crucial point,
with the added advantage of extremely reducing the computational cost on the digital signal processor.
Copyright © 2009 Roberto Gil-Pita et al. This is an open access article distributed under the Creative Commons Attribution
License, which permits unrestricted use, distribution, and reproduction in any medium, provided the original work is properly
cited.
1. Introduction
This paper focuses on exploring to what extent the use
of a quantized, approximated neural network-(NN-) based
classifier embedded in a digital hearing aid could appreciably
affect the performance of this device. This phrase probably
makes the reader not directly involved in hearing aid design
wonder.
(1) Why do the authors propose a hearing aid capable of
classifying sounds?
(2) Why do they propose a neural network for classifying
(if there are more simple solutions)?
(3) Why do they study the effects associated with quantizing and approximating it? Are these effects so
important?
The first question is related to the fact that hearing
aid users usually face a variety of sound environments. A
hearing aid capable of automatically classifying the acoustic
environment that surrounds his/her user, and selecting
the amplification “program” that is best adapted to such
environment (“self-adaptation”) would improve the user’s
comfort [1]. The “manual” approach, in which the user
has to identify the acoustic surroundings, and to choose
the adequate program, is very uncomfortable and frequently
exceeds the abilities of many hearing aid users [2]. This
illustrates the necessity for hearing aids to automatically
classify the acoustic environment the user is in [3].
Furthermore, sound classification is also used in modern hearing aids as a support for the noise reduction
and source separation stages, like, for example, in voice
activity detection (VAD) [4–6]. In this case, the objective
is to extract information from the sound in order to
improve the performance of these systems. This second
kind of classifiers differs from the first one in how often
the classification is carried out. In the first case, a time
scale of seconds should be enough, since it typically takes
approximately 5–10 seconds for the hearing aid user to move
from one listening environment to another [7], whereas in
2
the second case the information is required in shorter time
slots.
The second question, related to the use of neural networks as the choice classifier, is based on the fact that neural
networks exhibit very good performance when compared to
other classifiers [3, 8], but at the expense of consuming a
significantly high percentage of the available computational
resources. Although difficult, the implementation of a neural
network-based classifier on a hearing aid has been proven to
be feasible and convenient to improve classification results
[9].
Finally, regarding the latter question, the very core of
our paper is motivated by the fact that the way numbers
are represented is of crucial importance. The number of bits
used to represent the integer and the fractional part of a
number have a strong influence on the final performance
of the algorithms implemented on the hearing aid, and an
improper selection of these values can lead to saturations or
lack of precision in the operations of the DSP. This is just
one of the topics, along with the limited precision, this paper
focuses on.
The problem of implementing a neural-based sound
classifier in a hearing aid is that DSP-based hearing aids
have constraints in terms of computational capability and
memory. The hearing aid has to work at low clock rates
in order to minimize the power consumption and thus
maximize the battery life. Additionally, the restrictions
become stronger because a considerable part of the DSP
computational capabilities is already being used for running
the algorithms aiming to compensate the hearing losses.
Therefore, the design of any automatic sound classifier is
strongly constrained to the use of the remaining resources of
the DSP. This restriction in number of operations per second
enforces us to put special emphasis on signal processing
techniques and algorithms tailored for properly classifying while
using a reduced number of operations.
Related to the aforementioned problem arises the one
related to the search for the most appropriate way to
implement an NN on a DSP. Most of the NNs we will be
exploring consist of two layers of neurons interconnected by
links with adjustable weights [10]. The way we represent such
weights and the activation function of the neurons [10] may
lead the classifier to fail.
Therefore, the purpose of this paper is to clearly quantify
the effects of the finite-precision limitations on the performance of an automatic sound classification system for hearing aids, with special emphasis on the two aforementioned
phenomena: the effects of finite word length for the weights
of the NN used for the classification, and the effects of the
simplification of the activation functions of the NN.
With these ideas in mind, the paper has been structured
as follows. Section 2 will introduce the implemented classification system, describing the input features (Section 2.1) and
the neural network (Section 2.2). Section 3 will define the
considered problems: the quantization of the weights of the
neural network, and use of approximations for the activation
functions. Finally, Section 4 will describe the database and
the protocol used for the experiments and will show the
results obtained, which will be discussed in Section 5.
EURASIP Journal on Advances in Signal Processing
2. The System
It basically consists of a feature extraction block and the
aforementioned classifier based on a neural network.
2.1. Feature Extraction. There is a number of interesting
features that could potentially exhibit different behavior
for speech, music, and noise and thus may help the
system classify the sound signal. In order to carry out the
experiments of this paper we have selected a subset of them
that provide a high discriminating capability for the problem
of speech/nonspeech classification along with a considerably
low associated computational cost [11]. This will assist us in
testing the methods proposed in this paper. Note that the
priority of the paper is not to propose these features as the
best ones for all the problems considered in the paper, but
to establish a set of strategies and techniques for efficiently
implementing a neural network classifier in a hearing aid.
We have briefly described the features below for making the
paper stand by itself. The features used to characterize any
sound frame are as follows.
Spectral Centroid. The spectral centroid of the ith frame can
be associated with the measure of brightness of the sound,
and is obtained by evaluating the center of gravity of the
spectrum. The centroid can be calculated by making use of
the formula [12, 13]:
Centroidi =
K
k=1 χi (k) · k
,
K
k=1 χi (k)
(1)
where χi (k) represents the kth frequency bin of the spectrum
at frame i, and K is the number of samples.
Voicewhite. This parameter, proposed in [14], is a measure
of the energy inside the typical speech band (300–4000 Hz)
in respect to the whole energy of the signal:
V 2Wi =
M2
k=M1
K
k=1
χi (k)
χi (k)
2
2
,
(2)
where M1 and M2 are the first and the last index of the bands
that are encompassed in the considered speech band.
Spectral Flux. It is associated with the amount of spectral
changes over time and is defined as follows [13]:
K
Fluxi =
χi (k) − χi−1 (k)
2
.
(3)
k=1
Short Time Energy (STE). It is defined as the mean energy of
the signal within each analysis frame (K samples):
K
STEi =
2
1
χi (k) .
K k=1
(4)
EURASIP Journal on Advances in Signal Processing
3
Finally, the features are calculated by estimating the mean
value and the standard deviation of these measurements for
M different time frames.
⎛
E{Centroidi }
⎜
⎜
⎜
E{V 2Wi }
⎜
⎜
⎜
E{Fluxi }
⎜
⎜
⎜
⎜
E{STEi }
⎜
⎜
x=⎜
⎜ E Centroid2 − E{Centroidi }2
i
⎜
⎜
1/2
⎜
⎜
E V 2Wi2 − E{V 2Wi }2
⎜
⎜
1/2
⎜
⎜
E Flux2 − E{Fluxi }2
i
⎜
⎝
1/2
E STE2 − E{STEi }2
i
⎞
⎟
⎟
⎟
⎟
⎟
⎟
⎟
⎟
⎟
⎟
⎟
1/2 ⎟,
⎟
⎟
⎟
⎟
⎟
⎟
⎟
⎟
⎟
⎟
⎟
⎠
(5)
where, for the sake of simplicity, we label Ei (·) ≡
(1/M) M 1 (·).
i=
It is interesting to note that some of the features depend
on the square amplitude of the input signal. As will be shown,
the sound database includes sounds at different levels, in
order to make the classification system more robust against
these variations.
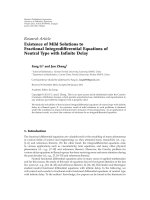
2.2. Classification Algorithm
2.2.1. Structure of a Neural Network. Figure 1 shows a simple
Multilayer Perceptron (MLP) with L = 8 inputs, N = 2
hidden neurons and C = 3 outputs, interconnected by
links with adjustable weights. Each neuron applies a linear
combination of its inputs to a nonlinear function called
activation function. In our case, the model of each neuron
includes a nonlinear activation function (the hyperbolic tangent function), which can be calculated using the following
expression:
f (x) = tanh(x) =
ex − e−x
.
ex + e−x
to the adjustment of the complexity of the network [10]. If
too many free weights are used, the capability to generalize
will be poor; on the contrary if too few parameters are
considered, the training data cannot be learned satisfactorily.
One important fact that must be considered in the
implementation of an MLP is that a scale factor in one of the
inputs (xn = xn k) can be compensated with a change in the
corresponding weights of the hidden layer (vnm = vnm /k, for
m = 1, . . . , L) , so that the outputs of the linear combinations
(am ) are not affected (vnm xn = vnm xn ). This fact is important,
since it allows scaling each feature so that it uses the entire
dynamic range of the numerical representation, minimizing
the effects of the finite precision over the features without
affecting the final performance of the neural network.
Another important property of the MLP is related to
the output of the network. Considering that the activation
function is a monotonically increasing function, if zi > z j ,
then bi > b j . Therefore, since the final decision is taken by
comparing the outputs of the neural network and looking
for the greatest value, once the network is trained there is
no need of determining the complete output of the network
(zi ), being enough to determine the linear combinations of
the output layer (bi ). Furthermore, a scale factor applied
to the output weights (wnc = kwnc , for n = 0, . . . , N and
c = 1, . . . , C) does not affect the final performance of the
network, since if bi > b j , then kbi > kb j . This property allows
scaling the output weights so that the maximum value of wnc
uses the entire dynamic range, minimizing the effects of the
limited precision over the quantization of the output weights.
In this paper, all the experiments have been carried out
using the MATLAB’s Neural Network Toolbox [15], and
the MLPs have been trained using the Levenberg-Marquardt
algorithm with Bayesian regularization. The main advantage
of using regularization techniques is that the generalization
capabilities of the classifier are improved, and that it is
possible to obtain better results with smaller networks, since
the regularization algorithm itself prunes those neurons that
are not strictly necessary.
(6)
From the expression above it is straightforward to see
that implementing this function on the hearing aid DSP
is not an easy task, since an exponential and a division
need to be computed. This motivates the need for exploring
simplifications of this activation function that could provide
similar results in terms of probability of error.
The number of neurons in the input and the output
layers seems to be clear: the input neurons (L) represent
the components of the feature vector and thus, and its
dimension will depend on the number of features used in
each experiment. On the other hand, the number of the
neurons in the output layer (C) is determined by the number
of audio classes to classify, speech, music or noise.
The network also contains one layer of N hidden neurons
that is not part of the input or output of the network. These
N hidden neurons enable the network to learn complex tasks
by extracting progressively more meaningful features from
the input vectors. But, what is the optimum numbers of
hidden neurons N? The answer to this question is related
3. Definition of the Problem
As mentioned in the introduction, there are two different
(although strongly linked) topics that play a key role in the
performance of the NN-based sound classifier, and that constitute the core of this paper. The first one, the quantization
of the NN weights, will be described in Section 3.1, while the
second issue, the feasibility of simplifying the NN activation
function, will be stated in Section 3.2.
3.1. The Quantization Problem. Most of the actual DSPs for
hearing aids make use of a 16-bit word-length Harvard Architecture, and only modern hearing instruments have larger
internal bit range for number presentation (22–24 bits). In
some cases, the use of larger numerical representations is
reserved for the filterbank analysis and synthesis stages, or
to the Multiplier/ACcumulator (MAC) that multiplies 16-bit
registers, and stores the result in a 40-bit accumulator. In this
paper we have focused on this last case, in which we have
4
EURASIP Journal on Advances in Signal Processing
w01
x1
v12
x2
v11
b1
v01
z1
f (·)
v21
x3
x4
x5
v22
v31
v32
f (·)
v41
v42
w21
v81
z2
w22
a2
y2
f (·)
v62
x7
b2
f (·)
v51
v52
v71
w02
w12
v02
v61
x6
y1 w11
a1
v72
w13
w03
w23
b3
v82
z3
f (·)
x8
Figure 1: Multilayer Perceptron (MLP) diagram.
thus 16-bit to represent numbers, and, as a consequence,
there are several 16-bit fixed-point quantization formats.
It is important to highlight that in those modern DSPs
that use larger numerical representations the quantization
problem is minimized, since there are several configurations
that yield very good results. The purpose of our study
is to demonstrate that a 16 bit numerical representation
configured in a proper way can produce considerably good
results in the implementation of a neural classifier.
The way numbers are represented on a DSP is of crucial
importance. Fixed-point numbers are usually represented
by using the so-called “Q number format.” Within the
application at hand, the notation more commonly used is
“Qx.y”, where
(i) Q labels that the signed fixed-point number is in the
“Q format notation,”
(ii) x symbolizes the number of bits used to represent the
2’s complement of the integer portion of the number,
(iii) y designates the number of bits used to represent the
2’s complement of the fractional part of such number.
For example, using a numerical representation of 16 bits,
we could decide to use the quantization Q16.0, which is
used for representing 16-bit 2’s complement integers. Or we
could use Q8.8 quantization, what, in turns, means that 8
bits are used to represent the 2’s complement of the integer
part of the number, and 8 bits are used to represent the
2’s complement of the fractional portion; or Q4.12, which
assigns 4 bits to the integer part, and 12 bits to the fractional
portion and so forth. The question arising here is: What is
the most adequate quantization configuration for the hearing
aid performance?
Apart from this question to be answered later on, there
is also a crucial problem related to the small number of bits
available to represent the integer and the fractional parts of
numbers: the limited precision. Although not clear at first
glance, it is worth noting that a low number of bits for the
integer part may cause the register to saturate, while a low
number of bits in the fractional portion may cause a loss of
precision in the number representation.
3.2. The Problem of Approximating the Activation Function.
As previously mentioned, the activation function in our NN
is the hyperbolic tangent function which, in order to be
implemented on a DSP, requires a proper approximation.
To what extent an approximation f is adequate enough is
a balance between how well it “fits” f and the number of
instructions the DSP requires to compute f .
In the effort of finding a suitable enough approximation,
in this work we have explored 2 different approximations
for the hyperbolic tangent function, f . In general, the way
an approximation, f (x, φ), fits f will depend on a design
parameter, φ, whose optimum value has to be computed
by minimizing some kind of error function. In this paper
we have decided to minimize the root mean square error
(RMSE) for input values uniformly distributed from −5 to
+5:
RMSE f , f = + E
f (x) − f (x)
2
.
(7)
The first practical implementation for approximating
f (x) is, with some corrections that will be explained below,
based on a table containing the main 2n = 256 values of
f (x) = tanh(x). Such approximation, which makes use of
EURASIP Journal on Advances in Signal Processing
5
0.12
⎧
⎪+1,
⎪
⎪
⎪
⎨
fT256 (x) = ⎪tanh x · 2b 2−b ,
⎪
⎪
⎪
⎩−1,
x > 2n−1−b ,
2n−1−b ≥ x ≥ −2n−1−b ,
x < −2n−1−b ,
(8)
with b being a design parameter to be optimized by
minimizing its root mean square error RMSE( f , fT256 ),
making use of the proper particularization of Expression (7).
The “structure” that fT256 approximation exhibits in (8)
requires some comments.
(1) Expression (8) assigns +1 output to those input
values greater than 2n−1−b , and −1 output to those
input values lower than −2n−1−b . With respect to
the remaining input values belonging to the interval
2n−1−b ≥ x ≥ −2n−1−b , fT256 divides such interval
into 2n possible values, whose corresponding output
values have been tabulated and stored in RAM
memory.
(2) We have included in (8), for reasons that will
appear clearer later on, the scale factor 2b , aiming at
determining which are the bits of x that lead to the
best approximation of function f .
(3) The b parameter in the aforementioned scale factor
determines the way fT256 approaches f . Its optimum
value is the one that minimizes the root mean
square error RMSE( f , fT256 ). In this respect, Figure 2
represents the RMSE( f , fT256 ) as a function of the
b parameter, and shows that the minimum value of
RMSE (RMSEmin = 0.0025) is obtained when b =
bopt = 5.4.
(4) Since, for practical implementation, n is an integer
number, we take b = 5 as the closest integer to bopt =
5.4. This leads to RMSE= 0.0035.
(5) The scale factor 25 in Expression (8) (multiplying by
25 ) is equivalent to binary shift x in 5 bits to the left,
which can be implemented using only one assembler
instruction!
As a consequence, implementing the fT256 approximation requires storing 256 memory words, and the following 6
assembler instructions:
(1) shifting 5 bits to the left,
(2) a saturation operation,
(3) a 8-bit right shift,
(4) the addition of the starting point of the table in
memory,
(5) copying this value to an addressing register,
(6) reading the value in the table.
However, in some cases (basically, when the number of
neurons is high), this number of instructions is too long.
Root mean square error (RMSE)
256 tabulated values, has been labeled fT256 (x), and, for
reasons that will be explained below, has been defined as
0.1
0.08
0.06
0.04
0.02
0
0
1
2
3
4
5
6
Exponent of the scale factor (b)
7
8
Figure 2: RMSE( f , fT256 ), root mean square error of the tabulatedbase approximation, as a function of the b parameter, the exponent
of the scale factor in its defining Expression (8).
In order to simplify the calculation of this approximated
function, or in other words, to reduce the number of
instructions, we have tested a second approach based on a
piecewise approximation. Taking into account that a typical
DSP is able to implement a saturation using one cycle, we
have evaluated the feasibility of fitting the original activation
function f by using a function, which is based on 3-piece
linear approximation, has been labelled ( f3PLA ), and exhibits
the expression:
⎧
⎪1,
⎪
⎪
⎪
⎪
⎪
⎨
f3PLA (x) = ⎪a · x,
⎪
⎪
⎪
⎪
⎪
⎩−1,
1
x> ,
a
1
1
(9)
≥x≥− ,
a
a
1
x<− ,
a
where subscript “3PLA” stands for “3-piece linear approximation,” and a is the corresponding design parameter, whose
optimum value is the one that optimizes the RMSE( f , f3PLA ).
Regarding this optimization process, Figure 3 shows the
RMSE( f , f3PLA ) as a function of the a parameter. Note that
the a value that makes the RMSE( f , f3PLA ) be minimum
(0.0445) is aopt = 0.769.
The practical point to note here regarding this approximation is that it requires multiplying the input of the
activation function by a, that, in a typical DSP requires, at
least, the following 4 instructions:
(1) copying x into one of the input register of the MAC
unit,
(2) copying the constant value of a into the other input
register,
(3) copying the result of this multiplication into the
accumulator,
(4) a saturation operation.
As a consequence, the minimum number of instructions
required a priori for implementing this approximation is
6
EURASIP Journal on Advances in Signal Processing
0.12
1
0.8
0.6
0.1
0.4
0.09
0.2
f (x)
Root mean square error (RMSE)
0.11
0.08
−0.2
0.07
−0.4
−0.6
0.06
−0.8
0.05
0.04
0.5
0
−1
0.6
0.7
0.8
0.9
Slope of the approximation of the hyberbolic
tangent function (a)
1
Figure 3: Root mean square corresponding to the 3-piece linear
approximation, RMSE( f , f3PLA ), as a function of the a parameter,
the slope in its defining Expression (9).
4, since the saturation operation requires an additional
assembler instruction.
Furthermore, a possible way of reducing even more
the number of instructions required for implementing an
approximation consists in including the term a in the
corresponding weights of the neuron, so that f3PLA (x, a =
0.769) = f3PLA (0.769x, a = 1). So, the additional bonus
achieved consists in that the number of instructions is
drastically reduced to only 1 assembler instruction.
For illustrative purposes, we complete this Section by
having a look at Figure 4. It represents the 2 approximations
considered in the paper: the “tabulated function-based”
function ( fT256 , with b = 5) and the 3-piece linear
approximation with ( f3PLA , with a = 0.769).
4. Experimental Work
Prior to the description of the different experiments we
have carried out, it is worth having a look at the sound
database we have used. It consists of a total of 7340 seconds
of audio, including both speech in quiet, speech in noise,
speech in music, vocal music, instrumental music and noise.
The database was manually labelled, obtaining a total of
1272.5 seconds of speech in quiet, 3637.5 seconds of speech
in music or noise and 2430 seconds of music and noise.
All audio files are monophonic, and were sampled with a
sampling frequency of 16 kHz and 16 bits per sample. Speech
and music files were provided by D. Ellis, and recorded by E.
Scheirer and M. Slaney [16]. This database [17] has already
been used in a number of different works [16, 18–20]. Speech
was recorded by digitally sampling FM radio stations, using
a variety of stations, content styles and levels, and contains
samples from both male and female speakers. The sound files
present different input levels, with a range of 30 dB between
the lowest and the highest, which allows us to test the
−3
−2
−1
0
x
1
2
3
Tabulated hyperbolic tangent
Line-based approximation
Figure 4: Representation of the considered activation functions.
tabulated hyperbolic function and line-based approximation.
robustness of the classification system against different sound
input levels. Music includes samples of jazz, pop, country,
salsa, reggae, classical, various nonWestern styles, various
sorts of rock, and new age music, both with and without
vocals. Finally, noise files include sounds from the following
environments: aircraft, bus, cafe, car, kindergarten, living
room, nature, school, shop, sports, traffic, train, and train
station. These noise sources have been artificially mixed with
those of speech files (with varying degrees of reverberation)
at different Signal to Noise Ratios (SNRs) ranging from 0 to
10 dB. In a number of experiments, these values have been
found to be representative enough regarding the following
perceptual criteria: lower SNRs could be treated by the
hearing aid as noise, and higher SNRs could be considered
as clean speech.
For training, validation, and testing, it is necessary for the
database to be divided into three different sets. 2685 seconds
(≈36%) for training, 1012.5 seconds (≈14%) for validation,
and 3642.5 seconds (≈50%) for testing. This division has
been done randomly, ensuring that the relative proportion of
files of each category is preserved for each set. The training
set is used to determine the weights of the MLP in the
training process, the validation set helps evaluate progress
during training and to determine when to stop training,
and the test set is used to assess the classifier’s quality after
training. The test set has remained unaltered for all the
experiments described in this paper.
Each file was processed using the hearing aid simulator
described in [21] without feedback. The features were
computed from the output of the Weighted Overlap-Add
(WOLA) filterbank with 128 DFT points and analysis
and synthesis window lengths of 256 samples. So, the
time/frequency decomposition is performed with 64 frequency bands. Concerning the architecture, the simulator
has been configured for a 16-bit word-length Harvard
EURASIP Journal on Advances in Signal Processing
7
Table 1: Mean error probability (%) of different classifiers returning a decision with time slots of 2.5 seconds using 9 quantization schemes:
Qx · y represents the quantization schemes with x bits for the integer part, and y for the fractional one. Regarding the classifiers,MLP K
means Multi-Layer Perceptron with K neurons in the hidden layer. The column labelled “Double” corresponds to the Mean error probability
(%) when no-quantization, double floating point precision has been used. Columns in bold aim at helping the reader focus on the most
relevant result: Q5.11 provides very similar results to those of double precision.
Classifier
MLP 1
MLP 2
MLP 3
MLP 4
MLP 5
MLP 6
MLP 7
MLP 8
MLP 9
MLP 10
MLP 15
MLP 20
MLP 25
MLP 30
MLP 35
MLP 40
No quantization
Double
15.15
10.46
9.84
9.16
8.86
8.55
8.39
8.33
8.34
8.17
8.10
7.93
7.94
7.86
7.95
7.78
Q1.15
55.63
73.43
71.90
74.60
69.08
65.08
65.91
62.37
61.17
62.19
62.03
51.67
61.27
59.31
59.84
59.71
Q2.14
55.30
37.46
38.16
42.41
42.11
35.32
38.18
33.43
34.76
34.27
32.79
29.03
32.75
35.45
32.12
30.78
Q3.13
20.94
15.76
12.25
14.04
13.76
11.07
10.57
9.51
10.45
9.30
9.22
9.42
9.91
10.13
10.02
10.15
Architecture with a Multiplier/ACcumulator (MAC) that
multiplies 16-bit registers and stores the result in a 40-bit
accumulator.
In order to study the effects of the limited precision, two
different scenarios were considered in the experiments. First,
the classifiers were configured for returning a decision every
2.5 seconds. The aim of this study is to determine the effects
of the limited precision over the classifiers for applications
like automatic program switching, in which a large time scale
is used. Second, the classifiers were configured for taking
a decision with time slots of 20 milliseconds. In this case,
the objective is to study the effects of the limited precision
in a classification scenario in which a small time scale is
required like, for example, in noise reduction or sound
source separation applications.
In the batches of experiments we have put into practice,
the experiments have been repeated 100 times. The results
we have illustrated below show the average probability of
classification error for the test set and the computational
complexity in number of assembler operations needed
to obtain the output of the classifier. The probability of
classification error represents the average number of time
slots that are misclassified in the test set.
It is important to highlight that in a real classification
system the classification evidence can be accumulated across
the time for achieving lower error rates. This fact makes
necessary a study of the tradeoff between the selected
time scale, the integration of decision for consecutive time
slots, the performance of the final system and the required
computational complexity. This analysis is out of the scope
of this paper, since our aim is not to propose a particular
Quantization scheme
Q4.12
Q5.11
Q6.10
15.16
15.21
15.30
10.47
10.47
10.48
9.88
9.85
9.86
9.26
9.17
9.20
8.92
8.86
8.92
8.58
8.54
8.58
8.40
8.40
8.46
8.33
8.34
8.41
8.53
8.34
8.35
8.18
8.19
8.26
8.11
8.11
8.18
7.92
7.92
7.97
7.94
7.94
8.01
7.92
7.87
7.91
7.99
7.95
8.01
7.77
7.74
7.82
Q7.9
15.79
10.88
10.21
9.67
9.58
9.27
9.41
8.98
9.11
8.96
8.96
8.85
8.98
8.73
8.85
8.74
Q8.8
23.33
15.55
16.76
16.95
17.75
17.13
18.84
17.31
17.76
17.76
17.36
18.17
17.96
17.46
17.81
17.72
Q9.7
36.28
36.63
44.69
46.71
40.56
41.99
42.45
44.01
43.88
43.06
40.41
44.11
41.69
42.52
43.47
41.27
classification system, that must be tuned for the considered
hearing aid application, but to illustrate a set of tools
and strategies that can be used for determining the way
a neural network can be efficiently implemented in real
time for sound environment classification tasks with limited
computational capabilities.
4.1. Comparing the Quantization Schemes. The objective of
this first set of experiments is to study the effects of the
quantization format, Qx.y, used for representing both the
signal describing features and the weights of the neural network.
In this experimental work, aiming at clearly distinguishing
the different phenomena involved, the activation function
used in the neural network is the original hyperbolic
tangent function, f . The influence of using some of the
aforementioned approximation of f has also been explored
in a novel sequence of experiments whose results will be
explained in Section 4.2.
Tables 1 and 2 show the average probability of error (%)
obtained in the 100 runs of the training process for a variety
of multilayer perceptrons (MLPs) with different numbers
of hidden neurons, for time slots of 2.5 seconds and 20
milliseconds, respectively. In these tables, MLP K labels that
the corresponding NN is an MLP with K neurons in the
hidden layer. These batches of experiments have explored a
numbers of hidden neurons ranging from 1 to 40. Aiming at
clearly understanding the effect of the different quantization
schemes, we have also listed the average probability of
error computed with no-quantization, double floating point
precision. These have been labeled in Tables 1 and 2 by using
the header “double.”
8
EURASIP Journal on Advances in Signal Processing
Table 2: Mean error probability (%) of different classifiers returning a decision with time slots of 20 milliseconds using 9 quantization
schemes: Qx · y represents the quantization schemes with x bits for the integer part, and y for the fractional one. Regarding the classifiers,MLP
K means Multi-Layer Perceptron with K neurons in the hidden layer. The column labelled “Double” corresponds to the Mean error
probability (%) when no-quantization, double floating point precision has been used. Columns in bold aim at helping the reader focus
on the most relevant result: Q5.11 provides very similar results to those of double precision.
Classifier
MLP 1
MLP 2
MLP 3
MLP 4
MLP 5
MLP 6
MLP 7
MLP 8
MLP 9
MLP 10
MLP 15
MLP 20
MLP 25
MLP 30
MLP 35
MLP 40
No quantization
Double
36.36
27.44
26.11
24.61
23.07
22.18
21.50
21.07
20.55
20.80
19.74
19.54
19.49
19.47
19.44
19.49
Q1.15
44.05
42.88
45.86
50.66
50.91
55.34
53.69
54.80
56.32
58.96
61.13
62.85
62.54
63.99
64.87
62.67
Q2.14
41.25
33.10
44.42
51.47
46.39
51.77
49.61
52.90
50.24
52.28
56.33
57.45
57.30
57.14
56.70
55.06
Q3.13
37.24
28.28
37.05
41.38
39.42
45.29
44.22
47.81
47.41
49.60
52.93
53.50
53.40
51.93
52.14
49.96
Quantization scheme
Q4.12
Q5.11
Q6.10
36.36
36.36
36.42
27.45
27.46
27.88
31.23
26.60
27.43
30.18
24.93
26.52
28.25
23.45
27.07
30.43
23.43
27.17
28.74
22.35
26.53
26.42
21.95
25.54
26.81
21.75
23.44
28.18
22.30
23.71
30.14
20.83
21.48
29.36
20.19
20.94
30.97
20.36
20.90
31.53
20.25
20.61
32.19
20.94
20.41
29.78
20.29
20.37
(i) Those quantization formats with a low number of
bits for representing the integer part, such as, for
example, Q2.14, finally lead to an increase in the
error probability when compared to those computed
with double precision. This increase is caused by
saturations of the features and weights of the neural
networks.
Q8.8
41.79
46.19
49.26
54.79
57.32
54.45
54.37
53.47
53.16
52.84
51.28
49.57
49.88
48.82
45.07
46.32
Q9.7
60.16
60.96
61.56
62.17
65.41
62.82
63.40
61.41
60.83
61.20
63.11
61.71
63.60
61.23
60.02
61.19
103
102
(ii) On the other hand, the use of a low number of bits for
the fractional portion causes an increase in the error
probability, basically arising from the loss of precision
in the numerical representation.
These facts illustrate the need for a tradeoff between
integer and fractional bits. For the sake of clarity, Figure 5
shows the average relative increase in the error probability
with respect to the use of double precision, as a function of
the number of bits of the fractional portion. Computing this
relative increase has required the use of those results obtained
when using all the classifiers listed in Tables 1 and 2, and the
average computed from
I = 100 · E
PQi. j − Pdouble
(%),
Pdouble
(10)
where E{·} represents the mean value of the probabilities
involving all the number of neurons considered. Note
that the lower relative increase is achieved by the Q5.11
quantization scheme, for both time slot configurations. This
Relative increase (%)
Tables 1 and 2 supply some important pieces of useful
information:
Q7.9
37.11
32.21
36.97
36.60
41.88
39.41
39.00
36.53
36.77
36.65
32.83
30.47
30.20
28.93
26.69
27.67
101
100
10−1
10−2
7
8
9
10
11
12
13
Number of bits of the fractional portion
14
15
Files of 2.5 s
Files of 2.5 ms
Figure 5: Average relative increase (%) in the probability of error
for the classifiers studied in this paper.
is the reason by which the Q5.11 quantization format has
been selected for the remaining experiments of the paper.
4.2. Comparing the Approximation of the Activation Functions.
The purpose of this second batch of experiments consists in
quantitatively evaluating the fitness of the approximations
EURASIP Journal on Advances in Signal Processing
9
Table 3: Mean error probability (%) and number of simple operations required for computing the activation function approximations when
using neural networks with different activation functions: the “tabulated function-based” function ( fT256 , with b = 5) and the 3-piece linear
approximation with ( f3PLA , with a = 0.769). MLP X means that the multilayer perceptron under study contains X hidden neurons.
NN
MLP 1
MLP 2
MLP 3
MLP 4
MLP 5
MLP 6
MLP 7
MLP 8
MLP 9
MLP 10
MLP 15
MLP 20
MLP 25
MLP 30
MLP 35
MLP 40
fT256
15.22
10.49
9.86
9.18
8.91
8.56
8.45
8.38
8.33
8.23
8.13
7.94
7.97
7.85
8.00
7.76
Mean error probability (%)
Files of 2.5 s.
Files of 20 ms.
Approximation
Approximation
f3PLA
fT256
f3PLA
24.14
36.36
44.32
11.61
27.57
30.46
11.16
26.84
29.15
11.37
25.48
32.19
10.79
24.30
35.17
10.78
24.49
40.16
11.20
23.38
40.35
10.92
22.90
41.59
10.82
22.34
40.23
11.10
22.84
39.25
10.63
21.12
35.70
10.58
20.45
33.20
10.44
20.57
31.99
10.39
20.46
31.82
10.17
21.14
31.48
10.55
20.46
31.53
explored in the paper: the “tabulated function-based” function ( fT256 , with b = 5) and the 3-piece linear approximation
with ( f3PLA , with a = 0.769). The quantization scheme we
have used in this experimental work is Q5.11 because, as
stated in Section 4.1, it is the one that makes the different
classifiers achieve very similar results as those obtained when
no quantization (double precision) is used.
Table 3 shows the error probability corresponding to
MLPs (ranging from 1 to 40 hidden neurons) that make
use of the aforementioned approximations, for files of
2.5 seconds and 20 milliseconds, respectively. A detailed
observation of Table 3 leads to the following conclusions.
(i) The “tabulated function-based” approximation,
fT256 , makes the NNs achieve very similar results to
those obtained when using the original hyperbolic
tangent function, f , for the case of files of 2.5
seconds (average relative increase of 0.30%), and an
average relative increase of 5.91%, for the case of
files of 20 milliseconds. The way to note this consists
in comparing the mean error probabilities listed
on column Q5.11 in Tables 1 and 2 (in which the
activation function has not yet been approximated)
with those corresponding to columns “ fT256 ” in
Table 3.
Assembler instructions
fT256
24
42
60
78
96
114
132
150
168
186
276
366
456
546
636
726
Approximation
f3PLA
19
32
45
58
71
84
97
110
123
136
201
266
331
396
461
526
the original hyperbolic tangent function, f , mainly for the
case of files of 2.5 seconds.
Another extremely important point to note is that both
the considered approximations for the activation function
and the number of neurons are related to the number of
assembler instructions needed to implement the classification
system in the hearing aid. In this respect, Table 3 also shows
the number of instructions for the different MLP K classifiers
(K being the numbers of hidden neurons) as a function of
the approximation for the hyperbolic tangent function ( fT256
and f3PLA ).
4.3. Improving the Results by Retraining the Output Weights.
As can be shown from the results obtained in the previous
section, the use of approximated activation functions reduces
the number of assembler instructions needed to implement
the classifier. Even though this is a positive fact, the use
of approximation for the activation functions may cause
the classifier to slightly reduce its efficiency. Aiming at
overcoming this, we have carried out a novel sequence of
experiments, which consists in what follows.
(ii) The use of the 3-piece linear approximation, f3PLA ,
leads to an average relative increase in the probability
of error of 29.88% and 61.27% for files of 2.5 seconds
and 20 milliseconds, respectively.
(1) Train the NN.
(2) Introduce the aforementioned quantization schemes
and the approximations for the activation function.
(3) Recompute the output weights of the network by
taking into account the studied effects related to
quantization schemes and the approximations for the
activation function.
As a conclusion, we can say that the “tabulated functionbased” approximation, fT256 , is a suitable way to approach
Note that training the MLP directly with the quantization
schemes and the approximations for the activation function
10
EURASIP Journal on Advances in Signal Processing
Table 4: Mean error probability (%) and number of simple operations required for computing the activation function approximations when
using neural networks with different activation functions, when the output weights are retrained once the activation function is applied.
fT256
15.20
10.46
9.85
9.16
8.90
8.56
8.44
8.36
8.31
8.19
8.11
7.92
7.96
7.83
7.99
7.75
is not straightforward since the approximations used for the
activation functions are not differentiable at some points, or
their slope is zero. The solution proposed here overcomes
these problems, and makes the process much easier.
Table 4 shows the mean error probability obtained by the
different neural networks once the output weights have been
recomputed. Understanding Table 4 requires to compare
it to Table 3 (in which these have not been recalculated).
From this comparison, we would like to emphasize the
following.
(i) The retrained strategy slightly reduces the error when
the tabulated-approximation is used. Now, fT256
leads to an average relative increase in the probability
of error of 0.13% and 1.94% for files of 2.5 second
and 20 millisecond, respectively, compared to those
obtained when no quantization (double precision) is
used.
(ii) In the case of the 3-piece-based approximation, the
retrained strategy leads to an average relative increase
in the probability of error of 10.36% and 15.08% for
files of 2.5 s. and 20 ms., respectively, compared to
those obtained when double precision is used.
To complete this paper, and in order to compare the
benefits of the proposed retraining strategy with those
results presented in the previous section, Figures 6 and
7 show the relationship between the error rate and the
number of operations for the tabulated-based implementation
and for the line-based implementation with and without
retrained output weights, for files of 2.5 seconds and 20
milliseconds, respectively. Taking into account the limited
Assembler instructions
fT256
24
42
60
78
96
114
132
150
168
186
276
366
456
546
636
726
Approximation
f3PLA
19
32
45
58
71
84
97
110
123
136
201
266
331
396
461
526
12
11.5
11
Probability of error (%)
NN
MLP 1
MLP 2
MLP 3
MLP 4
MLP 5
MLP 6
MLP 7
MLP 8
MLP 9
MLP 10
MLP 15
MLP 20
MLP 25
MLP 30
MLP 35
MLP 40
Mean error probability (%)
Files of 2.5 s.
Files of 20 ms.
Approximation
Approximation
f3PLA
fT256
f3PLA
20.27
36.29
38.76
10.81
27.50
27.85
10.23
26.59
27.25
9.92
25.24
26.36
9.37
23.71
26.42
9.23
23.04
26.85
9.11
22.37
26.27
8.97
21.82
26.49
8.97
21.16
25.55
9.01
21.42
25.59
8.95
20.09
23.82
8.91
19.82
22.96
8.77
19.70
22.39
8.84
19.67
22.21
8.75
19.64
21.92
8.77
19.52
21.64
10.5
10
9.5
9
8.5
8
7.5
7
101
102
Number of operations
MLP T256
MLP lined
103
MLP T256 optimized
MLP lined optimized
Figure 6: Comparative analysis of the relationship between the
error rate and the number of operations for the best methods
studied in the paper.
number of operations per second (low clock rates in order
to minimize power consumption), the results in Figures 6
and 7 demonstrate the effectiveness of the proposed strategy,
especially in the case of time slots of 20 milliseconds, because
it allows to achieve lower error rates with comparable
computational complexity. Furthermore, the use of the linebased approximation is recommended mainly when very
EURASIP Journal on Advances in Signal Processing
11
The different batches of experiments lead to the following
conclusions.
34
Probability of error (%)
32
(i) The Q5.11 quantization scheme has been found to be
exhibiting very similar results to those obtained when
no-quantization, double-precision is used, mainly for
the case of files of 2.5 seconds.
30
28
(ii) The “tabulated function-based” approximation
makes the NNs achieve very similar results to those
obtained when using the original hyperbolic tangent
function for the case of files of 2.5 seconds, and an
average relative increase of 5.91%, for the case of files
of 20 milliseconds.
26
24
22
20
18
101
102
Number of operations
MLP T256
MLP lined
103
MLP T256 optimized
MLP lined optimized
Figure 7: Comparative analysis of the relationship between the
error rate and the number of operations for the best methods
studied in the paper.
low computational complexity (less than 50 instructions) is
required.
5. Conclusions
This paper has been motivated by the fact that the implementation of signal processing techniques on hearing aids
is strongly constrained by (1) the finite precision used
for representing numbers, and (2) the small number of
instructions per second to implement the algorithms on
the digital signal processor the hearing aid is based on.
In this respect, the objective of this paper has been to
quantitatively analyzing these effects on the performance
of neural network-based sound classifiers in digital hearing
aids. Such performance must be a delicate balance between
keeping error classification probability within low values (in
order to not disturb the user’s comfort) and achieving this by
using a small number of instructions per second. The reason
underlying this latter restrictions is that hearing aids have
to work at low clock rates in order to minimize the power
consumption and maximize battery life.
Within this framework, the paper has particularly centered on exploring the following.
(1) the effects of using quantized weights and an approximated activation function for the neurons that
compose the classifier. In particular, we have evaluated 2 different approximations; (1) the “tabulated
function-based” function, based on 256 samples of
the analytical activation function, and (2) the 3-piece
linear approximation,
(2) how to improve the performance by making use of
the information extracted from point 1.
(iii) The use of the 3-piece linear approximation leads to
an average relative increase in the probability of error.
(iv) The retrained strategy reduces the error in average for
all the experiments considered in the paper.
The final, global conclusion is that the quantized, approximated, neural network-based classifier achieves perceptually
the same efficiency as that reached by “exact” networks
(that is, without these approximations), but, and this is
the key point, with the added bonus of extremely reducing
the computational cost on the digital signal processor the
hearing aid is based on.
Acknowledgments
This work has been partially funded by the Comunidad
de Madrid/Universidad de Alcala (CCG06-UAH/TIC-0378,
CCG07-UAH/TIC-1572, CCG08-UAH/TIC-4270) and the
Spanish Ministry of Education and Science (TEC200613883-C04-04/TCM, TEC2009-14414-C03-03). The authors
would like to thank the anonymous reviewers and the
editor for their many helpful suggestions, which have greatly
improved the presentation of this paper.
References
[1] V. Harnacher, J. Chalupper, J. Eggers, et al., “Signal processing
in high-end hearing aids: state of the art, challenges, and future
trends,” EURASIP Journal on Applied Signal Processing, vol.
2005, no. 18, pp. 29152929, 2005.
[2] M. Bă chler, S. Allegro, S. Launer, and N. Dillier, “Sound
u
classification in hearing aids inspired by auditory scene
analysis,” EURASIP Journal on Applied Signal Processing, vol.
2005, no. 18, pp. 29913002, 2005.
[3] M. C. Bă chler, Algorithms for sound classification in hearing
u
instruments, Ph.D. thesis, Swiss Federal Institute of Technology, Zurich, Switzerland, 2002.
[4] M. Marzinzik, Noise reduction schemes for digital hearing aids
and their use for hearing impaired, Ph.D. thesis, Carl von
Ossietzky University, Oldenburg, Germany, 2000.
[5] J. Ram´rez, J. C. Segura, C. Ben´tez, A. de la Torre, and A.
ı
ı
Rubio, “Efficient voice activity detection algorithms using
long-term speech information,” Speech Communication, vol.
42, no. 3-4, pp. 271–287, 2004.
´
[6] J. M. Gorriz, J. Ram´rez, J. C. Segura, and C. G. Punı
tonet, “Improved MO-LRT VAD based on bispectra Gaussian
model,” Electronics Letters, vol. 41, no. 15, pp. 877–879, 2005.
12
[7] P. Nordqvist and A. Leijon, “An efficient robust sound classification algorithm for hearing aids,” Journal of the Acoustical
Society of America, vol. 115, no. 6, pp. 3033–3041, 2004.
[8] E. Alexandre, L. Cuadra, L. Alvarez, L. Alvarez, M. RosaZurera, and F. Lopez-Ferreras, “Automatic sound classification
for improving speech intelligibility in hearing aids using a
layered structure,” in Proceedings of the 7th International Conference Intelligent Data Engineering and Automated Learning
(IDEAL ’06), vol. 4224 of Lecture Notes in Computer Science,
Springer, Burgos, Spain, September 2006.
´
[9] E. Alexandre, L. Cuadra, L. Alvarez, M. Rosa-Zurera, and
F. Lopez-Ferreras, “Two-layer automatic sound classification
system for conversation enhancement in hearing aids,” Integrated Computer-Aided Engineering, vol. 15, no. 1, pp. 85–94,
2008.
[10] R. O. Duda, P. E. Hart, and D. G. Stork, Pattern Classification,
Wiley InterScience, New York, NY, USA, 2001.
[11] E. Alexandre-Cortizo, M. Rosa-Zurera, L. Cuadra, and R. GilPita, “Application of fisher linear discriminant analysis to
speech/music classification,” in Proceedings of the 120th Audio
Engineering Society Convention (AES ’06), vol. 2, pp. 1666–
1669, Paris, France, 2006.
[12] P. Nordqvist, Sound classification in hearing instruments, Ph.D.
thesis, KTH-S3, Stockholm, Sweden, 2004.
[13] J.-J. Aucouturier and F. Pachet, “Representing musical genre: a
state of the art,” Journal of New Music Research, vol. 32, no. 1,
pp. 83–93, 2003.
[14] E. Guaus and B. Eloi, “A non-linear rhythm-based style
classification for broadcast speech-music discrimination,” in
Proceedings of the 116th Audio Engineering Society Convention
(AES ’04), Berlin, Germany, May 2004.
[15] H. Demuth and H. M. Beale, Neural Network Toolbox for Use
with Matlab, Mathworks, Natick, Mass, USA, 1998.
[16] E. Scheirer and M. Slaney, “Construction and evaluation
of a robust multifeature speech/music discriminator,” in
Proceedings of the IEEE International Conference on Acoustics,
Speech and Signal Processing (ICASSP ’97), vol. 2, pp. 1331–
1334, 1997.
[17] E. Scheirer, />scheislan.html.
[18] B. Thoshkahna, V. Sudha, and K. R. Ramakrishnan, “A speechmusic discriminator using HILN model based features,” in
Proceedings of the IEEE International Conference on Acoustics,
Speech and Signal Processing (ICASSP ’06), vol. 5, pp. 425–428,
Toulouse, France, May 2006.
[19] A. L. Berenzweig and D. P. W. Ellis, “Locating singing
voice segments within music signals,” in Proceedings of the
IEEE International Conference on Acoustics, Speech and Signal
Processing (ICASSP ’01), pp. 119–122, Phoenix, Ariz, USA,
2001.
[20] G. Williams and D. P. W. Ellis, “Speech/music discrimination
based on posterior probability features,” in Proceedings of the
6th European Conference on Speech Communication and Technology (EUROSPEECH ’99), Budapest, Hungary, September
1999.
´
[21] R. Vicen-Bueno, R. Gil-Pita, M. Utrilla-Manso, and L. AlvarezP´ rez, “A hearing aid simulator to test adaptive signal proe
cessing algorithms,” in Proceedings of the IEEE International
Symposium on Intelligent Signal Processing (WISP ’07), pp.
619–624, Piscataway, NJ, USA, October 2007.
EURASIP Journal on Advances in Signal Processing