báo cáo hóa học:" Research Article Signal Processing Strategies for Cochlear Implants Using Current Steering" docx
Bạn đang xem bản rút gọn của tài liệu. Xem và tải ngay bản đầy đủ của tài liệu tại đây (2.61 MB, 20 trang )
Hindawi Publishing Corporation
EURASIP Journal on Advances in Signal Processing
Volume 2009, Article ID 531213, 20 pages
doi:10.1155/2009/531213
Research Article
Signal Processing Strategies for Cochlear Implants Using
Current Steering
Waldo Nogueira, Leonid Litvak, Bernd Edler, J
¨
orn Ostermann, and Andreas B
¨
uchner
Laboratorium f
¨
ur Informationstechnologie, Leibniz Universit
¨
at Hannover, Schneiderberg 32, 30167 Hannove, Germany
Correspondence should be addressed to Waldo Nogueira,
Received 29 November 2008; Revised 19 April 2009; Accepted 22 September 2009
Recommended by Torsten Dau
In contemporary cochlear implant systems, the audio signal is decomposed into different frequency bands, each assigned to one
electrode. Thus, pitch perception is limited by the number of physical electrodes implanted into the cochlea and by the wide
bandwidth assigned to each electrode. The Harmony HiResolution bionic ear (Advanced Bionics LLC, Valencia, CA, USA) has the
capability of creating virtual spectral channels through simultaneous delivery of current to pairs of adjacent electrodes. By steering
the locus of stimulation to sites between the electrodes, additional pitch percepts can be generated. Two new sound processing
strategies based on current steering have been designed, SpecRes and SineEx. In a chronic trial, speech intelligibility, pitch
perception, and subjective appreciation of sound were compared between the two current steering strategies and standard HiRes
strategy in 9 adult Harmony users. There was considerable variability in benefit, and the mean results show similar performance
with all three strategies.
Copyright © 2009 Waldo Nogueira et al. This is an open access article distributed under the Creative Commons Attribution
License, which permits unrestricted use, distribution, and reproduction in any medium, provided the original work is properly
cited.
1. Introduction
Cochlear implants are an accepted and effective treatment
for restoring hearing sensation to people with severe-to-
profound hearing loss. Contemporary cochlear implants
consist of a microphone, a sound processor, a transmitter, a
receiver, and an electrode array that is positioned inside the
cochlea. The sound processor is responsible for decomposing
the input audio signal into different frequency bands and
delivering information about each frequency band to the
appropriate electrode in a base-to-apex tonotopic pattern.
The bandwidths of the frequency bands are approximately
equal to the critical bands, where low-frequency bands have
higher frequency resolution than high-frequency bands. The
actual stimulation to each electrode consists of nonoverlap-
ping biphasic charge-balanced pulses that are modulated by
the lowpass-filtered output of each analysis filter.
Most contemporary cochlear implants deliver interleaved
pulses to the electrodes so that no electrodes are stimulated
simultaneously. If electrodes are stimulated simultaneously,
thereby overlapping in time, their electrical fields add
and create undesirable interactions. Interleaved stimulation
partially eliminates these undesired interactions. Research
shows that strategies using nonsimultaneous stimulation
achieve better performance than strategies using simultane-
ousstimulationofallelectrodes[1].
Most cochlear implant users have limited pitch reso-
lution. There are two mechanisms that can underlie pitch
perception in cochlear implant recipients, temporal/rate
pitch and place pitch [2]. Rate pitch is related to the
temporal pattern of stimulation. The higher the frequency
of the stimulating pulses, the higher the perceived pitch.
Typically, most patients do not perceive pitch changes when
the stimulation rate exceeds 300 pulses per second [3].
Nonetheless, temporal pitch cues have shown to provide
some fundamental frequency discrimination [4] and limited
melody recognition [2]. The fundamental frequency is
important for speaker recognition and speech intelligibil-
ity. For speakers of tone languages (e.g., Cantonese or
Mandarin), differences in fundamental frequency within a
phonemic segment determine the lexical meaning of a word.
It is not surprising, then, that cochlear implant users in
countries with tone languages may not derive the same
benefit as individuals who speak nontonal languages [5].
2 EURASIP Journal on Advances in Signal Processing
Speech intelligibility in noise environments might be limited
for cochlear implant users because of the poor perception
of temporal cues. It has been shown that normal hearing
listeners benefit from temporal cues to improve speech
intelligibility in noise environments [6].
The place pitch mechanism is related to the spatial pat-
tern of stimulation. Stimulation of electrodes located towards
the base of the cochlea produces higher pitch sensations
than stimulation of electrodes located towards the apex.
The resolution of pitch derived from a place mechanism is
limited by the few number of electrodes and the current
spread produced in the cochlea when each electrode is
activated. Pitch or spectral resolution is important when
the listening environment becomes challenging in order to
separate speech from noise or to distinguish multiple talkers
[7]. The ability to differentiate place-pitch information also
contributes to the perception of the fundamental frequency
[4]. Increased spectral resolution also is required to perceive
fundamental pitch and to identify melodies and instruments
[8]. As many as 100 bands of spectral resolution are required
for music perception in normal hearing subjects [7].
Newer sound-processing strategies like HiRes are
designed to increase the spectral and temporal resolution
provided by a cochlear implant in order to improve the
hearing abilities of cochlear implant recipients. HiRes
analyzes the acoustic signal with high temporal resolution
and delivers high stimulation rates [9]. However, spectral
resolution is still not optimal because of the limited
number of electrodes. Therefore, a challenge for new signal
processing strategies is to improve the representation of
frequency information given the limited number of fixed
electrodes. Recently, researchers have demonstrated a way
to enhance place pitch perception through simultaneous
stimulation of electrode pairs [3, 10–12]. This causes a
summation of the electrical field producing a peak of the
overall field located in the middle of both electrodes. It
has been reported that additional pitch sensations can be
created by adjusting the proportion of current delivered
simultaneously to two electrodes [13]. This technique is
known as current steering [7]. As the implant can represent
information with finer spectral resolution, it becomes
necessary to improve the spectral analysis of the audio signal
performed by classical strategies like HiRes.
In addition to simultaneous stimulation of electrodes,
multiple intermediate pitch percepts also can be created
using by sequential stimulation of adjacent electrodes in
quick succession [14]. Electrical models of the human
cochlea and psychoacoustic experiments have shown that
simultaneous stimulation generally is able to produce a
single, gradually shifting intermediate pitch. On the other
hand, sequential stimulation often produces two regions of
excitation. Thus, sequential stimulation often requires an
increase in the total amount of current needed to reach
comfortable loudness, and may lead to the perception of two
pitches or a broader pitch as the electrical field separates into
two regions [15].
The main goal of this work was to improve speech and
music perception in cochlear implant recipients through
the development of new signal processing strategies that
take advantage of the current-steering capabilities of the
Advanced Bionics device. These new strategies were designed
to improve the spectral analysis of the audio signal and to
deliver the signal with greater place precision using current
steering. The challenge was to implement the experimental
strategies in commercial speech processors so that they could
be evaluated by actual implanted subjects. Thus a significant
effort was put into executing the real-time applications in
commercial low power processors. After implementation,
the strategies were assessed using standardized tests of pitch
perception and speech intelligibility and through subjective
ratings of music appreciation and speech quality.
The paper is organized as follows. Section 2 describes
the commercial HiRes and two research strategies using
current steering. Section 3 details the methods for evalu-
ating speech intelligibility and frequency discrimination in
cochlear implant recipients using the new strategies. Sections
4, 5,and6 present the results, discussion, and conclusions.
2. Methods
2.1. The High Resolution Strategy (HiRes). The HiRes strat-
egy is implemented in the Auria and Harmony sound
processors from Advanced Bionics LLC. These devices can
be used with the Harmony implant (CII and the HiRes90k).
In HiRes, an audio signal sampled at 17400 Hz is pre-
emphasized by the microphone and then digitized. Adaptive
gain control (AGC) is performed digitally using a dual-
loop AGC [16]. Afterwards the signal is broken up into
frequency bands using infinite impulse response (IIR) sixth-
order Butterworth filters. The center frequencies of the filters
are logarithmically spaced between 350 Hz and 5500 Hz. The
last filter is a high-pass filter whose bandwidth extends up to
the Nyquist frequency. The bandwidth covered by the filters
will be referred to as subbands or frequency bands. In HiRes,
each frequency band is associated with one electrode.
In HiRes, the subband outputs of the filter bank are
used to derive the information that is sent to the electrodes.
Specifically, the filter outputs are half-wave rectified and
averaged. Half-wave rectification is accomplished by setting
to 0 the negative amplitudes at the output of each filter band.
The outputs of the half-wave rectifier are averaged for the
duration T
s
of a stimulation cycle. Finally, the “Mapping”
block maps the acoustic values obtained for each frequency
band into current amplitudes that are used to modulate
biphasic pulses. A logarithmic compression function is used
to ensure that the envelope outputs fit the patient’s dynamic
range. This function is defined for each frequency band or
electrode z (z
= 1, , M) and is of the form presented in the
following equation:
Y
z
X
Filt
z
=
(
MCL
(
z
)
−THL
(
z
))
IDR
×
X
Filt
z
−m
sat
dB
+12+IDR
+THL
(
z
)
z
= 1, , M,
(1)
where Y
z
is the (compressed) electrical amplitude, X
Filt
z
is the
acoustic amplitude (output of the averager) in dB and IDR is
EURASIP Journal on Advances in Signal Processing 3
the input dynamic range set by the clinician. A typical value
for the IDR is 60 dB. The mapping function used in HiRes
maps the MCL at 12 dB below the saturation level m
sat
dB
.The
saturation level in HiRes is set to 20 log
10
(2
15
−1).
In each stimulation cycle, HiRes stimulates all M implant
electrodes sequentially to partially avoid channel interac-
tions. The number of electrodes for the HiRes90k implant
is M
= 16, and all electrodes are stimulated at the same fixed
rate. The maximum channel stimulation rate (CSR) used in
the HiRes90k is 2899 Hz.
2.2. The Spectral Resolution Strategy (SpecRes). The spectral
resolution (SpecRes) strategy is a research version of the
commercial HiRes with Fidelity 120 strategy and, like HiRes
can be used with the Harmony implant. This strategy
was designed to increase the frequency resolution so as to
optimize use of the current steering technique. In [10],
it was shown that cochlear implant subjects are able to
perceive several distinct pitches between two electrodes when
they are stimulated simultaneously. In HiRes each center
frequency and bandwidth of a filter band is associated with
one electrode.
However, when more stimulation sites are created using
current steering, a more accurate spectral analysis of the
incoming sound is required. For this reason, the filter
bank used in HiRes is not adequate and a new signal
processing strategy that enables higher spectral resolution
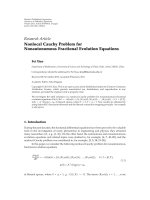
analysis is required. Figure 1 shows the main processing
blocks of the new strategy designed by Advanced Bionics
LLC.
In SpecRes, the signal from the microphone is first pre-
emphasized and digitized at F
s
= 17400 Hz as in HiRes. Next
the front-end implements the same adaptive-gain control
(AGC) as used in HiRes. The resulting signal is sent through
a filter bank based on a Fast Fourier Transform (FFT).
The length of the FFT is set to L
= 256 samples; this
value gives a good compromise between spectral resolution
(related to place pitch) and temporal resolution (related to
temporal pitch). The longer the FFT, the higher the frequency
resolution and thus, the lower the temporal resolution.
The linearly spaced FFT bins then are grouped into
analysis bands. An analysis band is defined as spectral
information contained in a range allocated to two electrodes.
For each analysis band, the Hilbert envelope is computed
from FFT bins. In order to improve the spectral resolution of
the audio signal analysis, an interpolation based on a spectral
peak locator [17] inside each analysis band is performed.
The spectral peaks are an estimation of the most important
frequencies. The frequency estimated by the spectral peak
locator is used by the frequency weight map and the carrier
synthesis. The carrier synthesis generates a pulse train with
the frequency determined by the spectral peak locator in
order to deliver temporal pitch information. The frequency
weight map converts the frequency determined by the
spectral peak locator into a current weighting proportion
that is applied to the electrode pair associated with the
analysis band.
All this information is combined and nonlinearly
mapped to convert the acoustical amplitudes into electrical
current amplitudes. For each stimulation cycle, pairs of
electrodes associated with one analysis band are stimulated
simultaneously, but the pairs of channels are stimulated
sequentially in order to reduce undesired channel interac-
tion. Furthermore, the order of stimulation is selected to
maximize the distance between consecutive analysis bands
being stimulated. This approach reduces further channel
interaction between stimulation sites. The next section
presents each block of SpecRes in detail.
2.2.1. FFT and Hilbert Envelope. The FFT is performed on
input blocks of L
= 256 samples of the previously windowed
audio signal:
x
w
(
l
)
= x
(
l
)
w
(
l
)
, l = 0, , L −1,
(2)
where x(l) is the input signal and w(l) is a 256-blackman
hanning window:
w
(
l
)
=
1
2
0.42 − 0.5cos
2πl
L
+0.08 cos
4πl
L
+
1
2
0.5 − 0.5cos
2πl
L
l = 0, , L −1.
(3)
The FFT of the windowed input signal can be decomposed
into its real and imaginary components as follows:
X
(
n
)
= FFT
(
x
w
(
l
))
= Re{X
(
n
)
}+ j Im{X
(
n
)
}, n = 0, , L −1,
(4)
where
Re
{X
(
n
)
} X
r
(
n
)
=
1
L
L−1
l=0
x
w
(
l
)
cos
2π
n
L
l
,
Im
{X
(
n
)
} X
i
(
n
)
=
1
L
L−1
l=0
x
w
(
l
)
sin
2π
n
L
l
.
(5)
The linearly spaced FFT bins are then combined to provide
the required number of analysis bands N. Because the
number of electrodes in Harmony implant is M
= 16
electrodes, the total number of analysis bands is N
= M−1 =
15. Table 1 presents the number of FFT bins assigned to each
analysis band and its associated center frequency.
The Hilbert envelope is computed for each analysis band.
The Hilbert envelope for the analysis band z is denoted by
HE
z
and is computed from the FFT bins as follows:
H
r
z
(
τ
)
=
n
end
z
−1
n=n
start
z
X
r
(
n
)
cos
2πnτ
L
−
X
i
(
n
)
sin
2πnτ
L
,
H
i
z
(
τ
)
=
n
end
z
−1
n=n
start
z
X
r
(
n
)
sin
2πnτ
L
−
X
i
(
n
)
cos
2πnτ
L
,
(6)
where H
r
z
and H
i
z
are the real and imaginary parts of the
Hilbert transform, τ is the delay within the window and
n
end
z
= n
start
z
+ N
z
.
4 EURASIP Journal on Advances in Signal Processing
Audio
in
Front
end
A/D
L-fast
Fourier
transform
(FFT)
1
2
L/2
Analysis band 1
Envelope
detection
Spectral
peak locator
Envelope
detection
Spectral
peak locator
Envelope
detection
Spectral
peak locator
Frequency
weight map
Carrier
synthesis
Frequency
weight map
Carrier
synthesis
Frequency
weight map
Carrier
synthesis
Mapping
Mapping
Mapping
T
s
E
1
E
2
E
2
E
3
E
M−1
E
M
Analysis band 2
Analysis band N
.
.
.
.
.
.
.
.
.
.
.
.
Figure 1: Block diagram illustrating SpecRes.
Table 1: Number of FFT bins related to each analysis band and its associated center frequencies in Hz. The FFT bins have been grouped in
order to match the center frequencies of the standard HiRes filterbank used in clinical routine practice.
Analysis band
z
1 2 3 4 5 6 7 8 9 10 11 12 13 14 15
Number of
bins N
z
22122234456781055
Start bin
n
start
z
579101214161923273238455363
Center freqs
f
center
(Hz)
408 544 646 748 884 1020 1190 1427 1700 2005 2379 2821 3330 3942 6491
Specifically, for τ = L/2, the Hilbert transform is
calculated in the middle of the analysis window:
H
r
z
=
n
end
z
n=n
start
z
X
r
(
n
)(
−1
)
n
,
H
i
z
=
n
end
z
n=n
start
z
X
i
(
n
)(
−1
)
n
.
(7)
the Hilbert envelope HE(τ) is obtained from the Hilbert
transform as follows:
HE
(
τ
)
=
H
r
z
(
τ
)
2
+ H
i
z
(
τ
)
2
.
(8)
To implement stimulation at different positions between two
electrodes, each analysis channel can create multiple virtual
channels by varying the proportion of current delivered to
adjacent electrodes simultaneously. The weighting applied to
each electrode is controlled by the spectral peak locator and
the frequency weight map.
2.2.2. Spectral Peak Locator. Peak location is determined
within each analysis band z. For a pure tone within a channel,
spectral peak location should estimate the frequency of the
tone. The frequency resolution obtained with the FFT is
half a bin. A bin represents a frequency interval of F
s
/L Hz.
The maximum resolution that can be achieved is therefore
67.96 Hz. However, it has been shown in [12] that patients
are able to perceive a maximum of around 30 distinct pitch
percepts between pairs of the most apical electrodes. Because
the bandwidth associated with the most apical electrode pair
is around 300 Hz and the maximum resolution is 30 pitch
percepts, the spectral resolution required for the analysis
should be around 10 Hz. This resolution is accomplished
by using a spectral peak locator. Spectral peak location is
computed in two steps. The first step is to determine the FFT
bin within an analysis band with the most energy. The power
e(n) in each bin equals the sum of the squared real and the
imaginary parts of that bin:
e
(
n
)
= X
2
r
(
n
)
+ X
2
i
(
n
)
.
(9)
The second step consists of fitting a parabola around the bin
n
max
z
containing maximum energy in an analysis band z, that
is, e(n
max
z
) ≥ e(n)foralln
/
=n
max
z
in that analysis band.
To describe the parabolic interpolation strategy, a coordinate
EURASIP Journal on Advances in Signal Processing 5
A
1
A
3
A
2
Spectral magnitude
−10
c
1
Peak bin n
max
Interpolated peak
Frequency (bins)
Figure 2: Parabolic fitting between three FFT bins.
system centered at n
max
is defined. e(n
max
−1) and e(n
max
+1)
represent the energy of the two adjacent bins. By taking the
energies in dB, we have
A
1
= 20 log
10
e
n
max
z
−1
,
A
2
= 20 log
10
e
n
max
z
,
A
3
= 20 log
10
e
n
max
z
+1
.
(10)
The optimal location is computed by fitting a generic
parabola
y
f
=
a
f −c
2
+ b,
(11)
to the amplitude of the bin n
max
and the amplitude of the
two adjacent bins and taking its maximum. a, b,andc are
variables and f indicates frequency in Hz.
Figure 2 illustrates the parabolic interpolation [17, 18].
The center point or vertex c gives the interpolated peak
location (in bins). The parabola is evaluated at the three bins
nearest to the center point c:
y
(
−1
)
= A
1
,
y
(
0
)
= A
2
,
y
(
1
)
= A
3
.
(12)
The three samples can be substituted in the parabola defined
in (11). This yields the frequency difference in FFT bins:
c
=
1
2
A
1
−A
3
A
1
−2A
2
+ A
3
∈
−
1
2
,
1
2
,
(13)
and the estimate of the peak location (in bins) is
n
∗
max
z
= n
max
z
+ c.
(14)
If the maximum bin within the channel is not the local
maximum, this can only occur near the boundary of the
channel, the spectral peak locator is placed at the boundary
of the channel.
2.2.3. Frequency-Weight-Map. The purpose of the fre-
quency-weight-map is to translate the spectral peak into
cochlear location. For each analysis band z two weights
are calculated w
z
1
and w
z
2
that will be applied to the two
electrodes forming that analysis band. This can be achieved
using the cochlear frequency-position function [19]
f
= A
(
10
ax
)
,
(15)
f represents the frequency in Hz and x the position in (mm)
along the cochlea. A and a were set to 350 Hz and 0.07,
respectively, considering the known dimensions of the CII
and HiRes90k [20]. The locations associated to the electrodes
were calculated by substitution of its corresponding frequen-
cies in the above equation. The location of each electrode is
denoted by x
z
(z = 1, , M).
The peak frequencies are also translated to positions
using (15). The location corresponding to a peak frequency
in the analysis band z is denoted by x
z
p
. To translate a
cochlear location to weights that will be applied to individual
currents of each electrode, the peak location is substracted
from the location of the first electrode x
z
in a pair (x
z
, x
z+1
).
The weight applied to the second electrode x
z+1
(higher
frequency) of the pair is calculated using the following
equation:
w
z
2
=
x
z
p
−x
z
d
z
,
(16)
and the weight applied to first electrode x
z
of the pair is
w
z
1
=
x
z+1
−x
z
p
d
z
,
(17)
where d
z
is the distance in (mm) between the two electrodes
forming an analysis band, that is,
d
z
=|x
z+1
−x
z
|.
(18)
2.2.4. Carrier Synthesis. The carrier synthesis attempts to
compensate for the low temporal resolution given by the
FFT-based approach. The goal is to enhance temporal pitch
perception by representing the temporal structure of the
frequency corresponding to the spectral peak in each analysis
band. Note that the electrodes are stimulated with a current
determined by the HE at a constant rate determined by the
CSR. The carrier synthesis modulates the Hilbert envelope
of each analysis band with a frequency coinciding with the
frequency of the spectral peak.
Furthermore, the modulation depth (relative amount of
oscillation from peak to valley) is reduced with increasing
frequency as shown in Figure 3.
The carrier synthesis defines the phase variable ph
h,z
for
each analysis band z and frame h, where 0
≤ ph
h,z
≤ CSR−1.
During each frame h, ph
h,z
is increased by the minimum of
the estimated frequency f
max
z
and CSR:
ph
h,z
=
ph
h−1,z
+min
f
max
z
,CSR
mod
(
CSR
)
,
(19)
where f
max
z
= n
∗
max
z
(F
s
/L), h indicates the actual frame, and
mod indicates the modulo operator.
6 EURASIP Journal on Advances in Signal Processing
0
0.5
1
Modulation depth MD( f )
0FR/2FR
Frequency ( f )
Figure 3: Modulation depth as a function of frequency. FR is a
constant of the algorithm equal to 2320 Hz which is the maximum
channel stimulation rate that can be delivered with the implant
using the current steering technique.
The parameter s is defined for each analysis band z as
follows:
s
z
=
⎧
⎪
⎨
⎪
⎩
1, ph
h,z
≤
CSR
2
,
0, otherwise.
(20)
Then, the final carrier for each analysis band z is defined as
c
z
= 1 −s
z
MD
f
max
z
,
(21)
where MD( f
max
z
) is the modulation depth function defined
in Figure 3.
2.2.5. Mapping. ThefinalstepoftheSpecResstrategyisto
convert the envelope, weight, and carrier into the current
magnitude to apply to each electrode pair associated with
each analysis band. The mapping function is defined as in
HiRes (1). For the two electrodes in the pair that comprise
the analysis band; the current delivered is given by
I
z
= Y
z
(
max
(
HE
z
))
w
z
1
c
z
, (22)
I
z+1
= Y
z+1
(
max
(
HE
z
))
w
z
2
c
z
, (23)
where z
= 1, , M −1.
In the above equation, Y
z
and Y
z+1
are the mapping
functions for the two electrodes forming an analysis band,
w
z
1
and w
z
2
are the weights, max(HE
z
) is the largest
Hilbert envelope value that was computed since the previous
mapping operation for the analysis band z,andc
z
is the
carrier.
2.3. The Sinusoid Extraction Strategy (SineEx). The new
sinusoid extraction (SineEx) strategy is based on the general
structure of the SpecRes strategy but incorporates a robust
method for estimating spectral components of audio signals
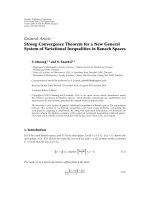
with high accuracy. A block diagram illustrating SineEx is
shown in Figure 4.
The front-end, the filterbank, the envelope detector,
and the mapping are identical to those used in SpecRes
strategy. However, in contrast to the spectral-peak-picking
algorithm performed by SpecRes, a frequency estimator
that uses an iterative analysis/synthesis algorithm selects the
most important spectral components in a given frame of
the audio signal. The analysis/synthesis algorithm models
the frequency spectrum as a sum of sinusoids. Only the
perceptually most important sinusoids are selected using a
psychoacoustic masking model.
The analysis/synthesis loop first defines a source model
to represent the audio signal. The model’s parameters are
adjusted to best match the audio signal. Because of the few
number of analysis bands in the Harmony system (N
= 15),
only a small number of parameters of the source model
can be estimated. Therefore, the most complex task in
SineEx is determining the few parameters that describe the
input signal. The selection of the most relevant components
is controlled by a psychoacoustic masking model in the
analysis/synthesis loop. The model simulates the effect of
simultaneous masking that occurs at the level of the basilar
membrane in normal hearing.
The model estimates which sinusoids are masked the
least to drive the stimulation to the electrodes. The idea
behind this model is to deliver only those signal components
that are most clearly perceived by normal-hearing listeners to
the cochlear implant. A psychoacoustic masking model used
to control the selection of sinusoids in an analysis/synthesis
loop has been shown to provide improved sound quality with
respect to other methods in normal hearing [21].
For example, other applications of this technique, where
stimulation was restricted to the number of physical elec-
trodes, demonstrated that the interaction between chan-
nels could be reduced by selecting fewer electrodes for
stimulation. Therefore, because current steering will allow
stimulation of significantly more cochlear sites compared
to nonsimultaneous stimulation strategies, the masking
model may contribute even further to the reduction of
channel interaction and therefore improve sound perception.
In [22] a psychoacoustic masking model was also used
to select the perceptually most important components
for cochlear implants. One aspect assumed in [22]was
that the negative effects of channel interaction on speech
understanding could be reduced by selecting less bands for
stimulation.
The parameters extracted for the source model are then
used by the frequency weight map and the carrier synthesis
to code place pitch through current steering and to code
temporal pitch by modulating the Hilbert envelopes, just
as in SpecRes. Note that a high-accuracy estimation of
frequency components is required in order to take advantage
of the potential frequency resolution that can be delivered
using current steering.
For parametric representations of sound signals, as in
SineEx, the definition of the source model, the method
used to select the model’s parameters, and the accuracy in
the extraction of these parameters play a very important
role in increasing sound perception performance [21]. The
next sections present the source model and the algorithm
EURASIP Journal on Advances in Signal Processing 7
Audio
in
Front
end
A/D
L-fast
Fourier
transform
(FFT)
1
2
L/2
Analysis band 1
Envelope
detection
Envelope
detection
Envelope
detection
Frequency
weight map
Frequency
estimator
Carrier
synthesis
Nonlinear
map
Nonlinear
map
Nonlinear
map
T
s
E
1
E
2
E
2
E
3
E
M−1
E
M
Analysis band 2
Analysis band M
.
.
.
.
.
.
.
.
.
.
.
.
.
.
.
.
.
.
.
.
.
Analysis/synthesis
Psychoacoustic
masking model
X(n)
Figure 4: Block diagram illustrating SineEx.
used to estimate the model’s parameters based on an
analysis/synthesis procedure.
2.3.1. Source Model. Advanced models of the audio source
are advantageous for modeling audio signals with the fewest
number of parameters. To develop the SineEx strategy, the
source model had to be related to the current-steering
capabilities of the implant. In SineEx, the source model
decomposes the input signal into sinusoidal components.
A source model based on sinusoids provides an accurate
estimation of the spectral components that can be delivered
through current steering. Individual sinusoids are described
by their frequencies, amplitudes, and phases. The incoming
sound x(l) is modeled as a summation of N sinusoids as
follows:
x
(
l
)
≈ x
(
l
)
=
N
i=1
c
i
e
j(2πm
i
l/L+φ
i
)
,
(24)
where x(l) is the input signal,
x(l) is the model of the signal,
c
i
is the amplitude, m
i
is the frequency, and φ
i
is the phase of
the ith sinusoid.
2.3.2. Parameter Estimation for the Source Model. The param-
eters of individual sinusoids are extracted iteratively in an
analysis/synthesis loop [23]. The algorithm uses a dictionary
of complex exponentials s
m
(l) = e
j2πml/L(l−(L−1)/2)
(l =
1, , L)withP elements (m = 1, , P)[24]assource
model. The analysis/synthesis loop is started with the
windowed segment of the input signal x(l)asfirstresidual
r
1
(l):
r
1
(
l
)
= x
(
l
)
w
(
l
)
, l = 0, , L −1,
(25)
where x(l) is the input audio signal and w(l) is the same
blackman-hanning window as in SpecRes (3).
The window w(l) is also applied to the dictionary
elements:
g
m
(
l
)
= w
(
l
)
s
m
(
l
)
= w
(
l
)
e
(j2πm/L)(l−(L−1)/2)
.
(26)
It is assumed that g
m
(l) has unity norm, that is, g
m
(l)=1
for l
= 0, , L −1.
For the next stage, since x(l)andr
i
(l) are real values, the
next residual can be calculated as follows:
r
i+1
(
l
)
= r
i
(
l
)
−c
i
g
m
i
(
l
)
−c
∗
i
g
∗
m
i
(
l
)
.
(27)
The estimation consists of determining the optimal element
g
m
i
(l) and a corresponding weight c
i
that minimizes the
norm of the residual:
minr
i+1
(
l
)
.
(28)
8 EURASIP Journal on Advances in Signal Processing
For a given m the optimal real and imaginary component of
c
i
(c
i
= a
i
+ jb
i
) according to (28) can be found by setting the
partial derivatives of
r
i+1
(l) with respect to a
i
and b
i
to 0:
Δr
i+1
(
l
)
Δa
i
= 0,
Δr
i+1
(
l
)
Δb
i
= 0.
(29)
This leads the following equation system:
⎛
⎜
⎜
⎜
⎝
l
Re
g
m
(
l
)
Re
g
m
(
l
)
l
Re
g
m
(
l
)
Im
g
m
(
l
)
l
Re
g
m
(
l
)
Im
g
m
(
l
)
l
Im
g
m
(
l
)
Im
g
m
(
l
)
⎞
⎟
⎟
⎟
⎠
×
⎛
⎝
2a
−2b
⎞
⎠
=
⎛
⎜
⎜
⎜
⎝
l
Re
g
m
(
l
)
r
i
(
l
)
l
Re
g
m
(
l
)
r
i
(
l
)
⎞
⎟
⎟
⎟
⎠
.
(30)
As the window used is symmetric w(l)
= w(−l), Re{g
m
(l)},
and Im
{g
m
(l)}become orthogonal, that is, the scalar product
between them is 0:
l
Re
g
m
(
l
)
Im
g
m
(
l
)
=
0, ∀l,
(31)
and the previous Equations can be simplified as follows:
a
=
1
2
l
Re
g
m
(
l
)
r
i
(
l
)
l
Re
g
m
(
l
)
Re
g
m
(
l
)
,
b
=
−
1
2
l
Im
g
m
(
l
)
r
i
(
l
)
l
Im
g
m
(
l
)
Im
g
m
(
l
)
.
(32)
The element g
m
i
of the dictionary selected for the ith iteration
is obtained by minimizing
r
i+1
(l).Thisisequivalentto
maximizing c
i
ascanbeobservedin(27). Therefore, the
element selected g
m
i
corresponds to the one having the largest
scalar product with the signal r
i
(l)forl = 0, ,L −1.
Finally, the amplitude c
i
,frequency f
max
i
,andphaseφ
i
for
the ith sinusoid are
c
i
=
a
2
i
+ b
2
i
,
f
max
i
= n
max
i
2π
L
,
φ
i
= arctan
b
i
a
i
.
(33)
2.3.3. Analysis/Synthesis Loop Implementation. The analy-
sis/synthesis algorithm can be efficiently implemented in the
frequency domain [25]. The frequency domain implementa-
tion was used to incorporate the algorithm into the Harmony
system. A block diagram illustrating the implementation is
presented in Figure 5.
The iterative procedure uses as input the FFT spectrum
of an audio signal X(n). The magnitude spectrum
|X(n)|
then is calculated. It is assumed that in the ith iteration
i
− 1 sinusoids already have been extracted and a signal
S
i−1
(n) containing all sinusoids has been synthesized. The
magnitude spectrum
|S
i−1
(n)| is calculated.
The synthesized spectrum is subtracted from the original
spectrum and then weighted by the magnitude masking
threshold I
w
i−1
(n) caused by the sinusoids already synthe-
sized. The detection of the maximum ratio E
n
max
is calculated
as follows:
E
n
max
i
= max
0,
|X
(
n
)
|−|S
i−1
(
n
)
|
I
w
i−1
(
n
)
, n = 0, , L −1,
n
max
i
= arg max
0,
|X
(
n
)
|−|S
i−1
(
n
)
|
I
w
i−1
(
n
)
, n = 0, , L −1,
(34)
where I
w
i
(n) is the psychoacoustic masking model at the ith
iteration of the analysis/synthesis loop. The frequency n
max
i
is used as a coarse frequency estimate of each sinusoid. Its
accuracy corresponds to the FFT frequency resolution.
The spectral resolution of the frequency estimated is
improved using a high accuracy parameter estimation on
the neighboring frequencies of n
max
i
. The high accuracy esti-
mator implements (30) iteratively in the frequency domain.
The algorithm takes first, the positive part of the spectrum
X(n), that is, the analytical signal of x(l). As the algorithm
is implemented in the frequency domain, the dictionary
elements g
m
(l) are transformed into the frequency domain.
If G
0
(n) denotes the Fast Fourier Transform of g
0
(n) = w(l),
the frequency domain representation of the other dictionary
elements can be derived by simple displacement of the
frequency axis G
m
(n) = G
0
(n −m). For this reason, G
0
(n)is
also referred to as “prototype.” Note that as the window w(l)
is known (3), the frequency resolution of the prototype can
be increased just by increasing the length of the FFT used to
transform g
0
(n). Because most of the energy of the prototype
G
0
(l) concentrates in a small number of samples around the
frequency n
= 0, a small section of the prototype is stored.
By reducing the length of the prototype, the complexity of
the algorithm drops significantly in comparison to the time
domain implementation presented in Section 2.3.2.
The solution to (30) is solved iteratively as follows.
In the first iteration (r
= 1), the prototype is centered
on the n
max
i,r
= n
max
i
coarse frequency. A displacement
variable δ
r
is set to 1/2r,wherer indicates the iteration
index. The correlation is calculated at n
max
i,r
−δ
r
, n
max
i,r
,and
n
max
i,r
+ δ
r
. The position leading to maximum correlation
at these three locations is denoted by n
max
i,r+1
. For the next
iteration (r + 1) the value δ
r+1
is halved (δ
r+1
= 1/2(r +1))
and the prototype is centered on n
max
i,r+1
. The correlation
is calculated at n
max
i,r+1
− δ
r+1
, n
max
i,r+1
,andn
max
i,r+1
+ δ
r+1
and the maximum correlation is picked up. This procedure
is repeated several times, and the final iteration gives the
estimated frequency denoted by n
∗
max
i
.
2.3.4. Psychoacoustic Masking Model. The analysis/synthesis
loop of [25] is extended by a simple psychoacoustic model
for the selection of the most relevant sinusoids. The model
EURASIP Journal on Advances in Signal Processing 9
X(n)
|·|
|·|
+
−
+
−
/ max(|·|)
argmax
n
max
i
f
i
Frequency, amplitude,
and phase estimation
f
i
, c
i
, φ
i
Synthesis
Psychoacoustic
masking model
M
i−1
(n)
S
i−1
(n)
|S
i−1
(n)|
|
X(n)|
Figure 5: Frequency domain implementation of the analysis/synthesis loop including a psychoacoustic masking model for extraction and
parameter estimation of individual sinusoids.
is a simplified implementation of the masking model used
in [22]. The effect of masking is modeled using a spreading
masking function L(z). This function has been modeled
using a triangular shape with left slope s
l
, right slope s
r
,and
peak offset a
v
as follows:
L
i
(
z
)
=
⎧
⎨
⎩
HE
dB
i
−a
v
−s
l
·
(
z
i
−z
)
, z<z
i
,
HE
dB
i
−a
v
−s
r
·
(
z
−z
i
)
, z
≥ z
i
.
(35)
The amplitude of the spreading function is derived from
the Hilbert Envelope in decibels HE
dB
i
= 20 log
10
(HE(z))
associated to the analysis band containing the sinusoid
extracted at the iteration i of the analysis/synthesis loop. The
sound intensity I
i
(z) is calculated as
I
i
(
z
)
= 10
L
i
(
z
)
/20
, z = 1, , M.
(36)
The superposition of thresholds is simplified as a linear
addition of thresholds (37) in order to reduce the number
of calculations
I
T
i
(
z
)
=
i
k=0
I
k
(
z
)
, z
= 1, , M.
(37)
The spreading function has been defined in the nonlinear
frequency domain, that is, in the analysis band domain z.As
the sinusoids are extracted in the uniformly spaced frequency
domain of the L-FFT, the masking threshold must be
unwarped from the analysis band domain into the uniformly
spaced frequency domain. The unwarping is accomplished
by linearly interpolating the spreading function without
considering that the two scales have different energy densities
as follows:
I
w
i
(
n
)
= I
T
i
(
z
−1
)
+
(
n − n
center
(
z
−1
))
×
I
T
i
(
z
)
−I
T
i
(
z
−1
)
n
center
(
z
)
−n
center
(
z
−1
)
,
z
= 1, , M, i = 1, , N,
(38)
where M denotes the number of analysis bands, N gives
the number of sinusoids selected, and n
center
(z) is the center
frequency for the analysis band z in bins (see Ta ble 1 ):
n
center
(
z
)
=
n
start
z+1
−n
start
z
2
.
(39)
In normal hearing, simultaneous masking occurs at the level
of the basilar membrane. The parameters that define the
spread of masking can be estimated empirically with normal
hearing listeners. Simultaneous masking effects can be used
in cochlear implant processing to reduce the amount of
data that is sent through the electrode nerve interface [22].
However, because simultaneous masking data is not readily
available from cochlear implant users, the data from normal
hearing listeners were incorporated into SineEx. The choice
of the parameters that define the spread of masking require
more investigation, and probably should be adapted in the
future based upon the electrical spread of masking for each
individual.
The parameters that define the spreading function were
configured to match the masking effect produced by tonal
components [26, 27] in normal hearing listeners, since the
maskers are the sinusoids extracted by the analysis/synthesis
loop. The left slope was set to s
l
= 40 dB/band, the
right slope to s
r
= 30 dB/band, and the attenuation to
a
v
= 15 dB.
SineEx is an N-of-M strategy because only those bands
containing a sinusoid are selected for stimulation. The
analysis/synthesis loop chooses N sinusoids iteratively in
order of their “significance.” The number of virtual channels
activated in a stimulation cycle is controlled by increasing or
decreasing the number of extracted sinusoids N. It should
be noted that the sinusoids are extracted over the entire
spectrum and are not restricted to each analysis band as in
SpecRes. Therefore, in some cases, more than one sinusoid
may be assigned to the same analysis band and electrode
pair. In those situations, only the most significant sinusoid
is selected for stimulation because only one virtual channel
can be created in each analysis band during one stimulation
cycle.
2.4. Objective Analysis: HiRes, SpecRes, and SineEx. Objective
experiments have been performed to test the three strategies:
HiRes, SpecRes, and SineEx. The strategies have been eval-
uated analyzing the stimulation patterns produced by each
strategy for synthetic and natural signals. The stimulation
patterns represent the current level applied to each location
l
exc
along the electrode array in each time interval or frame
h. The total number of locations L
sect
is set to 16000 in
10 EURASIP Journal on Advances in Signal Processing
this analysis. The number of locations associated with each
electrode n
loc
is
n
loc
=
L
sect
M
,
(40)
M indicates the number of electrodes. The location of
each electrode is l
el
z
= (z − 1)n
loc
, z = 1, , M.The
stimulation pattern is obtained as follows. First the total
current produced by two electrodes at the frame h is
calculated
Y
T
z
(
h
)
= Y
z
(
h
)
+ Y
z+1
(
h
)
, z
= 1, , M −1,
(41)
where Y
z
(h)andY
z+1
(h) denote the current applied to the
first and second electrode pairs forming an analysis channel
(22). Then, the location of excitation is obtained as follows:
l
exc
= l
el
z
Y
z
(
h
)
Y
T
z
(
h
)
+ l
el
z+1
Y
z+1
(
h
)
Y
T
z
(
h
)
,
(42)
where l
el
z
and l
el
z+1
denote the location of the first and the
second electrode in a pair forming an analysis channel. Note
that for sequential nonsimultaneous stimulation strategies
Y
z+1
(h) is set to 0 and therefore, the location of excitation
l
exc
coincides with the location of the electrode l
el
z
.Forsequential
stimulation strategies z
= 1, , M. Finally,
l
exc
is rounded to
the first integer, that is, l
exc
= [
l
exc
] and the excitation pattern
S
exc
at frame h and location l
exc
is expressed as
S
exc
(
l
exc
, h
)
= Y
T
z
(
h
)
.
(43)
The first signal used to analyze the strategies was a sweep
tone of constant amplitude and varying frequency from
300 Hz to 8700 Hz during 1 second. The spectrogram of
this signal is shown in Figure 6(a). The sweep tone has
been processed with HiRes, SpecRes, and SineEx and the
stimulation patterns produced by each strategy are presented
in Figures 6(b), 6(c),and6(d),respectively.
In HiRes, the location of excitation always coincides with
the position of the electrodes. However, in SpecRes and
SineEx, the location of excitation can be steered between two
electrodes using simultaneous stimulation.
Moreover, it should be remarked that the frequency
estimation performed by SineEx is more distinct than with
SpecRes. It can be observed from Figure 6(d) that during
the whole signal almost only two neighboring electrodes (1
virtual channel) are being selected for stimulation. This fact
causes that only one virtual channel is used to represent
the unique frequency presented at the input. In the case
of SpecRes (Figure 6(c)), it is shown that more than one
virtual channel is generated to represent a unique sinusoid
in the input signal. This is caused by the simple modeling
approach performed by SpecRes to represent sinusoids. This
fact should cause smearing in pitch perception because
different virtual channels are combined to represent a unique
frequency. White Gaussian noise was added to the same
sweep signal with at total SNR of 10 dB. The stimulation
patterns obtained in noise are presented in Figures 7(b),
7(c),and7(d). Figure 7(b) shows the stimulation pattern
generated by HiRes for the noisy sweep tone. It can be
observed that HiRes mixes both, the noise and the sweep
tone, in terms of place of excitation, as the location of
excitation coincides with the electrodes. This fact should
cause difficulties to separate the tone from the noise.
Figures 7(c) and 7(d) present the stimulation patterns when
processing the noisy sweep tone with SpecRes and SineEx,
respectively. It can be observed that when noise is added,
SpecRes stimulates more times the electrodes than SineEx.
As white Gaussian noise is added, frequency components
are distributed along the whole frequency domain. SpecRes
selects peaks of the spectrum without performing any model
assumption of the input signal, therefore noise components
are treated as if they were pure tone components. This fact
should lead to the perception of tonal signal when in reality
the signal is noisy. SineEx, however, is able to estimate and
track the frequency of the sweep tone as it matches the
sinusoidal model. In contrast, the added white Gaussian
noise does not match the sinusoidal model and those parts of
the spectrum containing noise components are not selected
for stimulation. On the one hand, this test presents the
potential robustness of SineEx in noise situations to represent
tonal or sine-like components. On the other hand, the
experiment shows the limitations of SineEx to model noisy-
like signals like some consonants.
A natural speech signal consisting of a speech token,
where “asa” is uttered by a male voice, has also been
processed with HiRes, SineEx, and SpecRes. Figures 8(b),
8(c),and8(d) present the stimulation patterns obtained for
each strategy.
In HiRes, the location of excitation coincides with the
position of the electrodes. This fact causes a limitation
to code accurately formant frequencies because the spec-
tral resolution with HiRes is limited by the number of
implanted electrodes. It is known that formants play a
key role in speech recognition. The poor representation
of formants with HiRes can be observed comparing the
stimulation pattern generated by HiRes (Figure 8(b))and
the spectrogram presented in Figure 8(a). Using SpecRes,
the formants can be represented with improved spectral
resolution compared to HiRes as the location of excitation
can be varied between two electrodes (Figure 8(c)). However,
the lower accuracy of the method used by SpecRes to
extract the most meaningful frequencies, based on a peak
detector, makes the formants less distinguishable than with
SineEx (Figure 8(d)). SpecRes selects frequency components
without making a model assumption of the incoming sound;
therefore noise and frequency components are mixed causing
possible confusions between them. In SineEx, both “a”
vowels can be properly represented as a sum of sinusoids.
However, the consonant “s” which is a noise-like component
is not properly represented using just a sinusoidal model.
SineEx and SpecRes combine the current steering tech-
nique with a method to improve temporal coding, by adding
the temporal structure of the frequency extracted in each
analysis band. This temporal enhancement was incorporated
to SineEx and SpecRes in order to compensate for the lower
temporal resolution of the 256-FFT used by these strategies
in comparison to the IIR filterbank used by Hires. For this
EURASIP Journal on Advances in Signal Processing 11
1000
2000
3000
4000
5000
6000
7000
8000
Frequency (Hz)
00.20.40.60.8
Time (s)
−60
−40
−20
0
20
(dB)
Spectrogram
(a)
1
2
3
4
5
6
7
8
9
10
11
12
13
14
15
16
Electrode
0.10.20.30.40.50.60.70.80.91
Time (s)
0
50
100
150
CL
HiRes
(b)
1
2
3
4
5
6
7
8
9
10
11
12
13
14
15
16
Electrode
0.10.20.30.40.50.60.70.80.91
Time (s)
0
50
100
150
CL
SpecRes
(c)
1
2
3
4
5
6
7
8
9
10
11
12
13
14
15
16
Electrode
0.10.20.30.40.50.60.70.80.91
Time (s)
0
50
100
150
CL
SineEx
(d)
Figure 6: Stimulation patterns obtained with (b) HiRes, (c) SpecRes, and (d) SineEx in quiet when the input signal is a sweep tone of 1
millisecond of constant amplitude (70 dB) and frequency varying from 300 Hz until 8700 kHz shown in (a). The horizontal axis represents
time in seconds, and the vertical axis represents the electrode location. The level applied in current level (CL) is coded with the colors given
in the color bars. The location of excitation is obtained as presented in Section 2.4.
reason, we assume that a hypothetical improvement of pitch
perception provided by SineEx or SpecRes might be caused
by the current steering technique rather than by the temporal
enhancement technique.
With one final comment from the objective analysis,
as SineEx generally selects less frequencies than SpecRes,
this strategy has the potential to reduce interaction between
channels and significantly reduce power consumption in
comparison to SpecRes. This feature can be confirmed by an
experiment that involves counting the number of channels
being stimulated by HiRes, SpecRes, and SineEx during the
presentation of 50 sentences from a standardized sentence
test [28]. The CSR was set to 2320 stimulations/second for all
three strategies. Ta bl e 2 presents the total number of channels
stimulated by each strategy.
As it can be observed from Ta bl e 2, the number of
stimulations by SpecRes doubles the number of stimulations
performedbyHiRes.However,asSpecResdividesthecurrent
Table 2: Number of stimulations for 50 sentences of the HSM
sentence test [28] with HiRes, SpecRes, and SineEx.
HiRes SpecREs SineEx
Number of
stimulations
464,895 1,087,790 536,878
between two electrodes, both strategies would lead to a
similar power consumption. In SineEx however, less channels
are stimulated and this could lead to an improvement in
power consumption.
3. Study Design
HiRes, SpecRes, and SineEx were incorporated into the
research platform Speech Processor Application Framework
(SPAF) designed by Advanced Bionics. Using this Platform,
12 EURASIP Journal on Advances in Signal Processing
1000
2000
3000
4000
5000
6000
7000
8000
Frequency (Hz)
00.20.40.60.8
Time (s)
−50
−40
−30
−20
−10
0
10
20
(dB)
Spectrogram
(a)
1
2
3
4
5
6
7
8
9
10
11
12
13
14
15
16
Electrode
0.10.20.30.40.50.60.70.80.91
Time (s)
0
50
100
150
CL
HiRes
(b)
1
2
3
4
5
6
7
8
9
10
11
12
13
14
15
16
Electrode
0.10.20.30.40.50.60.70.80.91
Time (s)
0
50
100
150
CL
SpecRes
(c)
1
2
3
4
5
6
7
8
9
10
11
12
13
14
15
16
Electrode
0.10.20.30.40.50.60.70.80.91
Time (s)
0
50
100
150
CL
SineEx
(d)
Figure 7: Stimulation patterns obtained with (b) HiRes, (c) SpecRes, and (d) SineEx in noise (SNR = 10 dB) when the input signal is a sweep
tone of 1 millisecond of constant amplitude (70 dB) and frequency varying from 300 Hz until 8700 kHz added with white Gaussian noise
(SNR
= 10 dB) shown in (a). The horizontal axis represents time in seconds, and the vertical axis represents the electrode location. The level
applied in current level (CL) is coded by the colors given in the color bars. The location of excitation is obtained as presented in Section 2.4.
a chronic trial was conducted at the hearing center of the
Medical University of Hannover with 9 Harmony implant
users. The SPAF and the three strategies were implemented
in the Advanced Bionics bodyworn Platinum series processor
(PSP). The aim of the study was to further investigate
the benefits of virtual channels or current steering after a
familiarization period. Subjects were tested with all three
strategies (HiRes, SpecRes, and SineEx). The study was
divided into two symmetrical phases. In the first phase, each
strategy was given to each study participant during four
weeks and then evaluated. The order in which the strategies
were given to each patient was randomized. In the second
stage of the study, the strategies were given in reverse order
with respect to the first phase. Again after 4 weeks each
strategy was evaluated. Therefore, the total length of the
study for each subject was 24 weeks. The study participants
were selected because of their good hearing abilities in quiet
and noisy environments and for their motivation to listen to
music with their own clinical program. The participants were
not informed about the strategy they were using.
Frequency Discrimination. The aim of this task was to
determine if current steering strategies could deliver better
pitch perception than classical sequential stimulation strate-
gies. Frequency discrimination was evaluated with a three
alternative-forced-choice task (3AFC) using an adaptive
method test [29]. Audio signals were delivered to the
cochlear implant recipient via the direct audio input of the
PSP. Stimuli were generated and controlled by the Psycho-
Acoustic Test Suite (PACTS) software developed by Advanced
Bionics. The stimuli consisted of 500 milliseconds pure
tones sampled at 17.4 kHz and ramped on and off over 10
milliseconds with a raised cosine. The reference frequencies
were 1280 Hz and 2904 Hz. Each subject was presented with
three stimuli in each trial. Two stimuli consisted of a tone
EURASIP Journal on Advances in Signal Processing 13
1000
2000
3000
4000
5000
6000
7000
8000
Frequency (Hz)
00.10.20.30.40.50.60.70.80.9
Time (s)
−60
−40
−20
0
20
(dB)
Spectrogram
00.20.40.60.81
−1
0
1
Amplitude
(a)
1
2
3
4
5
6
7
8
9
10
11
12
13
14
15
16
Electrode
0.10.20.30.40.50.60.70.80.9
Time (s)
0
50
100
150
CL
HiRes
(b)
1
2
3
4
5
6
7
8
9
10
11
12
13
14
15
16
Electrode
0.10.20.30.40.50.60.70.80.9
Time (s)
0
50
100
150
CL
SpecRes
(c)
1
2
3
4
5
6
7
8
9
10
11
12
13
14
15
16
Electrode
0.10.20.30.40.50.60.70.8
0.9
Time (s)
0
50
100
150
CL
SineEx
(d)
Figure 8: (a) Speech token “asa” uttered by a male voice and its spectrogram. (b) Stimulation pattern obtained with HiRes. (c) Stimulation
pattern obtained with SpecRes. (d) Stimulation pattern obtained with SineEx. The horizontal axis represents time in seconds, and the vertical
axis represents the electrode location. The level applied in current level (CL) is coded by the colors given in the color bars. The location of
excitation is obtained by linearly interpolating the electrical amplitude applied to the pairs of simultaneous stimulated electrodes.
burst at the reference frequency. This frequency was fixed
during the whole run. The third stimulus consisted of a tone
burst at two times the reference frequency (probe frequency).
The presentation order of the stimulus was randomized in
the three intervals. The subject was asked to identify the
interval containing the stimulus that was higher in pitch.
After two consecutive correct answers, the frequency of the
probe stimulus was decreased by a factor of 2
1/12
.Aftereach
incorrect answer, the frequency of the probe stimulus was
increased by two times this factor, leading to an asymptotic
average of 71% correct responses [29]. The procedure was
continued until 8 reversals were obtained and the mean of
the probe frequency of the last four reversals was taken as
the result for that particular run. This result is termed the
frequency difference limen (FDL). Intensity was roved by
randomly varying the electrical output gain from 85% to
110% of the dynamic range, to minimize loudness cues. The
experiment was performed twice for each subject and the
meanvalueofbothrunswascalculated.
Speech Recognition Tests. Speech recognition was evaluated
using the HSM sentence test [28]. The HSM test was
administered in quiet, in noise, and with background speech
interference (competing talker).
The aim of the speech-in-noise condition was to eval-
uate if current-steering strategies could improve speech
intelligibility in noisy situations. For the noise condition,
telephone noise was added to the HSM test according to
the Committee Communication International Telephone
and Telegram recommendation 227 [30]. The signal-to-
noise-ratio was 10 dB. The aim of the speech-in-competing
speech condition was to evaluate if current steering strategies
could provide better speech intelligibility in the presence of
multiple talkers. For the evaluation of speech recognition
with background speech interference, a second German voice
was added to the HSM sentence test. This was accomplished
by mixing the HSM test with the Oldenburger sentence test
(OLSA) [31]. Every word of the HSM sentence test was
overlapped in time by at least one word of the OLSA test. The
14 EURASIP Journal on Advances in Signal Processing
signal-interference ratio was 5 dB. The patients were asked
to repeat only those sentences corresponding to the HSM
sentence test and the number of correct words was counted.
For each condition (quiet, noise, and competing talker) 2
lists of 20 sentences were presented in each stage of the study.
The subjects had to repeat each sentence, and results were
based on the number of correct words repeated correctly. All
tests were conducted by connecting a CD player directly to
the audio input of the speech processor.
Music and Speech Subjective Appreciation Tests. Subjective
sound perception with each strategy was evaluated using
questionnaires that assessed the overall benefits of the
implant in daily life. The questionnaires supplemented the
data available from conventional tests of speech perception
[32].
The questionnaires asked subjects to rate music and
speech quality [33]. At each stage of the study, the question-
naire was completed by the patient such that for each strategy
the same questionnaire was filled out two times.
The music questionnaire asked subjects to rate the
pleasantness, distinctness, naturalness, and overall percep-
tion of music on a scale from 0 (extremely unpleasant,
extremely indistinct, extremely unnatural, extremely bad) to
10 (extremely pleasant, extremely distinct, extremely natural,
extremely good).
For the speech questionnaire asked subjects to rate
different characteristics of speech on a 10-point scale. Char-
acteristics included background interference; naturalness of
female voices, male voices, own voice; clarity of speech;
pleasantness of speech; overall quality of speech. Listeners
were provided with definitions of each dimension for each
scale.
3.1. Subjects. All subjects had clinical experience with the
HiResstrategyandwereusersoftheHarmony(HiRes90k
or CII) implant. This strategy can only be configured in
monopolar stimulation mode. Demographic information for
alltestsubjectsispresentedinTa bl e 3. P7 completed only
the first phase of the study protocol. For all strategies, the
stimulation rate was derived from the HiRes clinical program
and was kept constant throughout the conditions. Threshold
and most comfortable levels also were kept constant. Only
global modifications of the these levels were allowed to
accommodate loudness requests of the subjects, meaning
that the THL or MCL levels were changed by the same
amount for all the electrodes.
4. Results
All subjects reported that speech experienced using SpecRes
and SineEx was understandable immediately. However, the
sound perceived with the new strategies was significantly
different from HiRes for some users. For example, SineEx was
immediately described as brighter than the other strategies.
Despite the sound quality differences, all subjects were
willing to take part in the chronic phase of the study
even though they were not allowed to change the strategy
during the study period. All subjects immediately reported
that speech experienced using SpecRes and SineEx was
understandable. For some users, the sound perceived with
the new strategies was, however, significantly different from
HiRes. For example, the sound with SineEx was immediately
described as brighter than with any other strategy.
Frequency Discrimination Results. Frequency discrimination
results are presented for the two reference frequencies
(1280 Hz and 2904 Hz) in Figures 9(a) and 9(b).Inmean
value, all current steering strategies obtained an improve-
ment in frequency discrimination with respect to HiRes.
SpecRes produced slightly better frequency discrimination
than SineEx for the 1280 Hz reference frequency.
Results were subject to the paired t-test significance test.
No significant difference was found between HiRes, SpecRes,
and SineEx for the two reference frequencies due to the large
inter- and intrasubject variability. Particularly, the results
were dominated by the large variability observed in P2 for
both reference frequencies.
4.1. Speech Intelligibility Results
Speech Intelligibilit y in Quiet. Figure 10(a) presents the aver-
aged scores for each subject for the HSM sentence test in
quiet. All subjects, except P2, scored 90% or higher for all
three strategies, thus demonstrating that they were good
performers with all strategies.
Speech Intelligibilit y in Noise. Figure 10(b) presents the aver-
aged results for each subject for the HSM sentence test in
noise (SNR
= 10 dB). The mean results show that, in general,
SpecRes produced the highest scores. Three patients out of
9 (P2, P7, and P8) attained better speech recognition scores
with HiRes than with SpecRes.
Speech Intelligibility with Competing Talker. The mean scores
for each patient using the HSM sentence test with competing
talker are presented in Figure 10(c). SpecRes produced the
highest word recognition scores in this condition. P7 was not
able to understand speech in this condition with any strategy.
Although SineEx produced the best frequency discrim-
ination scores, this strategy was not able to improve word
recognition with competing talker in most of the patients.
Only patient 4 obtained better speech understanding with
SineEx.
All the results were subject to the paired samples t-
test. No significant difference were found between HiRes,
SpecRes, and SineEx.
Subjective Music Appreciation Questionnaire. Figure 11
presents the results for the items clarity, naturalness,
pleasantness, and overall music perception. No significant
differences were found between the three strategies (paired
t-tests) and the overall perception of music was rated
similarly for all three strategies. However, music was rated
as more clear, natural and pleasant with SineEx compared to
HiRes and SpecRes.
EURASIP Journal on Advances in Signal Processing 15
Table 3: Subject demographics for the current steering study.
Patient id Age
Duration of
deafness in
years
Cause of
deafness
Implant
experience in
years
Electrode
type
Usual
strategy
P1 54
0
Sudden
hearing loss
3 HiRes90k
HiRes
1080 pps
P2 70
0 Unknown 8 HiRes90k
HiRes
1080 pps
P3 51
4
After heard
operation
6ClarionCII
HiRes
900 pps
P4 26
1 Unknown 7 Clarion CII
HiRes
500 pps
P5 43
0
Sudden
hearing loss
7ClarionCII
HiRes
900 pps
P6 62
0Genetic4ClarionCII
HiRes
900 pps
P7 53
0 Unknown 9 HiRes90k
HiRes
1200 pps
P8 49
16 Unknown 5 Clarion CII
HiRes
900 pps
P9 60
0 Ototoxika 7 Clarion CII
HiRes
1200 pps
P1 P2 P3 P4 P5 P6 P7 P8 P9 Mean
HiRes
5.8
6.1 7.524.4 12.9
12.7
7.320.6
2.6
18.3 5.8
2.9
27.8 17.1
4.8 21.8
2.7 5.3
3.8 3.4
20.7
3.88.8
12
5 4.5 19.5 8.4 4.8 10.3
SpecRes
SineEx
0
3.9
7.81
15.62
19.53
23.43
27.34
27.34
31.25
35.16
FDL (%)
1280 Hz
Better
(a)
P1 P2 P3 P4 P5 P6 P7 P8 P9 Mean
HiRes
16.7
90.7 3.6 28.7 3.2
8 27.3 6.5 6.3
20.510.4
6.7 60.5 1.8 21 17 2.3 1.5
6.2 80 0.9 21.2 8.2 3.4 10.3
40.1 16.2
18.7 1.6
18.5
SpecRes
SineEx
0
17.2
34.4
51.6
68.9
86
103.3
120.5
137.7
154.9
FDL (%)
2904 Hz
Better
(b)
Figure 9: Frequency discrimination limen by subject (average and standard deviation) for the frequency discrimination test at different
reference frequencies (a) 1280 Hz and (b) 2904 Hz with HiRes, SpecRes, and SineEx. The frequency discrimination limen is presented as
percentage of the reference frequency.
Subjective Speech Appreciation Questionnaire. Figure 12
shows the results for the items speech quality with back-
ground interference, natural female voice, natural male voice,
own voice, clarity, pleasantness, and overall speech quality.
There were no significant differences in the ratings of
these speech characteristics. However, SpecRes produced
better scores in perceived pleasantness, voice in back-
ground interference, and overall quality than HiRes and
SineEx.
On the other hand, the naturalness of their own voice
and male voice was rated higher with HiRes. Many patients
reported that low frequency sounds were better perceived
with HiRes, while the sound with the current steering
strategies (especially with SineEx) was described as brighter.
It is likely that the perception of female voices was rated
higher with SineEx, and male voices were rated higher with
HiRes.
SineEx was rated higher for the perception of voice in
background interference. These scores do not correlate with
the speech intelligibility scores obtained by SineEx in the
competing talker condition, which were lower than with
SpecRes and equal to HiRes.
Clarity of voice was rated highly for all strategies.
However SpecRes was rated slightly higher SineEx and HiRes.
5. Discussion
This study designed and evaluated new sound processing
strategies that use current steering to improve the spectral
and temporal information delivered to an Advanced Bionics
16 EURASIP Journal on Advances in Signal Processing
P1 P2 P3 P4 P5 P6 P7 P8 P9 Mean
SineEx
100
100
100
99100
100
100 100 100100
100
100
94
96
98
97
92
98
99
99
73
77 92
95
92
9299
99
99
99
SpecRes
HiRes
0
20
40
60
80
100
Words correct (%)
HSM (quiet)
(a)
P1 P2
P3 P4 P5
P6
P7
P8 P9
Mean
4
91
16
SpecRes
HiRes
52
44
77
79
66
SineEx
33 48
23
31
9
42
42
44
28
25
35
59
76
62
52
61
50
24
62
29
85
92
0
10
20
30
40
50
60
70
80
90
100
Words correct (%)
HSM (SNR = 10 dB)
(b)
P1 P2 P3 P4 P5 P6 P7 P8 P9 Mean
HiRes
SpecRes
32
37
26
3
2
1
63
71
63
15
33
39
54
44
34
52
65
52
0
0
0
12
16
11
7
14
10
26
31
26
SineEx
0
10
20
30
40
50
60
70
80
Words correct (%)
HSM (CT = 5dB)
(c)
Figure 10: Percent of correct word by subject (average and standard deviation) for the HSM sentence test in (a) quiet, (b) with 10 dB SNR,
and (c) 5 dB competing talker.
Harmony cochlear implant. Current steering stimulates pairs
of electrodes simultaneously so that virtual channels are
created intermediate to the physical electrodes. In SpecRes
an FFT is used together with a spectral peak locator to
extract the most dominant frequencies. In SineEx, the audio
signal is modeled with sinusoids and the frequencies of those
sinusoids are delivered to the implant using current steering
and a psychoacoustic masking model.
SpecRes and SineEx are the first signal processing
strategies implemented in a commercial device using the
current steering technique. These strategies were evaluated
in a chronic study comparing them to the standard HiRes
strategy that does not use current steering. All patients
were able to use the new strategies during a long-term test
protocol. In the chronic study, frequency discrimination,
speech intelligibility, and subjective ratings of music and
speech were evaluated. Overall, the sound performance
achieved with the three strategies evaluated in this study was
similar and the results exhibited large inter- and intrasubject
variability.
For frequency discrimination, there were nonsignificant
improvements for the SineEx strategy over the HiRes strategy
from 12% to 10.3% and from 20.5% to 16.7%, when the
reference frequencies were 1280 Hz and 2904 Hz, respec-
tively. These improvements are assumed to be the result
of using the current steering technique. A 1.8 percentage
points improvement in frequency discrimination for SineEx
compared to the SpecRes strategy was observed only for
the 2904 Hz reference frequency. That improvement can be
attributable to the robust method for modeling the audio
signal with sinusoids and the use of a perceptual model to
select the sinusoidal components.
There are several reasons why we could not demonstrate
a significant improvement in frequency difference limen
for current steering strategies with respect to sequential
stimulation strategies. First, pure tones were used to estimate
the FDL. Pure tones when presented to a cochlear implant
may activate several bands (specially for HiRes and SpecRes).
Therefore, the use of pure tones cannot provide an accurate
assessment of specific locations along the electrode array
as shown when stimulating the electrode array with just a
pair of simultaneous stimulated pulses. Second, a large intra-
and intersubject variability was observed. For example, study
participant P2, who obtained worse speech intelligibility
in quiet than the rest of patients, showed also very poor
results in FDL with large variability. Third, it has to be
remarked that all study participants used HiRes in daily
life and therefore had more experience when hearing to
sequential stimulation strategies than to current steering
strategies.
EURASIP Journal on Advances in Signal Processing 17
0
1
2
3
4
5
6
7
8
9
Rating
Clarity
P1 P2 P3 P4 P5 P6 P7 P8 P9 Mean
(a)
0
1
2
3
4
5
6
7
8
9
Rating
Natural
P1 P2 P3 P4 P5 P6 P7 P8 P9 Mean
(b)
0
1
2
3
4
5
6
7
8
9
Rating
Overall
P1 P2 P3 P4 P5 P6 P7 P8 P9 Mean
HiRes
SpecRes
SineEx
(c)
0
1
2
3
4
5
6
7
8
9
Rating
Pleasantness
P1 P2 P3 P4 P5 P6 P7 P8 P9 Mean
HiRes
SpecRes
SineEx
(d)
Figure 11: Results of the music quality questionnaire using HiRes, SpecRes, and SineEx. Different items were rated on a 10-point scale.
The cochlear implant subjects were asked to rate different aspects of music perception. The items are (a) clarity of music, (b) natural music
perception, (c) pleasantness hearing music, and (d) overall music perception.
The frequency difference limen results obtained in this
study are in the same range as those observed in the literature
[34] using a similar experiment. In our study we observed
a trend towards mean sound frequency difference limens
increasing with increasing frequency, this trend has also been
reported in the literature for cochlear implants [34]aswellas
for normal hearing listeners [35].
Speech intelligibility was evaluated using the HSM
sentence test. The results for HSM in noise showed a
nonsignificant improvement of speech recognition for the
SpecRes strategy against the HiRes and SineEx of 4%
and 8%, respectively. For the HSM with competing talker
(speech background interference) the SpecRes achieved a
nonsignificant improvement of 5% with respect to both the
HiRes and SineEx.
In SineEx, appropriate source modeling and the selection
of the components that describe this model are obviously of
great importance to sound and music quality. In addition,
SineEx stimulates, on average, half as many electrodes as
SpecRes. Thus SineEx has the potential to reduce power
consumption in actual devices because fewer electrodes are
stimulated per frame. Because a direct relationship exists
between the number of channels selected and the amount of
channel interaction, stimulating fewer channels can lead to a
reduction of interaction between channels.
Current steering strategies stimulate pairs of electrodes
simultaneously. Therefore, the interaction between channels
and the spread of the electrical fields produced in the
cochlea increase with respect to nonsimultaneous stimu-
lation strategies. In order to limit channel interaction in
18 EURASIP Journal on Advances in Signal Processing
0
1
2
3
4
5
6
7
Rating
Speech in background interference
P1 P2 P3 P4 P5 P6 P7 P8 P9 Mean
(a)
0
1
2
3
4
5
6
7
8
9
Rating
Natural female
P1 P2 P3 P4 P5 P6 P7 P8 P9 Mean
(b)
0
1
2
3
4
5
6
7
8
9
Rating
Natural male
P1 P2 P3 P4 P5 P6 P7 P8 P9 Mean
(c)
0
1
2
3
4
5
6
7
8
9
Rating
Natural own
P1 P2 P3 P4 P5 P6 P7 P8 P9 Mean
(d)
0
1
2
3
4
5
6
7
8
9
Rating
Clarity
P1 P2 P3 P4 P5 P6 P7 P8 P9 Mean
(e)
0
1
2
3
4
5
6
7
8
9
Rating
Pleasantness
P1 P2 P3 P4 P5 P6 P7 P8 P9
Mean
(f)
0
1
2
3
4
5
6
7
8
9
Rating
Overall
P1 P2 P3 P4 P5 P6 P7 P8 P9 Mean
HiRes
SpecRes
SineEx
(g)
Figure 12: Results of the speech quality questionnaire using HiRes, SpecRes, and SineEx. Different items were rated on a 10-point scale. The
cochlear implant subjects were asked to rate features of speech in different situations. The items are (a) speech in background interference,
(b) natural female, (c) natural male, (d) natural own, (e) clarity, (f) pleasantness, and (g) overall speech quality.
SineEx, the frequency selection, which is related to the
channels to be stimulated, also incorporates a simple version
of a perceptual model based on masking effects.
In the version of SineEx evaluated in this study, sound
perception is similar to the sound perceived with HiRes
and SpecRes. However, this version of SineEx models
the audio signal only with sinusoids, without considering
noise components. Improvements to SineEx should include
incorporating source models that process noise components
as well as the sinusoidal components of the audio input signal
because noise components comprise important cues for
speech perception as well as for auditory scene analysis. An
important aspect in designing new signal processing strate-
gies for cochlear implants is the complexity of the algorithms.
SineEx was implemented in the real-time Advanced Bionics
bodyworn Platinum series processor, which uses a low-power
DSP. Therefore, implementation on a commercial behind-
the-ear Harmony processor should not be a major problem.
The Harmony processor can save up to three strategies
at the same time. Given the large intersubject variability
in speech and music perception with HiRes, SpecRes, and
SineEx, the Harmony allows all three strategies to be placed
on the same processor. This flexibility gives the user the
opportunity to select between strategies depending upon the
situation.
6. Conclusions
The SineEx strategy models the input audio signal with
sinusoids and uses a psychophysical masking model and
current steering to increase the spectral resolution in a
cochlear implant while at the same time reducing channel
EURASIP Journal on Advances in Signal Processing 19
interaction. The SpecRes strategy uses an FFT and a spectral
peak locator to extract the most dominant frequencies.
SpecRes also uses current steering to improve the place-
frequency accuracy of stimulation. Results show large vari-
ability among cochlear implant users in pitch perception,
speech intelligibility, and music perception when compar-
ing these two current steering strategies against HiRes, a
sequential stimulation strategy. All patients tested until now
peformed equally well using the current steering technique as
with conventional strategies. New modifications of the signal
processing algorithms together with further inverstigation
on simultaneous stimulation of the electrodes hold great
promise for improving the hearing capabilities of cochlear
implant users.
References
[1] B. S. Wilson, C. C. Finley, D. T. Lawson, et al., “Better speech
recognition with cochlear implants,” Nature, vol. 352, no.
6332, pp. 236–238, 1991.
[2] J. Laneau, When the deaf listen to music Pitch perception with
cochlear implants, Ph.D. dissertation, Katholieke Universiteit
Leuven, Faculteit Toegepaste Wetenschappen, Leuven, Bel-
gium, 2005.
[3] B. S. Wilson, R. Schatzer, E. A. Lopez-Poveda, X. Sun, D. T.
Lawson, and R. D. Wolford, “Two new directions in speech
processor design for cochlear implants,” Ear and Hearing, vol.
26, no. 4, pp. 73s–81s, 2005.
[4] L. Geurts and J. Wouters, “Coding of the fundamental
frequency in continuous interleaved sampling processors for
cochlear implants,” Journal of the Acoustical Society of America,
vol. 109, no. 2, pp. 713–726, 2001.
[5]Q J.Fu,F G.Zeng,R.V.Shannon,andS.D.Soli,“Impor-
tance of tonal envelope cues in chinese speech recognition,”
Journal of the Acoustical Society of America, vol. 104, no. 1, pp.
505–510, 1998.
[6] K. Hopkins and B. C. J. Moore, “The contribution of temporal
fine structure to the intelligibility of speech in steady and
modulated noise,” Journal of Acoustical Society of America, vol.
125, no. 1, pp. 442–446, 2009.
[7] Boston Scientific, “HiRes with fidelity 120 sound processing,”
A Report from Advanced Bionics, The Audtitory Business of
Boston Scientific, 2006.
[8]Z.M.Smith,B.Deleguette,andA.J.Oxenham,“Chimeric
sounds reveal dichotomies in auditory perception,” Nature,
vol. 416, pp. 87–90, 2002.
[9] A. B
¨
uchner, C. Frohne-Buechner, L. Gaertner, A. Lesinski-
Schiedat, R D. Battmer, and T. Lenarz, “Evaluation of
advanced bionics high resolution mode,” International Journal
of Audiology, vol. 45, no. 7, pp. 407–416, 2006.
[10] G. S. Donaldson and H. A. Kreft, “Place-pitch discrimination
of single- versus dualelectrode stimuli by cochlear implant
users (l)(a),” Journal of the Acoustical Society of America, vol.
118, no. 2, p. 623, 2005.
[11] B. S. Wilson, R. Schatzer, and E. A. Lopez-Poveda, “Possibili-
ties for a closer mimicking of normal auditory functions with
cochlear implants,” in Cochlear Implants, pp. 48–56, Thieme
Medical, New York, NY, USA, 2nd edition, 2006.
[12] D. B. Koch, M. Downing, M. J. Osberger, and L. Litvak, “Using
current steering to increase spectral resolution in CII and
HiRes 90K users,” Ear and Hearing, vol. 28, no. 2, supplement,
pp. 38S–41S, 2007.
[13] B. Townshend, N. Cotter, D. van Compernolle, and R.
L. White, “Pitch perception by cochlear implant subjects,”
Journal of the Acoustical Society of America, vol. 82, no. 1, pp.
106–115, 1987.
[14] H. J. McDermott and C. M. McKay, “Pitch Ranking with
non-simultaneous dual-electrode electrical stimulation of the
cochlea,” Journal of Acoustical Society of America, vol. 96, pp.
155–162, 1994.
[15]J.H.M.Frijns,R.K.Kalkman,F.J.Vanpoucke,etal.,
“Simultaneous and non-simultaneous dual electrode simula-
tion in cochlear implants: evidence for two neural response
modalities,” Acta Oto-Laryngologica, vol. 129, pp. 433–439,
2009.
[16] M. A. Stone, B. C. J. Moore, J. I. Alc
´
antara, and B. R.
Glasberg, “Comparison of different forms of compression
using wearable digital hearing aids,” Journal of the Acoustical
Society of America, vol. 106, no. 6, pp. 3603–3619, 1999.
[17] A. J. C. Wilson, “The location of peaks,” British Journal of
Applied Physics, vol. 16, no. 5, pp. 665–674, 1965.
[18] J. O. Smith III and X. Serra, “PARSHL: an analysis/synthesis
program for non-harmonic sounds based on a sinusoidal
representation,” in Proceedings of the Internat ional Com-
puter Music Conference (ICMC ’87), pp. 290–297, Urbana-
Champaign, Ill, USA, August 1987.
[19] D. D. Greenwood, “A cochlear frequency-position function for
several species—29 years later,” Journal of the Acoustical Socie ty
of America, vol. 87, no. 6, pp. 2592–2605, 1990.
[20] G. S. Stickney, P. C. Loizou, L. N. Mishra, P. F. Assmann, R.
V. Shannon, and J. M. Opie, “Effects of electrode design and
configuration on channel interactions,” Hearing Research, vol.
211, no. 1-2, pp. 33–45, 2006.
[21] H. Purnhagen, N. Meine, and B. Edler, “Sinusoidal coding
using loudness-based selection,” in Proceedings of the IEEE
International Conference on Acoustics, Speech and Signal Pro-
cessing (ICASSP ’02), vol. 2, pp. 1817–1820, Orlando, Fla, USA,
May 2002.
[22] W. Nogueira, A. B
¨
uchner, Th. Lenarz, and B. Edler, “A psy-
choacoustic “NofM”-type speech coding strategy for cochlear
implants,” EURASIP Journal on Applied Signal Processing, vol.
2005, no. 18, pp. 3044–3059, 2005.
[23] B. Edler, H. Purnhagen, and C. Ferekidis, “ASAC—
analysis/synthesis codec for very low bit rates,” in Proceedings
of the 100th Audio Engineering Society Convention (AES ’96),
Copenhagen, Denmark, May 1996, Preprint 4179.
[24] S. G. Mallat and Z. Zhang, “Matching pursuits with time-
frequency dictionaries,” IEEE Transactions on Signal Process-
ing, vol. 41, no. 12, pp. 3397–3415, 1993.
[25] H. Purnhagen and N. Meine, “HILN—the MPEG-4 paramet-
ric audio coding tools,” in Proceedings of the IEEE International
Symposium on Circuits and Systems (ISCAS ’00), vol. 3, pp. 23–
31, Geneva, Switzerland, May 2000.
[26] R. A. Lutfi, “A power-law transformation predicting masking
by sounds with complex spectra,” JournaloftheAcoustical
Society of America, vol. 77, no. 6, pp. 2128–2136, 1985.
[27] F. Baumgarte, C. Ferekidis, and H. Fuchs, “A nonlinear
psychoacoustic model applied to the ISO MPEG layer 3 coder,”
in Proceedings of the 99th Audio Enginee ring Society Convention
(AES ’95), New York, NY, USA, October 1995, Preprint 4087.
[28] I. Hochmair-Desoyer, E. Schulz, L. Moser, and M. Schmidt,
“The HSM sentence test as a tool for evaluating the speech
understanding in noise of cochlear implant users,” Ameri-
can Journal of Otology, vol. 18, no. 6, supplement, p. 83,
1997.
20 EURASIP Journal on Advances in Signal Processing
[29] H. Levitt, “Transformed up-down methods in psychoacous-
tics,” Journal of the Acoustical Society of America, vol. 49, no. 2,
part 2, pp. 467–477, 1971.
[30] International Telecommunication Union (ITUT) G. 227,
“International analogue carrier systems -General characteris-
tics common to all analogue carrier-transmission systems—
General characteristics common to all analogue carrier-
transmission systems—Conventional telephone signal,” ITU
1988, 1993.
[31] K. Wagener, V. Kuehnel, and B. Kollmeier, “Entwicklung und
evaluation eines satztests fuer die deutsche sprache i: design
des oldenburgers satztests,” Zeitschrift f
¨
ur Audiologie, vol. 38,
pp. 4–15, 1999.
[32] G. Clark, Cochlear Implants: Fundamentals and Applications,
Modern Acoustics and Signal Processing, Springer, AIP Press,
Berlin, Germany, 2003.
[33] A. Gabrielsson and H. Sjogren, “Perceived sound quality
of sound reproducing,” Journal of the Acoustical Society of
America, vol. 65, pp. 1019–1726, 1979.
[34] N. B. Spetner and L. W. Olsho, “Auditory frequency resolution
in human infancy,” Child Development, vol. 61, no. 3, pp. 632–
652, 1990.
[35] E. J. Propst, K. A. Gordon, R. V. Harrison, S. M. Abel, and B. C.
Papsin, “Sound frequency discrimination in normal-hearing
listeners and cochlear implantees,” The University of Toronto
Medical Journal, vol. 79, no. 2, 2002.