báo cáo hóa học:" Research Article Jitter Estimation Algorithms for Detection of Pathological Voices" doc
Bạn đang xem bản rút gọn của tài liệu. Xem và tải ngay bản đầy đủ của tài liệu tại đây (671.68 KB, 9 trang )
Hindawi Publishing Corporation
EURASIP Journal on Advances in Signal Processing
Volume 2009, Article ID 567875, 9 pages
doi:10.1155/2009/567875
Research Article
Jitter Estimation Algorithms for Detection of
Pathological Voices
D
´
arcio G. Silva,
1
Lu
´
ıs C. Oliveira,
1
and M
´
ario Andrea
2
1
INESC-ID/IST, Lisbon, 1649-028 Lisbon, Portugal
2
Faculty of Medicine, University of Lisbon, Portugal
Correspondence should be addressed to Lu
´
ıs C. Oliveira,
Received 27 November 2008; Revised 15 April 2009; Accepted 30 June 2009
Recommended by Juan I. Godino-Llorente
This work is focused on the evaluation of di fferent methods to estimate the amount of jitter present in speech signals. The jitter
value is a measure of the irregularity of a quasiperiodic signal and is a good indicator of the presence of pathologies in the larynx
such as vocal fold nodules or a vocal fold polyp. Given the irregular nature of the speech signal, each jitter estimation algorithm
relies on its own model making a direct comparison of the results very difficult. For this reason, the evaluation of the different
jitter estimation methods was target on their ability to detect pathological voices. Two databases were used for this evaluation:
a subset of the MEEI database and a smaller database acquired in the scope of this work. The results showed that there were
significant differences in the performance of the algorithms being evaluated. Surprisingly, in the largest database the best results
were not achieved with the commonly used relative jitter, measured as a percentage of the glottal cycle, but with absolute jitter
values measured in microseconds. Also, the new proposed measure for jitter, LocJitt, performed in general is equal to or better
than the commonly used tools of MDVP and Praat.
Copyright © 2009 D
´
arcio G. Silva et al. This is an open access article distributed under the Creative Commons Attribution License,
which permits unrestricted use, distribution, and reproduction in any medium, provided the original work is properly cited.
1. Introduction
Most voice-related pathologies are due to irregular masses
located on the vocal folds interfering in their normal and
regular vibration. This phenomenon causes a decrease in
voice quality, that is, usually the first symptom of this type
of disorders. In the past, the only way to measure voice
quality was by applying perceptual measurements denoting
the existence or absence of several voice characteristics [1].
There has been an increasing need for techniques that
can evaluate voice quality in an objective way, providing
a robust and reliable measurement of important acoustic
parameters in voice [2]. With the recent development in
technology, quality equipment and sophisticated software
are now available to analyse the speech signal in order to
estimate numerous parameters that indicate amplitude and
frequency perturbations, the level of air leakage, the degree
of turbulence, and so forth. The implementation of real-
time analysis tools can give an important and instantaneous
feedback of voice performance for both voice therapy and
voice coaching procedures.
One of the most commonly used tools for this purpose
is the Multidimensional Voice Program (MDVP) produced
by KayPENTAX [3]. This commercial software tool is able
to perform different types of acoustic analysis on the
speech signal producing a large number of parameters.
The MDVP is usually sold together with the KayPENTAX’s
Computerized Speech Lab, a hardware platform for digital
voice recording, making its use very common among health
professionals.
Another commonly used speech analysis tool is Praat [4],
created by Paul Boersma and David Weenink of the Institute
of Phonetic Sciences, University of Amsterdam. This free
software is used by speech researchers, and it has a wider
range of use than MDVP although with a steeper learning
curve.
In this work we will focus on the estimation of
irregularities in the vibr ation of the vocal folds that is
commonly measured by the jitter parameter. Jitter measures
the irregularities in a quasi-periodic signal and can account
for variations in one or more of its features, like period,
amplitude, shape, and so forth [5]. In the case of speech
2 EURASIP Journal on Advances in Signal Processing
signal, its definition is less clear since the signal is very
irregular. Even a sustained vowel produced by a professional
speaker can hardly be considered a periodic signal. This
way, the jitter of a voiced speech signal is u sually taken as a
measure of the change in the duration of consecutive glottal
cycles. When this definition is applied to a sustained vowel
with a constant average glottal period, the presence of jitter
indicates that there are some periods that are shorter while
others are longer than the average pitch period.
Both MDVP and Praat have the possibility of producing
an estimate of the amount of jitter in a sustained vowel.
However, it is known that MDVP system has a tendency
to score jitter values above the ones calculated by Praat;
when applied to the same speech signal they provide different
estimates [6]. Apart from these there are other methods to
estimate jitter, and the question is on how to compare them.
In this paper we present the results of our evaluation of 3
jitter estimation methods including the one used by MDVP
and Praat. The goal of this study is not to develop a system
for the detection of pathologic voices [7–9] but solely to
understand the relative performance of the 3 jitter estimation
techniques in this task.
The paper starts by presenting the glottal source and
vocal tract models used in this work, followed by a
description of the speech material that was used in the
evaluation process. Next we present some methods for
marking fixed points in the glottal cycle as required by the
jitter estimation algorithms. We formalise the three jitter
models that were used, followed by a description of the jitter
estimation algorithms that were evaluated. A comparison of
the algorithms for both pitch marking and jitter estimation
is then presented. A set of 14 tools, combining the different
algorithms, are then evaluated in their ability to detect
pathological voices. Finally we present the conclusions and
some ideas for future work.
2.VoiceSourceModel
Voice production starts with the vibration of the vocal folds,
which can be more or less stretched to achieve higher or
lower pitch tones. In normal conditions and in spite of this
pitch variation ability, phonation is considered stabilized and
regular. Any transformation on the vocal fold’s tissue can
cause an irregular, nonperiodic vibration which will change
the shape of the glottal source signal from one period to
the next, introducing jitter [ 10]. The same problem can
occur in amplitude. If, for instance, the vocal folds are too
stiff, they will need a higher subglottal pressure to vibrate.
The glottal cycle can thus be irregularly disturbed also in
amplitude, originating shimmer. Not less important is the
possible existence of high frequency noise, especially during
the closed phase of the glottal cycle, originated by a partial
closure of the vocal folds, which will cause an air leakage
through the glottis, providing a turbulence effect. All these
phenomena affect the glottal source signal, but we do not
have direct access to this signal, only to the sound pressure
radiated at the lips. The estimation of the glottal source signal
from the voice signal is not a simple task. Research in this
field shows that it is reasonable to approximate the influence
of the vocal tract by a linear filter. Using this approximation,
the voice signal can be filtered by inverse of this filter to
obtain an estimate of the g lottal source signal [11]. In this
work we will use a noninteractive approach that does not
consider the influence of the supraglottis vocal tract nor the
influence of the subglottis cavities on the glottal flow. As a
consequence, we assume that the source and filter parameters
are independent.
3. Vocal Tract Model
The vocal tract is responsible for changing the spectral
balance of the glottal source signal. By chang ing the vocal
tract shape the speaker can modify its resonance frequencies
to produce a wide variety of different sounds. Humans use
the evolution in time of the resonance frequencies to produce
speech. In this work, we model the vocal tract by an all-
pole filter estimated using a Linear Prediction Analysis (LPC)
[12]. LPC is a powerful and widely used tool for speech
analysis that assumes the already mentioned separation of
the source signal from the vocal tract filter. The contribution
of the vocal tract resonances estimated by the LPC algorithm
can be removed from the speech signal by inverse filtering.
This process produces an estimate of the glottal source signal,
also called residue. The ability to change the residue for
other similar inputs, with different fundamental frequencies
or amplitudes, and applying them to the original vocal
tract filter, allows the production of many combinations of
synthetic voices.
4. Speech Data
The evaluation of the jitter detection algorithms was also
conducted on real voices. For this purpose, two databases
were used: the Disordered Voice Database (MEEI) provided
by KayPENTAX, and a database named DB02 specifically
created for this study.
The Disordered Voice Database (MEEI) was developed
by the Massachusetts Eye and Ear Infirmary (MEEI) Voice
and Speech Lab. It includes more than 1400 voice samples
from approximately 700 subjects [13]. The database includes
samples from patients with a wide variety of organic, neu-
rological, traumatic, psychogenic, and other voice disorders,
together with normal subjects. For this work, a group of
50 pathological voices and 50 normal voices was randomly
chosen from this data set.
The DB02 database was acquired in similar conditions
as the MEEI database using the Computerized Speech Lab
4150 acquisition system from KayPENTAX, together with
a dynamic low impedance microphone (SURE SM48). The
CSL 4150 provides a 16-bit A/D conversion, preamplifi-
cation, and antialiasing filtering. All voices for this study
were recorded with a sampling frequency of 50 kHz and a
signal-to-noise ratio of 39.5 dB [3]. Special care was taken
to maintain the same microphone position, the posture, and
also the type of interaction with the patient. The suggested
posture was, according to the normal procedures for a correct
EURASIP Journal on Advances in Signal Processing 3
phonation, back and head straight and aligned with the chair.
The microphone was positioned in a way to minimize the
effect of room reverberation making an angle of 45
◦
to the
opposing wall. Another important issue was to maintain
a fixed distance between the microphone and the patient’s
mouth, which can influence the amplitude of the captured
signal or even provide undesirable resonances at specific
frequencies. The direction is also relevant; a microphone
directed to the mouth can capture a pressure wave that
will cause an exaggerated excitation of the microphone. The
distance and angle chosen was 15 cm and 45
◦
.
Before each recording session, the volume level was
calibrated to adapt the dynamic range of the input signal in
order to prevent overload distortion and, at the same time,
minimize the quantization error provided by the discrete and
limited range of the A/D converter.
The new database was organized per patient and per
date of exam. Each exam was saved in wav format with the
filename according to the type of the exam and patient’s
reference number. The personal identification number of
the patients was separated from the rest of the database for
privacy reasons.
The DB02 database is still being acquired, and it currently
comprises 22 speakers of which 8 had diagnosed larynx
pathologies. For balancing reasons a subset of the database
was also used in this case including all the diagnosed
speakers and 8 randomly selected speakers with no diagnosed
pathologies.
5. Pitch-Mark Detectors
The jitter estimation algorithms that we want to evaluate
require the location of a fixed point in the glottal cycle,
called a pitch-mark (PM). A good candidate for this reference
point is the glottal closure instant (GCI) since it corresponds
to a discontinuity in the glottal flow caused by the abrupt
closure of the vocal folds, interru pting the passage of the air
through the glottis. Since the residue signal resulting from
the inverse filtering of the speech signal by the LPC filter
is an approximation of the derivative of the glottal flow,
the discontinuity in the flow produces large negative peaks.
Normally these peaks fall slower than they recover, w hich can
be explained by the vocal folds’ closing/opening process. A
regular vibration produces periodic peaks with fundamental
frequency F0.
A common algorithm for the glottal closure instant
detection is dypsa [14], for which there is an implementation
in the VoiceBox toolbox [15].
We have implemented a modification to dypsa algorithm
for sustained vowels, named dymp. This modification con-
siders that the glottal closure instants, calculated by dypsa, are
a first approximation of the real GCIs. Since we assume that
the vocal tract is stable, instead of using time-varying LPC
filter coefficients, we can tr y to locate the set of coefficients
that produced the most prominent peaks in the residue. By
analysing the residue resulting from the time-varying LPC
filter we can locate the pair of pitch periods with the largest
peaks and the corresponding set of filter coefficients. This
Table 1: Naming of the pitch marking tools.
Name Summary
dymp
Pitch marks computed using dypsa with
pitch-synchronous LPC coefficients
mdvp
Pitch marks computed with MDVP’s peak-picking
tool
praat
Pitch marks computed with Praat’s cross-correlation
tool
best set of filter coefficients is then used to filter the wh ole
sustained vowel producing a residue with more prominent
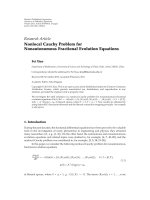
peaks (Figure 1(b)) . The GCIs are then better located in this
enhanced residue signal.
The results, when compared to advanced systems like
Praat and MDVP, suggest a significant improvement, espe-
cially for irregular voices.
MDVP and Praat rely on pitch marks that do not coincide
with the glottal closure instant. Praat uses a waveform-
matching procedure, that locates the pitch marks where the
best matching between wave shapes occurs using the “cross-
correlation” maximum. On the other hand, MDVP uses a
peak-picking procedure that locates the pitch marks on the
local peaks of the waveform.
6. Jitter Models
For this study, three different models of jitter were used.
The first one considers that jitter is just a simple
variation of period, which can be measured by subtracting
each period of the pitch period sequence to its neighbour
or combinations of its neighbours. This method usually
assumes a long time periodicity that sometimes does not
exist and provides a single measurement for the whole signal:
Jitta
=
1
N − 1
N−1
k
=1
|P
0
(
n +1
)
− P
0
(
n
)
|,(1)
where P
0
(n) is the sequence of pitch periods lengths mea-
sured in microseconds.
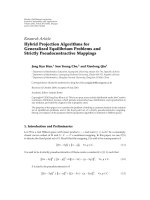
The second model can be represented by a combination
of two periodic phenomena on a long time range to achieve
local aperiodicity behaviour in a short time range (Figure 2).
If we assume a pulse like signal, it can be expressed as
s
(
n
)
=
+∞
k=−∞
δ
(
n − 2kP
)
+
+∞
k=−∞
δ
(
n + ε −
(
2k +1
)
P
)
.
(2)
In this model, P is the average period and ε is a value that
expresses the displacement of every other period, in a cyclic
perturbation of a local constant value, occurring in every
second impulse. The value of ε can range from 0, no jitter,
to P, the average period length.
It is important to note that, for a direct comparison of the
results, if we apply the first model to this second approach,
the estimated jitter value is Jitta
= 2ε.Thisfactorcomes
from the assumption that in the first case Jitta is the direct
subtraction of two periods, while for the latter ε is the half
difference of the subtraction of two periods (Figure 2).
4 EURASIP Journal on Advances in Signal Processing
Time (samples)
Amplitude (V)
1.54 1.56 1.58 1.6 1.62
−0.01
−0.005
0
0.01
0.005
1.52
PM detection on residue using dypsa
×10
4
(a)
−0.6
−0.5
−0.4
−0.3
−0.2
−0.1
0
0.1
0.2
1.52 1.54 1.56 1.58 1.6 1.62
0.3
Time (samples)
Amplitude (V)
PM detection on residue using dypsaMP
×10
4
(b)
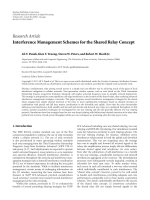
Figure 1: The residue signal resulting from the original dypsa algorithm ( a) and from the proposed dypsaMP (b) .
2P
P −
ε
3P − ε
4P
0
P +
ε
P + ε
P − ε
Amplitude
P − ε
1
Period (samples)
Figure 2: Example of a pitch period sequence with a local periodic
and a local aperiodic component.
The major inconvenient of both of these models is the
assumption that the underlying signal has a fixed funda-
mental frequency. However, apart for professional singers,
many speakers do not have a total control on the whole
process of phonation. Providing a regular glottal flow as well
as a constant position of the vocal tract, while producing a
regular vibration of the vocal folds, during recording period
(normally 8 to10 seconds), is not achievable by all speakers.
The amount of jitter determined by both previous methods
depends on the ability of the speaker to hold a constant pitch.
Slow monotonic changes in the fundamental frequency are
considered as a period-to-period variation. In our view, only
the nonmonotonic variation should be used as an indicator
of the presence pathologies in the voice. For this reason we
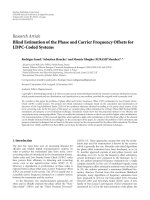
propose a third model allowing the glottal period to change
linearly over time as shown in Figure 3. In this approach ε
accounts only for the alternate change in period length, not
including the effect of monotonic fundamental frequency
variations.
Themodelcanbeexpressedas
P
0
(
n
)
= P
0
+
(
n − 1
)
P
+(−1)
n
ε,(3)
where Δ
P
is the constant variation in the period length, ε
represents the jitter value, and P
0
is the initial glottal per iod.
Using 3 pitch mark instants (P
0
(1), P
0
(2), P
0
(3)) it is possible
to determine the 3 parameters of the model. With this
short analysis window, it is sufficient to consider the linear
approximation of the monotonic variation of the period.
This model assumes that the constant variation of
period within the 3 per iod frame should not be considered
pathologic jitter. The separation of both contributions is
thought to be important to properly study real voices with
or without fundamental frequency variations, leading to a
more realistic measurement of local pathologic jitter. This
third model is the base for a new method for jitter estimation.
7. Jitter Estimation Algorithms
7.1. The Jitt Algorithm (Used by MDVP and Praat). Both
MDVP and Praat estimate the jitter value by computing
theaverageabsolutedifference between consecutive periods
(from the period sequence P
0
(n)), divided by the average
period expressed as a percentage:
Jitt
= 100
(
1/
(
N
− 1
))
N−1
k
=1
|P
0
(
n +1
)
− P
0
(
n
)
|
(
1/N
)
N
k
=1
P
0
(
n
)
. (4)
This measure is commonly referred as percent jitter or
relative jitter, while Jitta is the absolute jitter value expressed
in microseconds. In MDVP this algorithm is named Jitt,
while in Praat it is called Jitter (Local). In this work we will
use the MDVP name.
EURASIP Journal on Advances in Signal Processing 5
0
P
2
P
3
Period
1
P
1
Amplitude
Figure 3: Example of a pitch period sequence with an increasing
period.
We will also evaluate the average absolute difference
between consecutive periods as expressed in (1), naming it
by Jitta expressed in microseconds.
7.2. The STJE Algorithm. The Short Time Jitter Estimation
(STJE) algorithm was proposed by Vasilakis and Stylianou
[16], and it uses the second model for jitter mentioned above.
The algor ithm is based on mathematical attributes of the
magnitude spectrum; the train of impulses can be separated
in a harmonic part (H) and subharmonic part (S), where the
subharmonic part is a direct result of the jitter effect:
|P
(
w
)
|
2
= H
(
ε, w
)
+ S
(
ε, w
)
. (5)
When both spectra are represented in the same graph it can
be proved that the number of crossings of both components
is equal to the number of samples of jitter (ε) of the sig nal.
This means that the minimum number of crossings in a
graph of this type is also 0 (no jitter) and the maximum is
P (the period length). An example of these plots can be seen
later in this study (Figures 4 and 5).
The algorithm uses a sliding frame of 4P samples, which
will slide P samples at the time to estimating a jitter value for
each step. More details of implementation can be found in
[6].
It is important to remind that this algorithm provides
a sequence of local jitter estimations that does not depend
on long-term periodicity, while Praat and MDVP provide
a unique value due to expressions (3)and(4). To compare
this result with the ones provided by MDVP or Praat, it is
necessary to calculate the mean value of the sequence of local
jitter estimations.
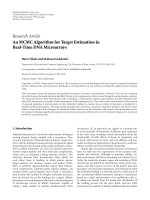
To analyse the performance of the STJE algorithm we
used a synthetic voice produced using an all-pole filter to
model the vocal tract. The filter coefficients were obtained by
performing an LPC analysis on a sustained vowel produced
by a male speaker, with a fundamental frequency of around
144 Hz, and using an analysis frame size of 4 glottal
periods. As expected, the algorithm STJE was able to detect
five intersections, corresponding to the exact jitter value
introduced in the impulse train used as the filter excitation
(Figure 4). For a more realistic result, the STJE algorithm
was applied on two frames of a real voice using a window
length of four periods. The first frame was carefully chosen
in order to comply with the second jitter model while the
second frame was chosen randomly. In both cases the jitter
value was also manually estimated on the time signal using
the Jitt algorithm and the results were compared. In the first
case the STJE correctly estimated a jitter of 1 sample, but in
the second one the estimated jitter was 5 samples while the
manual estimation was 1 sample.
Figure 5 shows the power spectrum of both the har-
monic and subharmonic components. The result shows an
unexpected number of intersections, which increase jitter
to values impossible to compare with MDVP’s or Praat’s.
Several attempts to correct the intersection counting, such as
changing the threshold for intersection validation, applying
different pre-emphasis, or even displacing the middle of the
analysis frame inside the period (to assure that it was not
a PM detection problem), were taken into account, but no
significant improvements were obtained.
One explanation for the higher than expected intersec-
tion count c an be the lowpass characteristic of the voiced
component of the speech signal that, when aspiration noise
is present, it is masked in the high-frequency region of
the spectrum. This adds additional crossings between the
harmonic and sub-harmonic components not predicted by
the model.
In conclusion, if the real voice follows the proposed
jitter model, the algorithm estimates correct values. However,
since natural human voices are quite ir regular, only in a
few cases STJE produces results comparable with MDVP or
Praat.
7.3. The LocJitt Algorithm (Proposed). The proposed LocJitt
algorithm aims to estimate the local jitter using the third
model for jitter that was previously presented. The main
goal is to provide a better jitter estimation by discarding
monotonic variations in fundamental frequency that occurs
in natural voices.
The algorithm uses a frame of length equal to 3
consecutive glottal cycles (4 Pitch Marks):
P
0
(
1
)
= P
0
− ε,
P
0
(
2
)
= P
0
+ Δp + ε,
P
0
(
3
)
= P
0
+2Δp − ε,
(6)
where P
0
is the length of the first glottal cycle excluding the
jitter effect,
P
is the monotonic increment in the length of
the glottal cycle occurring every period, and ε is cycle-to-
cycle fluctuation caused by jitter. Using this set of equations
it is easy to derive an expression to compute the jitter value
using the length of 3 consecutive glottal cycles:
ε
=
1
4
[
(
P
0
(
2
)
− P
0
(
1
))
−
(
P
0
(
3
)
− P
0
(
2
))
]
. (7)
Like SJTE, this algorithm has the ability to compute a
jitter estimate for every glottal cycle by shifting the analysis
window by one glottal cycle.
6 EURASIP Journal on Advances in Signal Processing
−60
−40
−20
0
20
40
60
80
Frequency (degrees)
Power (dB)
0 20 40 60 80 100 120 140 160 180
Synthetic voice:
ε = 5
Figure 4: Power spectrum of harmonic and subharmonic parts of a
synthetic signal. The jitter introduced (ε
= 5 samples) corresponds
to five crossings. No pre-emphasis was preformed.
Two versions of the algorithm were made: LocJitt pro-
duces an estimate of the local jitter as a percentage of the
average glottal period, and LocJitta estimates the absolute
value of the local jitter expressed in microseconds.
To evaluate the effect of these slower variations on the
fundamental frequency on the jitter estimation computed
using the Jitt algor ithm used by MDVP and Pratt, we will
assume that the pitch period sequence is given by (2)with
fixed values for ε
i
and
P
Using (4) it can easily be shown
that for an even number of periods if the amount of jitter is
larger than the slow varying changes in the pitch period, the
Jitta algorithm estimates the correct value for ε:
2ε>Δp
−→ Jitta = 2ε. (8)
However, for small jitter values when compared with the slow
variations of the glottal period, the Jitta algorithm estimates
not ε but the slow variation:
2ε<Δp
−→ Jitta = Δ p. (9)
The proposed LocJitta algorithm does not have this problem
and correctly separates the estimate of ε from the value of
P
.
This difference is most important in the cases where jitter
is present but with a small value, when it is most difficult to
detect. Also, localized variations in fundamental frequency
that went undetected during the voice acquisition procedure
can result in erroneous jitter estimation.
8. Evaluation of Jiiter Algorithms for
Pathological Voice Detection
As we saw earlier, each algorithm for jitter estimation is
based on its own model of jitter. It is thus hard to compare
the results on real voices since each algorithm is, in effect,
measuring a different thing. The best way to evaluate the
Table 2: Naming of the jitter estimation algorithms.
Name
Summary
Jitt
Global estimation based on the average difference in
period length
STJE
Local estimation based on the difference in length of every
2 periods
LocJitt
Local estimation based on the non-monotonic differenc e
in period length
−60
−40
−20
0
20
40
60
Power (dB)
0 20 40 60 80 100 120 140 160 180
Real voice:
ε = 1 (second case)
Frequency (degrees)
Figure 5: Power spectrum of harmonic and subharmonic parts of a
real voice. The jitter measured on the time signal was 1 sample but
the STJE algorithm counted 5 crossings.
different algorithms is on their ability to perform a certain
task. In our case we decided to compare the algorithms in
their capability of detecting a pathologic voice. This way,
we are not interested in their ability of providing a good
estimate on the amount of irregularity of the glottal cycles
but only if they can discriminate the irregularities that
correspond to pathological conditions as opposed to the
normal aperiodicity observed in natural voices.
For this purpose, two databases were analysed, the MEEI
databases, provided by KayPENTAX, and the database DB02
created for this study and presented earlier.
The goals of the analysis were first, to test if each
algorithm was good enough to be used by itself to distinct
pathologic from normal voices, and second, to find out
which algorithm had the best per formance for such task.
To evaluate both the pitch marking methodology and the
jitter estimation algorithm a set of 14 tools were created:
(i) dympSTJE: STJE based on dypsaMP’s pitch marks,
jitter measured as a percentage of the period,
(ii) dympSTJEa: same as previous but with jitter mea-
sured as an absolut value in microseconds,
(iii) dympJitt: Jitt based on dypsaMP’s pitch marks, jitter
measured as a percentage of the period,
(iv) dympJitta: same as previous but with jitter measured
as an absolute value in microseconds,
EURASIP Journal on Advances in Signal Processing 7
(v) dympLocJitt: LocJitt based on dypsaMP’s pitch
marks, jitter measured as a percentage of the period,
(vi) dympLocJitta:sameaspreviousbutwithjittermea-
sured as an absolut value in microseconds,
(vii) mdvpJitt: Jitt using MDVP’s pitch marks, jitter
measured as a percentage of the period,
(viii) mdvpJitta: same as previous but w ith jitter measured
as an absolut value in microseconds,
(ix) mdvpLocJitt: LocJitt using MDVP’s pitch marks,
jitter measured as a percentage of the period,
(x) mdvpLocJitta:sameaspreviousbutwithjittermea-
sured as an absolute value in microseconds,
(xi) praatJitt: Jitt using MDVP’s pitch marks, jitter mea-
sured as a percentage of the period,
(xii) pr aatJitta: same as previous but with jitter measured
as an absolut value in microseconds,
(xiii) pr aatLocJitt: LocJitt using Praat’s pitch marks, jitter
measured as a percentage of the period,
(xiv) praatLocJitta: same as previous but with jitter mea-
sured as an absolute value in microseconds.
The preliminary results with the STJE algorithm showed
that, when compared with other methods, it has a reduced
dependency on the pitch marking tool being used. This
is because the algorithm is based on spectral analysis,
while the remaining methods are temporalbased. These
results, together with the computational complexity of the
algorithm, justify its use only in conjunction with the pitch
marking tool dymp.
8.1. Decision Threshold. All the tools provided their own
estimate on the amount of jitter in the input signal. Since
we require a binary decision regarding the possibility of the
voice being pathological or not, a decision threshold must be
found for each tool.
To tune the thresholds we have used a group of 50
pathological and 50 normal voices randomly selected from
the MEEI data set presented earlier. Since some data was
sampled at 25 kHz and some at 50 kHz, we decided to start
by converting all voices to 25 kHz and then to oversample
them to 44.1 kHz. In order to avoid overtraining, the data
set was divided into 10 randomly chosen groups with five
pathologic and five nonpathologic voices each. A 10-fold
cross-validation was then preformed, where, in each fold,
the threshold was selected based on nine of these groups (a
total of 40 samples), but its performance was evaluated on
the remaining group of 10 voices. By rotating the left-out
group, ten tests were conducted and the results are presented
in Table 3. The mean accuracy is the average of the percentage
of correct pathological/nonpathological voice decisions for
each fold. The variance of the 10 results is also presented.
This table shows that the different tools provide different
estimates for jitter not only because they rely on different
models for jitter but also because the results are based
on different pitch marking methods. This can explain, for
Table 3: Results of the 10-fold cross validation procedure. The
mdvpLocJitta tool produced the better average accuracy with a low
variance on the 10 tests.
Mean accuracy Variance Threshold
dympSTJE 76% 2% 3.44%
dympJitt 68% 2% 0.72%
dympLocJitt 68% 2% 0.66%
mdvpJitt 70% 0% 0.44%
mdvpLocJitt 70% 0% 0.40%
praatJitt 78% 3% 0.15%
praatLocJitt 74% 2% 0.12%
dympSTJEa 81% 2% 250.1 μs
dympJitta 70% 1% 46.1 μs
dympLocJitta 71% 1% 60.9 μs
mdvpJitta 82% 1% 19.1 μs
mdvpLocJitta 84% 1% 19.6 μs
praatJitta 80% 2% 8.6 μs
praatLocJitta 79% 2% 7.4 μs
example, the difference between the threshold from dympJitt
and mdvpJitt,orbetweendympLocJitt and dympSTJE.
The results of the 10-fold cross validation procedure were
used to calculate the best decision threshold for each tool.
The values are also presented in Table 3 .
8.2. Tool Evaluation. After the definition of the best thresh-
olds for pathological/nonpathological voice classifier, the
different tools were evaluated in the two previously described
database: the subset of the MEEI and DB02.
On the selected subset of the MEEI database, the tools
showed a similar behaviour to what was observed in the
10-fold cross validation test: the best PM locator is the
MDVP software. Regarding the jitter estimation tool, the
STJE algorithm performed better than the remaining tools.
Comparing this result with the 10-fold test, it is clear that
the larger variability of values that this algorithm produces
makes it more dependent on the size of the data, that is,
used to tune the threshold. Except for the case of pitch
marks produced by the Praat tool, the new LocJitt algorithm
performed equal to or better than the common Jitt measure.
Another interesting result is the better performance
of absolute jitter values (measured in microsecond) over
relative ones (measured in %) of the glottal period sequence.
This observation suggests that there is a certain amount
of aperiodicity that seems to indicate the presence of a
pathology, that is, independent of the length of the glottal
cycle. The use of relative jitter measures can prevent the
detection of a pathology when the voice has a very low
fundamental frequency, that would be detected with an
absolute jitter measurement. Finally, the STJE algorithm
seems to present a good accuracy, although it provides much
higher thresholds combined with a rather low robustness
(defined by a larger variance).
To see how the tools behaved in a completely different
databases we also performed the evaluation on the DB02
database. This database, although smaller, had the advantage
8 EURASIP Journal on Advances in Signal Processing
Table 4: Results of the evaluation on the full databases.
MEEI DB02
dympSTJE 83% 69%
dympJitt 71% 88%
dympLocJitt 71% 88%
mdvpJitt 73% 63%
mdvpLocJitt 75% 63%
praatJitt 80% 69%
praatLocJitt 77% 69%
dympSTJEa 87% 69%
dympJitta 75% 88%
dympLocJitta 76% 88%
mdvpJitta 84% 63%
mdvpLocJitta 85% 63%
praatJitta 82% 69%
praatLocJitta 82% 69%
of not being used in the threshold tuning process, plus,
itwasrecordedinacompletelydifferent environment.
Table 4 presents interesting results when compared to the
previous ones. A general analysis shows that the results for
this database are quite different. Firstly, STJE performance
decreases, probably explained by the fact that these voices
were recorded with a much higher sampling frequency, con-
taining also more noise, which will increase the probability
of intersections in the frequency domain.
Secondly, tools using mdvp’s PM seem also to provide
lower accuracies on the new Database. It is a fact that
MDVP is sensitive to noise, which may probably influence
the localization of the Pitch Marks, conditioning the final
Jitter estimation. On the other hand, Praat seems to present,
for a noisy environment, more accurate results; this fact is
also described in literature [6].
For evaluation on DB02, the best performance goes
for the tools using the dymp pitch marking tool. Due to
the low number of voices in this database, it is assumed
acceptable the fact that no differences between Jitt and LocJitt
algorithms are detected. Also, in this database, there were no
noticeable differences in performance of absolute jitter values
over relative ones. This can be explained by the smaller size of
this database and by the fact that it was recorded at a higher
sampling rate (50 kHz).
All results, although preliminary, provide a very impor-
tant conclusion that the jitter seems to be in fact an impor-
tant measurement to indicate the existence of a possible
pathology of the vocal folds.
9. Conclusions and Future Work
The first conclusion is that although most previous results
use relative jitter values, in our study on the MEEI database
absolute jitter values produced better results in the detection
of pathological voices. This difference was not observed in
the DB02 which can be explained by the smaller size of this
database. It was expected that the amount of the disorder
(expressed by the parameter jitter) would depend directly
on the frequency of vibration of the vocal folds, but the
results suggest a different conclusion: the jitter threshold for
pathological voice seems to be independent of the period
length. In a future work we plan to extend this study,
analysing sustained vowels of the same speaker with a higher
and a lower pitch to see the influence of the fundamental
frequency on jitter measurements.
The dymp pitch marking tool, when a pplied to nonideal
conditions or to higher sampling frequencies, produced
the best performance. The inverse filtering technique is a
promising solution for clinical applications, where normally
it is difficult to provide an ideal acoustic environment.
Concerning the new proposed measure for jitter, LocJitt,
it provided the highest accuracy and the minimum variance,
during the parameter tuning process. In the evaluation on
the full database the best results for the MEEI database were
achieved with the STJE algorithm; however, the result seems
to be dependent on the database since it did not performed
as well on the DB02. The only case when Jitt outperforms
LocJitt is when the pitchmarks are computed with the Praat
tool and when using relative jitter. In all other cases and for
both databases LocJitt achieved results that are equal to or
better than Jitt.
An interesting future work would be to continue the
recordings of the DB02 database in order to have a significant
number of entries to better adjust threshold levels, not only
for an individual jitter evaluation but also for more complex
evaluation wh ere jitter is one of several features to detect
perturbations in voice.
At last, the database DB02 also include other exams, like
the sustained vowel with increasing pitch, the text reading, or
even the AEIOU exam, that were not yet used. We hope that
further research on these exams will bring useful information
about the effect of the different pathologies in the mode of
vibration of the vocal folds.
As final conclusion, we would to reinforce that the
objective measures of voice quality resulting from acoustic
analysis can be a very powerful tool, not just for pathological
voice detection but also for other domains like voice-therapy
or even professional voice coaching. The joint effort of
physicians and engineers should be targeted not only in
finding voice disorders but, most importantly, in preventing
them.
Acknowledgments
The authors would like to acknowledge the support of Cost
Action 2103 for this work, namely, in funding the participa-
tion of the first author in the “Multi-disciplinary Summer
Training School on Voice Assessment” in Tampere, Finland.
This work was also partially funded by the Portuguese
Foundation for Science and Technology (FCT).
References
[1]J.P.DworkinandR.J.Meleca,Vocal Pathologies: Diagnosis,
Treatment & Case Studies, Singular, San Diego, Calif, USA,
1996.
EURASIP Journal on Advances in Signal Processing 9
[2] J.Kreiman,B.R.Gerratt,G.B.Kempster,A.Erman,andG.S.
Berke, “Perceptual evaluation of voice quality: review, tutorial,
and a framework for future research,” Journal of Speech and
Hearing Research, vol. 36, no. 1, pp. 21–40, 1993.
[3] “Multi-Dimensional Voice Program, Model 5105”.
[4] P. Boersma and D. Weenink, “Praat, a system for doing
phonetics by computer,” Glot International, vol. 5, pp. 341–
345, 2001.
[5] J. Schoentgen, “Stochastic models of jitter,” Journal of the
Acoustical Soci ety of America, vol. 109, no. 4, pp. 1631–1650,
2001.
[6] O. Amir, M. Wolf, and N. Amir, “A clinical comparison
between two acoustic analysis softwares: MDVP and Praat,”
Biomedical Signal Processing and Control, vol. 4, no. 3, pp. 202–
205, 2009.
[7] J. I. Godino-Llorente and P. Gomez-Vilda, “Automatic detec-
tion of voice impairments by means of short-term cepstral
parameters and neural network based detectors,” IEEE Trans-
actions on Biomedical Engineering, vol. 51, no. 2, pp. 380–384,
2004.
[8]R.J.Moran,R.B.Reilly,P.deChazal,andP.D.Lacy,
“Telephony-based voice pathology assessment using auto-
mated speech analysis,” IEEE Transactions on Biomedical
Engineering, vol. 53, no. 3, pp. 468–477, 2006.
[9] P. G
´
omez-Vilda, R. Fern
´
andez-Baillo, V. Rodellar-Biarge, et
al., “Glottal source biometrical signature for voice pathology
detection,” Speech Communication, vol. 50, no. 9, pp. 759–781,
2009.
[10] D.Wong,M.R.Ito,N.B.Cox,andI.R.Titze,“Observation
of perturbations in a lumped-element model of the vocal folds
with application to some pathological cases,” The Journal of the
Acoustical Society of America, vol. 89, no. 1, pp. 383–394, 1991.
[11] L. Lehto, M. Airas, E. Bj
¨
orkner, J. Sundberg, and P. Alku,
“Comparison of two inverse filtering methods in parameter-
ization of the glottal closing phase characteristics in different
phonation types,” The Journal of Voice, vol. 21, no. 2, pp. 138–
150, 2007.
[12] B. S. Atal and S. L. Hanauer, “Speech analysis and synthesis
by linear prediction of the speech wave,” The Journal of the
Acoustical Society of America, vol. 50, no. 2B, pp. 637–655,
1971.
[13] “Disordered Voice Database and Program, Model 4337,” 1994.
[14] A. Kounoudes, P. Naylor, and M. Brookes, “The DYPSA
algorithm for estimati on of glottal closure instants in voiced
speech,” in Proceedings of IEEE International Conference on
Acoustics, Speech, and Signal Processing (ICASSP ’02), vol. 1,
pp. 349–352, Orlando, Fla, USA, May 2002.
[15] M. Brookes, “VOICEBOX: Speech Processing Toolbox for
MATLAB,” 2003.
[16] M. Vasilakis and Y. Stylianou, “A mathematical model for
accurate measurement of jitter,” in Proceedings of the 5th
International Workshop on Models and Analysis of Vocal
Emissions for Biomedical Applications, Firenze University Press,
Firenze, Italy, December 2007.