Adaptive Techniques for Dynamic Processor Optimization Theory and Practice by Alice Wang and Samuel Naffziger_2 doc
Bạn đang xem bản rút gọn của tài liệu. Xem và tải ngay bản đầy đủ của tài liệu tại đây (2.5 MB, 19 trang )
4 David Scott, Alice Wang
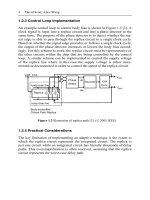
1.2.3 Control Loop Implementation
An example control loop to control body bias is shown in Figure 1.3 [3]. A
clock signal is input into a replica circuit and into a phase detector at the
same time. The purpose of the phase detector is to detect whether the sig-
nal edge is able to pass through the replica circuit in a single clock cycle.
Based on whether the signal edge precedes or follows a single clock cycle,
the output of the phase detector increases or lowers the body bias accord-
ingly. For this scheme to work, the replica circuit must be representative of
the other circuits within the chip that are being controlled by the control
loop. A similar scheme can be implemented to control the supply voltage
of the replica line where in this case the supply voltage is either incre-
mented or decremented in order to control the speed of the replica circuit.
Figure 1.3 Illustration of replica path [3]. (© 2005 IEEE)
1.2.4 Practical Considerations
The key limitation of implementing an adaptive technique is the extent to
which the replica circuit represents the integrated circuit. The replica is
just one circuit while an integrated circuit has literally thousands of delay
paths. This oversimplification is often resolved, assuming that the replica
circuit represents the worst-case delay path.
Chapter 1 Technology Challenges Motivating Adaptive Techniques 5
Figure 1.4 An illustration of critical paths in a design [4]. (© 2004 IEEE)
A typical histogram of delay path segments is shown in Figure 1.4 [4].
As seen from observing this histogram, many of the paths are much faster
than the slowest path, and this variation represents a further opportunity to
reduce power. The transistors in the faster paths can be substituted with
transistors with lower leakage. One way to do this is by selective use of
transistors with longer channel length. Due to the longer channel length,
these transistors will be slower but they will also have reduced leakage.
An example of this has already been implemented in an integrated cir-
cuit [5] through the use of a library of circuits that were implemented with
both long and short gate lengths. A slight area penalty was incurred to
make each circuit in the library footprint and layout compatible as in
Figure 1.5. Hence, these circuits can be freely interchanged at any point in
the design cycle to minimize power at the expense of path delay. This al-
gorithm can be similarly implemented using multiple threshold voltage
transistors.
The use of the above algorithm for substitution of longer gate length
transistors to reduce leakage can occur on a massive scale as is shown in
Figure 1.6. One result of implementing this type of algorithm is that all de-
lay path segments become more critical as the extra slack in the design is
harvested in order to reduce leakage current. Making all these paths more
critical will tend to make the design less tolerant of circuit variations or
circuit modeling inaccuracies.
6 David Scott, Alice Wang
Figure 1.6 Usage of long channel transistors in a design showing that a shorter
channel is required for a small fraction of the transistors in this design [5].
(©
2006 IEEE)
Figure 1.5 Two transistors with the same layout footprint. Layout area
efficiency is sacrificed in order to make the shorter channel transistor replaceable
by the longer channel transistor [5]. (© 2006 IEEE)
Chapter 1 Technology Challenges Motivating Adaptive Techniques 7
1.2.5 Impact of Temperature and Supply Voltage Variations
In the last section, we showed how the operating frequency varies with
supply voltage. In this section, we also factor in the temperature depend-
ence as well as across chip variations. The operating frequency as a
function of supply voltage is shown for two different temperatures in
Figure 1.7. At low temperatures, the mobility of the carriers is lower and
hence the operating frequency is lower when the supply voltage is high. At
high temperature, the lower threshold voltage favors low voltage opera-
tion. These two curves cross at what is normally considered the nominal
operating voltage. Hence in the absence of adaptive techniques, modern in-
tegrated circuits show very little sensitivity of operating frequency to tem-
perature.
Figure 1.7 A plot of frequency versus voltage for a circuit at two different tem-
peratures [6]. (© 2007 IEEE)
At low voltages, the type of behavior described in Figure 1.7 greatly fa-
vors high-temperature operation, and hence there is a great deal of sensi-
tivity of operating frequency to temperature at low voltages. In general,
there is a great deal of temperature variation across a chip [7]. At low volt-
ages, the coldest parts of the chip will have the most problem, while at
high temperature, the hottest parts of the chip will be slowest. Any adap-
tive scheme must account for the changing sensitivity to temperature at the
low and high operating voltages.
An analysis of the impact of supply voltage variation on the chip has
been previously done for two different cases [8]. This analysis was
Oscillator Frequency vs Voltage
0.0
0.5
1.0
1.5
2.0
2.5
0.4 0.5 0.6 0.7 0.8 0.9 1 1.1 1.2 1.3 1.4 1.5
Supply Voltage (Volts)
Frequency (Arb Scale)
Temperature = -40C
Temperature = 125C
Very convenient for a
nominal supply voltage
of 1.1V!
Temperature
dependence is a
significant factor for
adaptive scaling to
lower supply voltage
8 David Scott, Alice Wang
facilitated by recognizing that in steady state, the supply voltage across the
chip must satisfy the following equation:
2
SO
VRJ∇=
(1.2)
Figure 1.8a (Case 1) Supply voltage drop across a chip that has been wire
bonded with supply pads on the edge of the chip [8]. (© 2005 IEEE)
Figure 1.8b (Case 2) Supply voltage variations for flip chip where the power
supply pads are arrayed over the complete chip area [8]. (© 2005 IEEE)
Case 1 is the wire bond case where the perimeter of the chip is pinned to
the supply voltage and case 2, is the flip chip case where the supply and
grounds pins are placed in a mesh across the chip. In Figure 1.8a, the wire-
bound case is shown where clearly the maximum voltage supply loss is at
the center of the chip. For the flip chip case shown in Figure 1.8b, each
small part of the chip has the supply voltage pinned in the corners only,
and this pattern is arrayed over the entire chip with the amplitude dependent
Chapter 1 Technology Challenges Motivating Adaptive Techniques 9
on the local power supply current. The maximum operating frequency
of each of the path segments will depend on the local supply voltage.
1.3 Technology Issues Relating to Performance-
Enhancing Techniques
1.3.1 Threshold Voltage Variation
While in the previous section we dealt with variations in the supply volt-
age caused by on-chip voltage drops, in this section we discuss the varia-
tion in threshold voltage. The impact of threshold voltage variation is
shown in Figure 1.9 involving circuits with two different threshold volt-
ages. The sensitivity of the frequency to threshold voltage has the impact
of shifting the curve to the right as the threshold voltage increases.
Figure 1.9 As the threshold voltage is increased, the frequency versus supply
voltage curve is shifted to the right [6]. (© 2005 IEEE)
Ring Oscillator Frequency vs Supply Voltage
0.0
0.2
0.4
0.6
0.8
1.0
1.2
1.4
1.6
1.8
2.0
0.4 0.6 0.8 1 1.2 1.4 1.6
Supply Voltage (Volts)
Frequency (Arb. Scale)
Low VT Transistors
High VT Transistors
10 David Scott, Alice Wang
Figure 1.10a The mechanism of impact ionization is illustrated, with electron–
hole pairs being generated at the drain end of the channel. Some of these gener-
ated carriers end up being trapped in the gate oxide [6]. (© 2005 IEEE)
The impact of hot carrier-induced threshold voltage shift is shown in
Figure 1.10a. At high electric fields, carriers generated from impact ioniza-
tion are trapped in the gate oxide. In general, the transistor lifetime de-
creases with the cube of the substrate current, and the gate voltage depend-
ence of the substrate current is illustrated in Figure 1.10b. Also, there are
separate degradation characteristics from both ac- and dc-related stress
currents. It has also been found that the threshold voltage and other device
parameters can shift over the lifetime of the product and not always in the
same direction [8]. For example, the threshold voltage can recover after the
stress is removed [9].
Figure 1.10b A peak in the substrate current occurs when high current flow
and high electric field occur both at the same time [6]. (© 2005 IEEE)
Drain Current
Gate Voltage (Volts)
Log Substrate Current
High Electric Field
Low Current
Low Electric
Field
High Current
Drain Current
Gate Voltage (Volts)
Log Substrate Current
High Electric Field
Low Current
Low Electric
Field
High Current
GateGate
-
+
-
Impact
Ionization
Holes
GateGate
-
+
-
Impact
Ionization
Holes
Chapter 1 Technology Challenges Motivating Adaptive Techniques 11
Another source of threshold variation is negative bias temperature insta-
bility (NBTI). This phenomenon is commonly associated with p-channel
transistors and is caused by the movement of charge in the gate oxide and
at the interface. Of course in an integrated circuit, each transistor has a
unique set of bias conditions over its lifetime and hence each transistor de-
grades differently. For a typical stress condition of negative bias, the varia-
tion of threshold voltage with time is given by the following equation [10]:
exp( / ) exp( | |)
n
th A G
VC EkT Vt
β
Δ= −
(1.3)
where
A
E is the activation energy,
G
V is the gate voltage, and t is the
stress time, and the other parameters are constants.
NBTI degradation has the biggest impact at lower supply voltage. This
is due to the loss of headroom as the p-channel threshold voltage increases
in absolute value. Previous work [10] has shown that as a ring oscillator is
stressed, the low voltage frequency of operation is degraded due to the in-
crease of p-channel threshold voltage. The impact of threshold voltage on
low frequency operation can be observed in Figure 1.7. The circuit using
transistors with the higher threshold voltage has a lower frequency of op-
eration.
1.3.2 Random Dopant Fluctuations
As dimensions continue to shrink, the number of dopants in the channel
has become discrete and measurable in discrete quantities The small num-
ber doping atoms in the channel means that the threshold voltage will be
highly variable and will vary for transistors with otherwise identical char-
acteristics. The variation in threshold voltage can be related to the average
doping by the following equation [11]:
3
4
4
4
2
th
Si B
ox
V
ox
eff eff
q
T
N
WL
εφ
σ
ε
⎛⎞
⎜⎟
=••
⎜⎟
⎝⎠
(1.4)
Measured data shown in Figure 1.11 shows that the standard deviation
for typical state of the art dimensions is quite significant, with standard de-
viation in the range of 30 mV–50 mV being quite feasible. For a chip with
many millions of gates, transistors with threshold voltages more than 5
standard deviations from the mean are relatively common.
12 David Scott, Alice Wang
Figure 1.11 Measured data showing the increase in threshold voltage variation
as the area of the transistor is decreased. Diamonds are for strong inversion while
triangles are for subthreshold region [11]. (© 2005 IEEE)
In terms of applying adaptive techniques, the difficulty that the circuit
designer faces is compounded. Identical transistors placed in different
parts of the circuit tend to have randomly different values of threshold vol-
tage as described by Equation 1.4 and Figure 1.11.
In addition, as body bias is applied, the randomness of the threshold vol-
tage will tend to increase [12]. When body bias is increased, more dopants
are incorporated into the depletion region and hence the randomness of
these additional dopants is also incorporated into the transistor.
New transistor design techniques are continuously under development,
and these scaled transistors offer new challenges to the designer. Taking
advantage of these new transistor design techniques can be of great value
to the circuit design. As shown in Figure 1.12, Yasuda [12] found that as
body bias is applied to a collection of transistors, their threshold voltage
distribution has a tendency to reorder. That is to say different transistors
have different responses to body bias and hence the transistor with the
lowest threshold voltage in a distribution may no longer be the lowest
when body bias is applied. Certainly, this is a concern to a designer who is
using body bias to control transistor performance or leakage.
Chapter 1 Technology Challenges Motivating Adaptive Techniques 13
Figure 1.12 The benefit of an optimized transistor design is shown where the
threshold voltage shift with body bias is constant [12]. (© 2005 IEEE)
It has been shown that new transistor design techniques, taking advan-
tage of Fermi level pinning present in [13], offer an advantage in the tran-
sistor design. If the channel of the transistor is optimally designed, the
response of the transistor to applied body bias can be made much more
predictable.
1.3.3 Design in the Presence of Threshold Voltage Variation
When designing an adaptive system, the designers must contend with a
number of sources of threshold voltage variation that are not under their
direct control. Transistor characteristics and in particular threshold voltage
can vary from wafer to wafer and also from die to die within a wafer.
These variations are generally known as global variations. In addition, the
designers must contend with the local variations that occur within a die.
Local variations can be due to random dopant fluctuations including the
transistors having different sensitivities to back gate bias, line edge rough-
ness of the gate material, and systematic changes in device behavior such
as temperature and temperature gradients across the die.
Transistor characteristics can also change over the lifetime of the inte-
grated circuit as a result of hot carrier effects or negative bias temperature-
induced (NBTI) changes in the threshold voltage. In addition, new tech-
niques to improve transistor performance by using mechanical stress [14]
also will bring additional sources of variation.
As a result of all of the above, designers are generally not looking at a
single line on the frequency versus voltage curve that can be modulated
with back gate bias. They must think of this line as having considerable
14 David Scott, Alice Wang
variations that can occur in the transistor through fabrication, during its
1.4 Technology Issues Associated with Leakage
Reduction Techniques
A common technique to reduce subthreshold leakage is to merely increase
the threshold voltage by applying back gate bias [15, 16]. In Figure 1.13,
the waveforms show how the leakage of an integrated circuit can be re-
duced when the system is going into a lower power mode of operation. As
discussed earlier, this type of scheme requires substrate terminals of the
transistors to be available globally, and hence these two extra supply lines
must be available to be globally routed. Also the substrate pump requires
additional area and consumes current in order to operate. The operating
current associated with the substrate pump offsets the leakage gains. The
well bias generator function is often conveniently provided by the same
supply as is used for the IO circuits, and hence an extra penalty for provid-
ing this extra supply is normally not incurred.
Figure 1.13 One scheme to reduce leakage is to merely apply back gate bias to
all transistors [6]. (© 2005 IEEE)
The need for a substrate pump has been avoided by some designers by
raising Vss rather than having Vbn negative [1]. This type of scheme has
the added benefit of current being reduced due to both back gate bias and
width, with the width of this line being defined by the sum total of all the
operation, and over its lifetime.
Chapter 1 Technology Challenges Motivating Adaptive Techniques 15
the lower operating voltage. However, switching of the Vss supply does
require footer transistors that are large enough to conduct the entire active
current of the circuit without having an excessive voltage drop. In addition,
once added the footer transistors themselves become leakage sources.
1.4.1 Practical Considerations
The ability of a technology to support state-of-the-art integrated circuits
and systems is conventionally judged by its leakage versus “on” current.
Figure 1.14 shows such plots for three different technologies [14]. The in-
dividual data points for each different technology are achieved as a result
of measuring transistors with different gate lengths and threshold voltage
implants. In addition the normal process variations, discussed in the previ-
ous section, can play a role in smoothing out these curves. One important
aspect of this tradeoff to note is that the “Ion” scale is linear while the leak-
age current scale is exponential.
Figure 1.14 Leakage versus ion for three different technologies [14]. (© 2005
IEEE)
Although Process 1 has a higher “on” current and higher “off” current
than the process optimized for mobile applications, both of the plots are
16 David Scott, Alice Wang
asymptotic to the same line. In general, when the data points are near this
line, the leakage within the transistor is dominated by subthreshold leak-
age. In this regime, the designer can trade “on” current for leakage current.
Once the transistor is away from this line, the use of adaptive techniques to
control leakage actually only results in lower performance with no savings
in leakage.
1.4.2 Sources of Leakage Current
As seen in Figure 1.15, there are several sources of leakage current, and
each of these has a different dependence on both voltage and temperature
[17]. Understanding of the relation between leakage and both voltage and
temperature requires consideration of each leakage mechanism separately.
Figure 1.15 Sources of transistor leakage [17]. (© 2005 IEEE)
For different technologies, different leakage current sources dominate
depending on how the requirements for the transistor design. In addition,
within a given temperature, different components of leakage dominate as
the voltage and temperature vary. In this section, we break down the dif-
ferent sources of leakage so that each can be discussed independently with
the knowledge that in the end the components are summed together.
Chapter 1 Technology Challenges Motivating Adaptive Techniques 17
Figure 1.16 Source current or subthreshold leakage current [17].
(© 2005 IEEE)
As show in Figure 1.16, source current, referred to most often as sub-
threshold leakage current, is due to thermal emission of the carriers over a
barrier. The magnitude of the leakage current depends exponentially on the
barrier height with temperature modulating this exponential dependence.
Transistors with a high threshold voltage have a large barrier and hence
have little subthreshold leakage. High-performance technologies tend to
have lower threshold voltages. This in turn means a lower barrier height
and hence high-performance technologies generally have a relatively high
subthreshold leakage or source current. The height of the barrier in short
channel devices can be modulated by the drain voltage, and this phenome-
non is often referred to as drain-induced barrier lowering (DIBL) [18]. In a
real transistor, the barrier height varies along the width of the transistor.
Hence the current will always preferentially flow where the height of the
barrier is lowest.
Carriers can also flow through the gate oxide by tunneling. This is a
quantum mechanical effect, and the amount of current depends on the
work function between the silicon and the insulator and the insulator
thickness and the applied voltage. Since the amount of current depends on
the oxide thickness but not the dielectric constant, technologist in modern
technologies try to scale the dielectric constant rather than the oxide thick-
ness in order to increase the transistor operating current.
18 David Scott, Alice Wang
Figure 1.17 Sources of GEDL current are due to band-to-band tunneling that is
often assisted by traps [19]. (© 2002 IEEE)
The source of leakage current that is the most challenging to control in
scaled technologies is the gate edge diode leakage (GEDL) [19] as illus-
trated in Figure 1.17. This current is due to band-to-band tunneling in the
presence of high electric field and traps in the band gap. If the electric field
is high enough, carriers can simply tunnel across the band gap. However,
most often traps in the silicon allow the tunneling to be trap assisted, and
the current flow is increased significantly due to the smaller tunneling dis-
tance involved. An illustration of this mechanism is given in Figure 1.17.
As seen in Figure 1.17, the presence of traps in the mid-gap can decrease
the required tunneling distance by a factor of 2. Also as the number of
traps increase, the tunneling current will increase. The tunnel current is
given as [19]
2
~ exp( / )
BTBT ov
JALE E
β
−
(1.5)
where
ov
L is the gate to drain overlap and
E
is the electric field.
Extensive simulations have been done to understand this mechanism
[19]. GEDL is so heavily dependant on peak electric field that its charac-
teristic behavior depends on the location of the peak electric field. Hence
the profile of the doping species near the drain of the transistor design has
a large role in determining this behavior. Figure 1.18 shows an NMOS
transistor with the peak electric field at the semiconductor surface. The re-
sulting current flow is often referred to gate-induced diode leakage (GIDL)
current reflecting the proximity and sensitivity of the resulting electric
field to the gate voltage.
Chapter 1 Technology Challenges Motivating Adaptive Techniques 19
Figure 1.18 The peak electric field is at the surface and influenced by the gate
voltage. (© 2005 IEEE) [19]
In Figure 1.19, the potential profile of a PMOS transistor is shown. In
this transistor, the peak electric file is below the surface and hence the
electric field is not sensitive to the gate voltage.
Figure 1.19 When the peak electric field is below the surface, the current is not
sensitive to gate voltage [19]. (© 2005 IEEE)
20 David Scott, Alice Wang
1.4.3 Transistor Design for Low Leakage
As technologies scale, it is becoming more difficult to minimize transistor
leakage. Reducing the subthreshold current is achieved by increasing the
number of dopants in the channel in order to get more charge into the de-
pletion region. However, the increase in dopants in the depletion region
also results in a higher electric field which in turn increases the GIDL or
GEDL current. In addition, if body bias is applied, the resulting electric
field will be even higher. Often the total leakage will increase even though
the subthreshold leakage is decreasing. An illustration of this effect is
shown in Figure 1.20. These authors [20] show that for devices using a
conventional dielectric the GIDL current increase with a body bias offsets
the decrease in subthreshold leakage.
This same figure shows the promise of new transistor design techniques
that can be applied as the result of employing an alternate dielectric such
as HfSiON. Due to the Fermi level pinning associated with the resulting
dielectric interface, the number of dopants required and the peak electric
field are substantially reduced. It is, however, necessary to design the tran-
sistor profile to be able to stand off the short channel effects in modern
semiconductor devices. As can be seen from observing Figure 1.20, the
GIDL is substantially reduced, and thus, body bias is a viable technique for
reducing total leakage in this technology.
Figure 1.20 A comparison of the GIDL current against the total off current for
two different gate oxide materials [20]. (© 2005 IEEE)
Chapter 1 Technology Challenges Motivating Adaptive Techniques 21
1.5 Conclusion
Variability and leakage are major technology challenges for both present
and future integrated circuits, and the adoption of adaptive techniques are
actually important tools to overcome the technology challenges of variabil-
ity and leakage. Correct implementation of adaptive techniques in inte-
grated circuits and systems is a significant challenge in itself. In our exam-
ple, we have shown that while the active leakage reduction techniques
reported to date have been successful, they also tend to significantly re-
duce the designers’ error margin.
New transistor design techniques are bright spots on the horizon for de-
signers. Recent innovations in transistor design give designers significant
leverage in being able to compensate their circuits for threshold voltage
variation, supply voltage variation, and temperature. These innovations
serve as the key attack points for making adaptive techniques effective in
the design of integrated circuits and systems.
References
[1] L. Clark et al., “An Embedded 32b Microprocessor Core for Low-Power and
High-Performance Applications,” IEEE Journal of Solid-State Circuits, Vol.
36, pp. 1599–1608, November 2001.
[2] M. Meijer, F. Pessolano, and J. P. de Gyvez, “Limits to Performance Spread
Tuning Using Adaptive Voltage and Body Biasing,” International Sympo-
sium on Circuits and Systems, pp. 5–8, May 2005.
[3] J. T. Kao, M. Miyazaki, and A. P. Chandrakasan, “A 175-mV Multiply-
Accumulate Unit Using an Adaptive Supply Voltage and Body Bias Archi-
tecture,” IEEE Journal of Solid-State Circuits, Vol. 37, No. 11, pp.
1545–1554, November 2002.
[4] T. McPherson, R. Averill, D. Balazich, K. Barkley, S. Carey, Y. Chan, Y. H.
Chan, R. Crea, A. Dansky, R. Dwyer, A. Haen, D. Hoffman, A. Jatkowski,
M. Mayo, D. Merrill, T. McNamara, G. Northrop, J. Rawlins, L. Sigal, T.
Slegel, D. Webber, P. Williams, and F. Yee, “760MHz G6 S/390 Microproc-
essor Exploiting Multiple Vt and Copper Interconnects,” IEEE International
Solid-State Circuits Conference, Vol. XLIII, pp. 96–97, February 2000.
[5] S. Rusu, S. Tam, H. Muljono, D. Ayers, J. Chang, “A Dual-Core Multi-
Threaded Xeon® Processor with 16MB L3 Cache,” IEEE International
Solid-State Circuits Conference, pp. 102–103, February 2006.
[6] D. Scott, “Technology Challenges of Adaptive Techniques”, Microprocessor
Forum, IEEE International Solid-State Circuits Conference, February 2007.
[7] H. Su, F. Liu, A. Devgan, E. Acar, S. Nassif, “Full Chip Leakage Estimation
Considering Power Supply and Temperature Variations,” International
22 David Scott, Alice Wang
Symposium on Low Power Electronics and Design, pp. 78–83, August
[8] K. Shakeri and J. D. Meindl, “Compact Physical IR-Drop Models for
Chip/Package Co-Design of Gigascale Integration (GSI),” IEEE Transac-
tions on Electron Devices, Vol. 52, No. 6, pp. 1087–1096.
[9] T C. Ong, M. Levi, P K. Ko, C. Hu, “Recovery of Threshold Voltage After
Hot-Carrier Stressing,” IEEE Transactions on Electron Devices, Vol. 35, No.
7, pp. 978–984, July 1988.
[10] A. T. Krishnan, V. Reddy,S. Chakravarthi, J. Rodriguez, S. John, S. Krish-
nan, “NBTI Impact on Transistor and Circuit: Models, Mechanisms and
Scaling Effects [MOSFETs],” IEEE IEDM Technical Digest, pp. 349–352,
December 2003.
[11] H. Mizuno, K. Ishibashi, T. Shimura, T. Hattori, S. Narita, K. Shiozawa, S.
Ikeda, and K. Uchiyama, “An 18- A Standby Current 1.8-V 200-MHz Mi-
croprocessor with Self-Substrate-Biased Data-Retention Mode,” IEEE Jour-
nal of Solid-State Circuits, Vol. 34, No. 11, pp. 1492–1500, November 1999.
[12] Y. Yasuda, N. Kimizuka, Y. Akiyama, Y. Yamagata, Y. Goto, and K. Imai
“System LSI Multi-Vth Transistors Design Methodology for Maximizing Ef-
ficiency of Body-Biasing Control to Reduce Vth Variation and Power Con-
sumption,” IEDM Technical Digest, pp. 66–71, December 2005.
[13] C. C. Hobbs et al., “Fermi Level Pinning at the Polysilicon/Metal Oxide In-
terface-Part 1,” IEEE Transactions on Electron Devices, Vol. 51, No. 6, pp.
971–977, June 2004.
[14] C H. Jan et al., “A 65nm Ultra Low Power Logic Platform Technology Us-
ing Uni-Axial Strained Silicon Transistors,” IEEE IEDM Technical Digest,
pp. 60–63, December 2005.
[15] T. Chen and S. Naffziger, “Comparison of Adaptive Body Bias (ABB) and
Adaptive Supply Voltage (ASV) for Improving Delay and Leakage Under
the Presence of Process Variation,” IEEE Transactions on VLSI Systems,
Vol. 11, No. 5, pp. 888–899, October 2003.
[16] K. Ishibashi, “Substrate Bias Techniques for SH4,” Short Course on Physical
Design for Low Power, High Performance Microprocessor Circuits, 2001
Symposium on VLSI Circuits, 2001.
[17] D. Scott, S. Tang, S. Zhao, and M. Nandakumar, “Device Physics Impact on
Low Leakage, High Speed DSP Design Techniques,” Proceedings. Interna-
tional Symposium on Quality Electronic Design, pp. 349–354.
[18] R. R. Troutman, “VLSI Limitations from Drain-Induced Barrier Lowering,”
IEEE Transactions on Electron Devices, Vol. 26, No. 4, pp. 461–469, April
1979.
[19] S. Zhao, S. Tang, M. Nandakumar, D. B. Scott, S. Sridhar, A. Chatterjee, Y.
Kim, S H. Yang, S C. Ai, and S. P. Ashburn, “GIDL Simulation and Opti-
mization for 0.13um, 1.5 V Low Power CMOS Transistor Design,” Interna-
tional Conference on Simulation of Semiconductor Processes and Devices,
pp. 43–46, 2002.
25–27, 2003, Seoul, Korea.
