Báo cáo hóa học: " Research Article A Sequential Procedure for Individual Identity Verification Using ECG" potx
Bạn đang xem bản rút gọn của tài liệu. Xem và tải ngay bản đầy đủ của tài liệu tại đây (1.9 MB, 13 trang )
Hindawi Publishing Corporation
EURASIP Journal on Advances in Signal Processing
Volume 2009, Article ID 243215, 13 pages
doi:10.1155/2009/243215
Research Article
A Sequential Procedure for Individual Identity
Verification Using ECG
John M. Irvine
1
and Steven A. Israel
2
1
Advanced Signal Processing and Image Exploitation Group, Draper Laboratory, 555 Technology Square, MS 15,
Cambridge, MA 02139, USA
2
Systems and Technology Division, SAIC, 4001 Fairfax Drive, Suite 450, Arlington, VA 22203, USA
Correspondence should be addressed to Steven A. Israel,
Received 20 October 2008; Revised 14 January 2009; Accepted 24 March 2009
Recommended by Kevin Bowyer
The electrocardiogram (ECG) is an emerging novel biometric for human identification. One challenge for the practical use of ECG
as a biometric is minimizing the time needed to acquire user data. We present a methodology for identity verification that quantifies
the minimum number of heartbeats required to authenticate an enrolled individual. The approach rests on the statistical theory
of sequential procedures. The procedure extracts fiducial features from each heartbeat to compute the test statistics. Sampling
of heartbeats continues until a decision is reached—either verifying that the acquired ECG matches the stored credentials of the
individual or that the ECG clearly does not match the stored credentials for the declared identity. We present the mathematical
formulation of the sequential procedure and illustrate the performance with measured data. The initial test was performed on
a limited population, twenty-nine individuals. The sequential procedure arrives at the correct decision in fifteen heartbeats or
fewer in all but one instance and in most cases the decision is reached with half as many heartbeats. Analysis of an additional 75
subjects measured under different conditions indicates similar performance. Issues of generalizing beyond the laboratory setting
are discussed and several avenues for future investigation are identified.
Copyright © 2009 J. M. Irvine and S. A. Israel. This is an open access article distributed under the Creative Commons Attribution
License, which permits unrestricted use, distribution, and reproduction in any medium, provided the original work is properly
cited.
1. Introduction
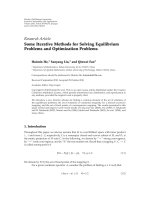
The biometric verification process can be broken into five
major functional blocks: data collection, signal process-
ing, feature extraction, comparison (database lookup), and
returning a decision (Figure 1). Verification systems have
two competing requirements: (1) quickly processing samples
and returning a decision to minimize the user time, and (2)
operate at very high probability of detections (Pds) with low
false alarm rates (FARs). With the advances in computing,
the longest duration function in Figure 1’s critical path is the
data collection. This paper presents a method for quantifying
the minimum number of heartbeats required for verifying
the identity of an individual from the electrocardiogram
(ECG) signal. The minimum number of heartbeats required
provides a user-centric measure of performance for an
identity verification system. The outcome of our research
forms the basis for selecting elements of an operational ECG
verification system.
Since 2001, researchers have identified unique character-
istics of the ECG trace for biometric verification, particularly
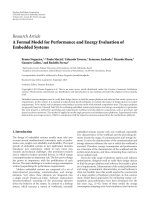
with respect to access control [1–14]. To illustrate, consider
the heartbeats from several different individuals (Figure 2).
Although each heartbeat follows the same general pattern,
differences in the detailed shape of the heartbeat are evident.
We exploit these shape differences across individuals to per-
form identity verification. The last 30 years have witnessed
substantial research into the collection and processing of
digital ECG signals [15–17]. In addition, a special issue of
this journal was devoted to “Advances in electrocardiogram
signal processing and analysis” in 2007. We build on this
wealth of information and apply it to the development of an
ECG verification system.
Hawkins [18] revealed that the traditional biometrics of
face, fingerprints, and iris can be forged. The traditional
biometrics cited above contain no inherent measure of
liveness. The ECG, however, is inherently an indication of
liveness and, consequently, is difficult to falsify. Israel et al.
2 EURASIP Journal on Advances in Signal Processing
Data
?
Signal
processing
Feature
extraction
Comparison
Decision
Stored
credentials
Figure 1: Simplified architecture for an authentication system.
[6] analyzed other cardiovascular modalities and found ECG
data most discriminating for human identification.
This paper illustrates a methodology and minimum
heartbeat performance metric using data and processing
from our previously published research [1–7]. This work
extends previous results in two ways. First, it focuses
on the identity verification problem, such as would be
appropriate for portal access. Second, the method developed
here quantifies the minimum number of heartbeats needed
for identity verification, thereby fixing the time needed to
collect user data. The next section summarizes the utility of
applying ECG information as a biometric. The following two
sections present the actual methodology, first discussing the
processing of the ECG signal and then deriving the actual
test statistic used for identity verification. We present results
from two data sets to illustrate performance. The final section
discussesanumberofpracticalissuesrelatedtoECGasa
biometric and suggests avenues for further investigation.
2. Background
This paper presents a new approach for processing the ECG
for identity verification based on sequential procedures. A
major challenge for developing biometric systems based on
circulatory function is the dynamic nature of the raw data.
Heartrate varies with the subject’s physical, mental, and
emotional state, yet a robust biometric must be invariant
across time and state of anxiety. The heartbeat maintains
its structure with changes in heartrate (Figure 2). Irvine
et al. [1–3, 5], Israel et al. [4, 6], and Biel et al. [8]
identified individuals based upon features extracted from
individual heartbeats. Wang et al. [9] followed a similar
approach using fiducial features, but then extended the
analysis based on a discrete cosine transform (DCT) of the
autocorrelation function. Shen et al. [10]andWubbeleretal.
[14] employed a template matching approaches. Additional
nonfiducial techniques have exploited principal components
analysis (PCA) [19–27] in the same manner as [28]applied
to face. Recently, a number of researchers have explored
improvements to representations of the ECG signal for
human identification [5, 9, 29]. In each case, the extracted
ECG attributes performed well for identifying individuals.
Early studies of ECG feature extraction used spectral
features to characterize the heartbeat [17]. Later, Biel et al.
[8] performed ECG feature extraction by estimating location
and magnitude information. Irvine et al. [2] showed that the
relative electrode position caused changes in the magnitude
of the ECG traces and used only temporal features. To these
ends, Israel et al. [4] identified additional fiducial positions
to characterize the relative intervals of the heartbeat and
performed quantitative feature extraction using radius of
curvature features.
Initial experiments for human identification from ECG
identified some important challenges to overcome. First,
approaches that rely on fiducial attributes, that is, features
obtained by identifying specific landmarks from the pro-
cessed signal have difficulty handling nonstandard heartbeats
and high noise floors. Agrafioti and Hatzinakos [30]applied
signal processing methods to address common cardiac
irregularities. A second challenge is to insure that the
identification procedure is robust to changes in the heartrate
arising from varying mental and emotional states. Irvine et
al. [1–3]andIsraeletal.[4, 6] addressed this issue through an
experimental protocol that varied the tasks performed by the
subjects during data collection. Third, PCA type algorithms
must sample a sufficiently wide population to ensure the best
generalization of their eigen features.
The ECG measures the electrical potential at the surface
of the body as it relates to the activation of the heart. Many
excellent references describe the functioning of the heart and
the factors affecting the ECG signal [15, 31, 32]. Because the
ECG consists of repeated heartbeats, the natural period of
the signal is amenable to a wealth of techniques for statistical
modeling. We exploit this periodic structure, treating the
heartbeat as the basic sampling unit for constructing the
sequential method.
3. Signal Processing
We segmented the data into two nonoverlapping, block
segmented by time, groups. Group 1 is the training data,
where labeled heartbeats are used to generate statistics about
each enrolled individual. Group 2 is the test data, which
contain heartbeats from the sensor and have known a
posteriori labels. The computational decision from the system
is either a confirmation that the individual is who they say
they are; or a rejection that the individual is not who they say
they are.
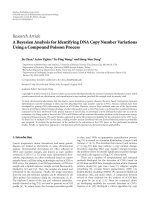
Processing of the ECG signal includes noise reduction,
segmentation of the heartbeats, and extraction of the features
from each heartbeat (Figure 3). Because the objective is to
minimize the data acquisition time for identity verification,
the enrollment time was not constrained. Two minutes of
data were used for enrollment and to train the verification
functions for each individual. Two additional minutes of
test data were available to quantify the required number
of heartbeats. For our concept of operations, however,
the individuals seeking authentication would only need
to present the minimum number of heartbeats, which is
expected to be on the order of second(s).
EURASIP Journal on Advances in Signal Processing 3
0 50 100 150 200 250
Time
Signal sampled at 250 Hz
0
0.1
0.2
0.3
0.4
0.5
0.6
0.7
0.8
0.9
1
Relative electrical potential signal
(a)
0 50 100 150 200 250
Time
Signal sampled at 250 Hz
0
0.1
0.2
0.3
0.4
0.5
0.6
0.7
0.8
0.9
1
Relative electrical potential signal
(b)
0 50 100 150 200 250
Time
Signal sampled at 250 Hz
0
0.1
0.2
0.3
0.4
0.5
0.6
0.7
0.8
0.9
1
Relative electrical potential signal
(c)
0 50 100 150 200 250
Time
Signal sampled at 250 Hz
0
0.1
0.2
0.3
0.4
0.5
0.6
0.7
0.8
0.9
1
Relative electrical potential signal
(d)
0 50 100 150 200 250
Time
Signal sampled at 250 Hz
0
0.1
0.2
0.3
0.4
0.5
0.6
0.7
0.8
0.9
1
Relative electrical potential signal
(e)
0 50 100 150 200 250
Time
Signal sampled at 250 Hz
0
0.1
0.2
0.3
0.4
0.5
0.6
0.7
0.8
0.9
1
Relative electrical potential signal
(f)
Figure 2: Segmented heartbeats from six individuals.
Extract fiducials
Filter, extract
fiducials
Compute
sequential test
statistic
Accept
H0
Accept
H1
Decision?
Continue sampling
Segmented
800700600500
Filtered ECGRaw ECG trace
Enrollment
Test
Collect a heartbeat
400
3002001000
0
20
40
60
80
100
−
40
−
20
RT
RS’
RP’
RL’
S’
P’
L’
T’
RS
RQ
RP
P
Q
R
S
T
8
8.5 9
10
9.5
0
20
40
60
80
−
40
−
20
88.5 9 109.5
−
700
−
600
−
550
−
500
−
650
Time
RT’
P
Q
R
S
P-Q
interval
Q-T
interval
S-T
segment
Ventricular
depolarization
Ventricular
repolarization
Atrial
depolarization
T
S’
P’
L’
T’
Stored credentials
μ, Σ
Figure 3: Signal processing for the sequential procedure.
4 EURASIP Journal on Advances in Signal Processing
0 2 4 6 8 101214161820
Time (seconds)
(a)
−750
−700
−650
−600
−550
−500
−450
Relative electrical potential
88.599.510
Time (seconds)
(b)
−700
−650
−600
−550
−500
Relative electrical potential
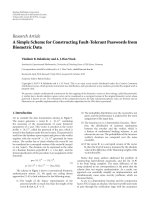
Figure 4: Raw ECG data 1000 Hz (a) 20 seconds (b) 2 seconds.
Figures 4(a) and 4(b) show a sample of high reso-
lution ECG data. The raw data contain both high and
low frequency noise components. These noise components
alter the expression of the ECG trace from its ideal struc-
ture. The low frequency noise is expressed as the slope
of the overall signal across multiple heartbeat traces in
Figure 4(a). The low frequency noise is generally associated
with changes in baseline electrical potential of the device
and is slowly varying. Over this 20-second segment, the
ECG can exhibit a slowly varying cyclical pattern, associated
with respiration, that is known as sinus arrhythmia [15].
The high frequency noise is expressed as the intrabeat
noise shown in Figure 4(b). The high frequency noise is
associated with electric/magnetic field of the building power
(electrical noise) and the digitization of the analog potential
signal (A/D noise). Additionally, evidence of subject motion
and muscle flexure must be removed from the raw traces
[33].
Multiple filtering techniques have been applied to the
raw ECG traces: heartbeat averaging [34, 35], wavelet [36,
37], least squares modeling [38, 39] and Fourier bandpass
filtering [40–42]. For any filtering technique, the design
constraints are to maintain as much of the subject-dependent
information (signal) as possible and design a stable filter
across all subjects.
As previously reported [4], the raw ECG traces were
bandpass filtered between 0.2 and 40 Hz. The filter was
written with a lower order polynomial to reduce edge effects.
Figure 5(a) illustrates the power spectra from a typical
1000 Hz ECG trace. The noise sources were identified, and
our notional bandpass filter overlays the power spectrum.
Figure 5(b) shows the power spectrum after the bandpass
filtering. Figure 6 contains the processed data for heartbeat
segmentation and feature extraction.
Commonly, heartbeat segmentation is performed by first
locating the R complex. Next, the R position is estimated for
the following heartbeats [43, 44]. Our R peak locator used a
simple technique of looking at the maximum variance over
a 0.2 second interval. The 0.2-seconds represent ventricular
depolarization. The metric was computed in overlapping
windows to insure that the true R peakswererecovered
[4]. The remainder of the heartbeat was realized by locating
the P and the T peaks relative to the R position. For
the enrollment data, we used autocorrelation techniques
to develop an initial estimate of the R-R interval. In the
autocorrelation function, the lag for the maximum peak
generally corresponds to the mean length of the heartbeat,
giving an initial value to guide the heartbeat segmenta-
tion.
ECG data are commonly collected by contact sensors at
multiple positions around the heart. The change in ECG
electrode position provides different information because of
the relative position to the heart’s plane of zero potential.
For nearly all individuals and all electrode locations, the
ECG trace of a heartbeat produces three complexes (wave
forms). The medical community has defined the complexes
by their peaks: P, R,andT (Figure 7). The R-
R interval,
the time between two successive R peaks, indicates the
duration of a heartbeat. Two other fiducials, Q and S,are
also identified at the base of the R complex. Israel et al.
[4] identified four additional fiducials at the base of the
P and T complexes. These are noted with a prime (
)
symbol (Figure 7). We employ the single channel feature
extraction method developed by Israel et al. [4]. The nine
features derived from the fiducials are the feature vector
used to illustrate the sequential procedure and the minimum
number of heartbeats metric.
4. The Sequential Procedure
Abraham Wald developed the sequential procedure for for-
mal statistical testing of hypotheses in situations where data
can be collected incrementally [45, 46]. In many instances,
the sequential method arrives at a decision based on relatively
EURASIP Journal on Advances in Signal Processing 5
0 100 200 300 400 500 600 700 800 900 1000
Frequency
0
2
4
6
8
10
×10
4
Squared electrical potential
1.1Hz
0.06 Hz
60 Hz
(a)
100 200 300 400 500 600 700 800 900 1000
Frequency
0
1
2
3
4
5
6
7
8
9
10
×10
4
Squared electrical potential
(b)
Figure 5: Power spectra of frequency filtering: (a) bandpass filter of raw data (b) frequency response of filtered data. (a) shows the noise
source spikes at 0.06 and 60 Hz and the information spikes between 1.10 and 35 Hz. (b) shows the filtered data with the noise spikes removed
and the subject specific information sources retained. The X-axis is frequency in Hz, and the Y-axis is squared electrical potential.
02468101214161820
Time (seconds)
−60
−40
−20
0
20
40
60
80
100
Relative electrical potential
(a)
88.59 9.510
Time (seconds)
−40
−20
0
20
40
60
80
Relative electrical potential
(b)
Figure 6: Bandpass filtered ECG trace (a) entire range of data (b) segment of data. The results of applying the filter (Figure 5) to the raw
(Figure 4)dataareshown.
few observations. Consider a sequence of independent and
identically distributed random variables
{X
1
, X
2
, } and
suppose we wish to test the hypothesis H0: X
i
∼ f (X, θ
0
)
against the alternative H1: X
i
∼ f (X, θ
1
). The general
approach is to construct the sequential probability ratio
statistic for the first T observations:
S
(
T
)
=
P
[
X
1
, , X
T
| H
1
]
P
[
X
1
, , X
T
| H
0
]
=
T
t
=1
f
(
X
t
, θ
1
)
T
t=1
f
(
X
t
, θ
0
)
. (1)
At each step in the sequential procedure, that is, for each
value of T
= 1, 2, , the computed value of S(T)is
compared to the decision thresholds A and B, where 0 <A<
1 <B<
∞.ThevaluesofA and B depend on the acceptable
level of error in the test of hypothesis. The decision procedure
is
If S
(
T
)
<A,accept H0,
If S
(
T
)
>B,acceptH1,
If A<S
(
T
)
<B, continue sampling,
(2)
S(T) is known as the sequential probability ratio statistic. It is
often convenient to formulate the procedure in terms of the
log of the test statistic:
S
∗
(
T
)
= log
[
S
(
T
)
]
=
T
t=1
log
f
(
X
t
, θ
1
)
−
T
t=1
log
f
(
X
t
, θ
0
)
.
(3)
6 EURASIP Journal on Advances in Signal Processing
P
Q
R
S
Q-T
interval
P-Q
interval
S-T
segment
Ventricular
depolarization
Ventricular
repolarization
Atrial
depolarization
T
Time
Relative electrical potential
S’
P’
L’
T’
Figure 7: Fiducial features in the heartbeat.
To develop the sequential procedure for our application, we
treat identity verification as a test of hypotheses. The two
hypotheses are
H0 : The subject is who
(
s
)
he says
H1 : The subject is not who
(
s
)
he says.
(4)
The data for testing the hypotheses is the series of observed
heartbeats presented in the test data. From each test heart-
beat the fiducial features are extracted, forming a feature
vector. Denote these feature vectors from each heartbeat
by
{H(1), H(2), }. If the person says (s)he is subject i,
then
{H(t):t = 1, , T} are drawn from the statistical
distribution corresponding to subject i. If (s)he is not who
(s)he claims to be, then
{H(t):t = 1, , T} are drawn from
a population with a statistical distribution corresponding to
subject j,wherei
/
= j. To simplify the procedure, we assume
that the feature vectors
{H(t)} are independent with a K-
variate Gaussian distribution, where K is the number of
features extracted from each heartbeat. The mean vectors
and covariance matrices are estimated from the enrollment
data. Using this model for the test data, the hypotheses are
restated in statistical terms:
H0: H
(
t
)
∼ N
(
Y
i
, Σ
)
for {H
(
t
)
: t = 1, , T},
H1:H
(
t
)
∼ N
Y
j
, Σ
where i
/
= j for {H
(
t
)
: t = 1, , T},
(5)
where Y
i
is the mean feature vector for subject i,andY
j
is
the mean feature vector for subject j.Thecovariancematrix
Σ is assumed to be the same across subjects. Implicit in this
formulation is the assumption that the Y
i
/
= Y
j
, whenever
i
/
= j, which is a necessary condition for ECG to provide a
unique biometric signature. The distance between Y
i
and
Y
j
sets the trade space for selecting ECG attributes and
verification algorithms, as it affects the required number
of heartbeats needed for making a decision whether the
individual is an authentic user or an intruder.
To test the hypotheses H0andH1, we calculate the log of
the likelihood ratio statistic for whether the first T heartbeats
for subject i come from the jth subject. In the classical
Neyman-Pearson formulation of hypothesis testing, T would
be fixed [47]. In the sequential procedure, we calculate the
test statistic for values of T until a decision is reached. Note
that the verification methods depend on the Mahalanobis
distance, and Y is composed the 9-attribute feature vector.
The test statistic as a function of T, the number of heartbeats
is:
S
∗
(
T
)
=
T
t=1
log
f
1
(
H
(
t
))
− log
f
0
(
H
(
t
))
,(6)
where
f
0
(
H
(
t
))
=
[
2π
]
−K/2
|Σ|
−1/2
× exp
−
1
2
(
H
(
t
)
− Y
i
)
T
Σ
−1
(
H
(
t
)
− Y
i
)
,
f
1
(
H
(
t
))
=
[
2π
]
−K/2
|Σ|
−1/2
× exp
−
1
2
H
(
t
)
− Y
j
T
Σ
−1
H
(
t
)
− Y
j
,
(7)
where K
= 9 is the dimensionality of the vectors, and
Y
j
is the mean for the alternative hypothesis. In principle,
we would calculate the statistic S
∗
(T)foreachvalueofT,
starting at T
= 1. For ECG analysis, at least two heartbeats
are required. The features are the distances between fiducial
points, normalized by the length of the heartbeat. This
normalization insures that the verification procedure is
tolerant to changes in overall heartrate attributable to
varying physical, mental, or emotional state.
Computing S
∗
(T) requires calculating (7)foreach
heartbeat, multiplying, and taking logs to compute the value
defined in (6). Computationally, this can be simplified. The
term [2π]
−k/2
|Σ|
−1/2
is a constant that gets added and
subtracted, so it can be ignored. The test procedure simplifies
to calculate the quadratic forms (8)and(9):
f
0
(
H
(
t
))
∝−
1
2
(
H
(
t
)
− Y
i
)
T
Σ
−1
(
H
(
t
)
− Y
i
)
,
f
1
(
H
(
t
))
∝−
1
2
H
(
t
)
− Y
j
T
Σ
−1
H
(
t
)
− Y
j
.
(8)
Sum up values to compute S
∗
(T)foreachvalueofT, that is,
S
(
T
)
=
T
t=1
log
f
1
(
H
(
t
))
−
log
f
0
(
H
(
t
))
. (9)
The result of all this is a series of values for S
∗
(T)for
T
= 1, 2, 3, Because the feature vector H(t) depends on
the estimated R-R interval, a minimum of two heartbeats
is needed. Thus, in practice, the “0th” heartbeat must be
acquired, and S
∗
(1)iscomputedfromthe0thand1st
heartbeats and S
∗
(T)forT ≥ 2arecomputedsequentially
as each heartbeat is added to the sample.
EURASIP Journal on Advances in Signal Processing 7
Comparing S
∗
(T) to the critical values determines which
hypothesis to accept. We define the errors α and β as follows:
α
= Pr
Rejecting H0 | H0istrue
=
Pr
S
∗
(
T
)
> log
(
B
)
,
β
= Pr
Rejecting H1 | H1istrue
=
Pr
S
∗
(
T
)
< log
(
A
)
.
(10)
For a test of simple hypothesis, it has been shown [46] that
(11)
log
(
A
)
= log
β
1 − α
,
log
(
B
)
= log
1 − β
α
.
(11)
To illustrate the application of the sequential procedure to
the ECG signal, consider the example shown in Figure 8.
Suppose the person presenting his/her credentials claims to
be person i. Then the enrollment data for the ith subject
gives the estimated mean Y
i
under H0. If the true identity
is j,wherej
/
= i, then one could use Y
j
for the mean
value under H1. We consider 5 cases in which H0 is false
and the data come from five different individuals, labeled
1–5 in Figure 8(a). In all cases, the test statistic quickly
exceeds the decision threshold log(B)forα
= β = 0.01.
Comparing the behavior of the test statistics (Figure 8(a))to
the distance between the mean vector for the true identity
and the mean vector for the declared identity (Figure 8(b))
reveals a direct correspondence. Note that these distances
are computed from the training/enrollment data, while the
test statistic depends on the enrolled means and the actual
heartbeats observed in the test data. As one might expect, a
large difference between the enrolled means for the true and
declared identities corresponds to a large value of S
∗
(T)and
a rapid acceptance of H1. When the true mean is close to the
mean of the declared identity, S
∗
(T) increases more slowly.
This leads to the final step in the formulation of the
sequential procedure, namely, the selection of i and j for
constructing the test statistic. The choice of i is clear—it
always corresponds to the declared identity of the individual
presenting the credentials. To select j, we use the “closest
imposter,” that is, the enrolled individual with credentials
closest to the declared individual. In other words, we select
j such that as
Y
i
− Y
j
=
min{k k
/
= i : Y
i
− Y
k
}, (12)
where
Y
i
− Y
j
is distance defined by
Y
i
− Y
j
=
Y
i
− Y
j
T
Σ
−1
Y
i
− Y
j
, (13)
and Σ is the pooled covariance matrix. When H0istrue,we
use the nearest imposter to calculate the test statistic shown
in Figure 8. The procedure determines that the S
∗
(T)falls
below the decision boundary, and H0 is accepted.
5. Results
We present performance results for two data sets. The first
data set, consisting of 29 subjects, was acquired under a strict
protocol documented previously [1–4]. The second data set
merges recordings from two data acquisitions discussed by
Israel et al. [6]. Both datasets are single channel collections.
Together, these data sets suggest the performance that can
be expected for a moderate size population. In practice,
however, a range of issues require further investigation: the
effects of varying mental and emotional states on the ECG
signal, the sensor placement and efficient data acquisition,
generalization to larger populations, and the long-term
stability of the ECG credentials. These issues are explored in
the next section.
5.1. First Data Set. The ECG data analyzed in the work of
Israel et al. [4] and Irvine et al. [5] provides a target perfor-
mance for the sequential procedure. For this experiment, the
single channel ECG data were collected at the base of the neck
at a sampling rate of 1000 Hz with an 11-bit dynamic range.
The population consisted of 29 males and females between
the ages of 18 and 48, with no known cardiac anomalies.
During each session, the subject’s ECG was recorded while
performing seven 2-minute tasks. The tasks were designed to
elicit varying stress levels and to understand stress/recovery
cycles. The results shown here used data from the subject’s
low stress tasks. The next section presents results for one of
the high-stress tasks.
Setting the decision threshold based on α
= β = 0.01,
all 29 subjects were analyzed using the sequential procedure.
When H0 is true, that is, the test data comes from the subject
who is declared to be subject i, the results show that H0is
accepted in all cases (Figure 9). We stopped processing at 15
heartbeats. In all cases, the decision was reached within that
time span, and usually much sooner.
Similarly, when H1 is true, the correct decision is
generally reached in fewer than 15 heartbeats (Figure 10). In
this set of results, the true identity for the test data is, in fact,
the closest imposter. In only one case did the test procedure
fail to reject an imposter within 15 heartbeats. In addition,
we have computed the sequential tests when data for other
subjects are used for the test set and the correct decision
is always made in fewer heartbeats. Essentially, Figure 10
represents a worst case in which the subject trying to pose
as someone else has a heartbeat that is fairly similar to the
declared identity.
The sequential procedure performs well for the test data.
An important practical issue is the number of heartbeats
required to reach a decision. Figure 11 depicts the number
of heartbeats required for a decision when H0istrue
(Figure 11, left side) and when H1istrue(Figure 11,right
side). In both cases, most of the individuals were identified
using only 2 or 3 heartbeats. In cases where there is some
ambiguity, however, additional heartbeats are needed to
resolve the differences.
Thenumberofheartbeatsneededtoreachadecision
depends on the level of acceptable error. The results pre-
sented in Figures 9, 10 and 11 assume α
= β = 0.01.
8 EURASIP Journal on Advances in Signal Processing
1
2
3
4
5
H1 is true
H0 is true
Accept H1
Accept H0
0123456
Number of heartbeats
−20
−10
0
10
20
30
40
50
60
Test statistic
(a)
12345
Alternative subject number
0
0.05
0.1
0.15
0.2
0.25
0.3
Distance from true subject
(b)
Figure 8: Example of a sequential procedure. (a) Sequential test statistic for a single declared identity when H0istrueandforfiveimposters.
(b) The distance of the declared identity to the five imposters.
Upper decision
threshold
Lower decision
threshold
1 2 3 4 5 6 7 8 9 10 11 12 13 14 15
Number of heartbeats
−40
−35
−30
−25
−20
−15
−10
−5
0
5
10
Va lu e o f t est st at i st i c
Figure 9: Sequential test statistics for all subjects when H0istrue.
The test data are from the declared individual.
Upper decision
threshold
Lower
decision threshold
123456789101112131415
Number of heartbeats
−10
−5
0
5
10
15
20
25
30
35
40
Va lu e o f t est st at i st i c
Figure 10: Sequential test statistics for all subjects when H1istrue.
The test data are from the subject closest to the declared individual,
that is, the nearest imposter.
An inverse relationship exists between acceptable error
rate and required number of heartbeats. Smaller levels of
acceptable error will drive the decision process to require
more data. Tab le 1 summarizes the performance for α
=
β ranging from 0.1 to 0.0001. More stringent constraints
on α and β,forexample,α
= β = 0.001or α =
β = 0.0001, generally require more heartbeats. As the
acceptable error reduces, a decision is not always realized
within 15 heartbeats. For the case of α
= β = 0.0001,
the procedure was run until a decision was reached for
all subjects. When H0 is true, the maximum number of
heartbeats needed was 33. When H1 was true, the maximum
was 37 heartbeats. In all cases, the correct decision was
reached.
5.2. Second Data Set. Two additional ECG data collection
campaigns used a simplified protocol and a standard, FDA
approved ECG device. The clinical instrument recorded the
ECG data at 256 Hz and quantized it to 7 bits. These data
were acquired from two studies: one which collected single
channel data from 28 subjects with the sensor placement at
the wrist and one which collected single lead data from 47
subjects using a wearable sensor. The result is an additional
75 subjects.
The analysis followed the same procedure as with the
first data set. Application of the sequential procedure for all
75 subjects was performed under both H0andH1. Table 2
summarizes the results for the two cases α
= β = 0.05 and
α
= β = 0.01, where the procedure ran for a maximum of 24
heartbeats. The results show that in a few instances a decision
is not reached within the 24 heartbeats. For α
= β = 0.05,
when H0 is true the procedure fails to decide for 2 subjects
and 2 additional subjects are classified incorrectly. When
H1istrue,theprocedurefailedtodecidefor1subjectand
decided incorrectly for 1 subject.
A comparison of the results from the two data sets
shows good consistency. A statistical comparison reveals no
significant difference. Consider, for example, performance
when α
= β = 0.05. Under H0, a statistical comparison
of the correct acceptance rates yields a t-statistic of 1.39.
The corresponding t-statistic under H1 is 0.58. In short,
performance for the two experiments is statistically indistin-
guishable.
EURASIP Journal on Advances in Signal Processing 9
2 3 4 5 6 7 8 9 10 11 12
Number of heartbeats
0
2
4
6
8
10
12
14
Number of subjects
H0istrue
(a)
0 5 10 15
Number of heartbeats
0
1
2
3
4
5
6
7
8
9
Number of subjects
H1istrue
(b)
Figure 11: Histograms showing the number of heartbeats needed to reach a decision where the acceptable level of error is α = β = 0.01.
Table 1: Summary statistics for the number of heartbeats needed to reach a decision for varying levels of the acceptable error.
H0istrue H1istrue
Allowable
error (α, β)
Mean no.
of
heartbeats
Minimum
no. of
heartbeats
Maximum
no. of
heartbeats
Percent
resulting
in decision
Allowable
error (α, β)
Mean no.
of
heartbeats
Minimum
no. of
heartbeats
Maximum
no. of
heartbeats
Percent
resulting
in decision
0.1 3.38 2 8 100 0.1 3.655 2 11 100
0.05 4.24 2 9 100 0.05 4.621 2 14 100
0.01 6.07 2 15 100 0.01 6.500 2 15 96.6
0.005 6.68 3 14 96.6 0.005 7.000 2 14 93.1
0.001 7.28 3 13 86.2 0.001 7.792 3 15 82.8
0.0005 7.96 4 15 86.2 0.0005 8.174 3 15 79.3
0.0001 7.55 4 15 69.0 0.0001 7.647 4 14 58.6
6. Issues and Concerns
The results presented in the previous section, while promis-
ing, were obtained from modest data sets collected under
controlled conditions. To be operationally viable, a system
must address performance across a range of conditions. Key
issues to consider are
(i) heartrate variability, including changes in mental and
emotional states,
(ii) sensor placement and data collection,
(iii) scalability to larger populations,
(iv) long-term viability of the ECG credentials.
Heartrate Variability. Heartrate, of course, varies with a
person’s mental or emotional state. Excitement or arousal
from any number of stimuli can elevate the heartrate.
Under the experimental protocol employed to collect the
first data set, subjects performed a series of tasks designed
to elicit varying mental and emotional states [1–4]. The
subjects exhibited changes in heartrate associated with these
1 101 201 301 401 501 601 701
Time (mseconds)
−40
0
40
80
120
160
Relative electrical potential
6 heartbeats from baseline
6 heartbeats from high stress task (rescaled in time)
Figure 12: Aligned heartbeats from high stress and low stress tasks.
tasks. The fiducial features, however, show relatively small
differences due to the variation in heartrate. To illustrate,
consider Figure 12. For a single subject, Figure 12 presents
6 heartbeats from the baseline task in which the subject is
10 EURASIP Journal on Advances in Signal Processing
Table 2: Analysis of second data set.
(a) Heartbeats required to reach a decision
H0istrue H1istrue
Allowable
error (α, β)
Mean no.
of
heartbeats
Minimum
no. of
heartbeats
Maximum
no. of
heartbeats
Percent
resulting
in decision
Allowable
error (α, β)
Mean no.
of
heartbeats
Minimum
no. of
heartbeats
Maximum
no. of
heartbeats
Percent
resulting
in decision
0.05 3.04 2 22 97.3 0.05 3.10 2 22 98.7
0.01 4.93 2 24 92.0 0.01 4.99 2 24 92.0
(b) Correct decision rates
H0istrue H1istrue
Allowable error
(α, β)
Percent resulting in
correct decision
Allowable error
(α, β)
Percent resulting in
correct decision
0.05 94.7 0.05 97.3
0.01 89.3 0.01 90.7
rp rs rp’ rs’ twidth st pq pt rwidth
0
0.2
0.4
0.6
0.8
1
1.2
1.4
1.6
1.8
Mean square error
Subject
Ta sk
Figure 13: Comparison of variance attributable to subject and task.
seated at rest. In addition, 6 heartbeats from a high stress
task (a virtual reality driving simulation) were temporally
rescaled and overlaid on the same graph. For this particular
subject, the mean R-R interval for the baseline task was 0.715
seconds and for the high stress task it was 0.580 seconds.
However, by a linear rescaling, the high-stress heartbeats
align well with the baseline heartbeats. A difference in the
height of the T wave is evident but the fiducial features
depend on the relative positions of the peaks, not the
heights.
Delving deeper than the visual evidence for a single
subject, we conducted a systematic analysis of the sources
of variance in the fiducial features using a multivariate
analysis of variance (MANOVA). The 29 subjects performed
all seven tasks in the experimental protocol eliciting a
range of stimulation. The MANOVA shows that there
are small, but statistically significant, differences in the
fiducials across the various tasks, indicating that there
are subtle differences in the ECG signal that are more
complex than a linear rescaling. This source of variance,
however, is typically one or two orders of magnitude
smaller than the variance across subjects. Figure 13 shows
the relationships between the two mean square errors for
each fiducial, and the variation across subjects is far more
pronounced than the variation due to task. This relationship
is why the fiducial-based features are likely to provide good
information about a subject’s identity across a range of
conditions.
To verify this hypothesis, we explored the effect of varying
the level of arousal of the subject. The protocol used for
collecting Dataset 1 included a set of tasks designed to
elicit varying levels of stimulation or arousal [1–4]. Using
the baseline, low stress task for training, we processed data
from one of the high-stress tasks for testing. Specifically,
the subjects performed an arithmetic task designed to affect
both stress and cognitive loads. The effectiveness of the task
is evident in that the mean R-R interval decreased from
a baseline of 0.83 to 0.76 for this task. Nevertheless, the
sequential procedure yielded good performance on these
data (Ta bl e 3 ).
If alternative attributes are evaluated in the trade space,
such as wavelets [35] or Legendre coefficients [48], then their
sensitivity must also be evaluated in the same manner as
above. Likewise, incorporating other verification algorithms
such as PCA [5, 49] or Gaussian modeling [50]will
require substituting their characteristics into the sequential
process. Regardless, the minimum number of heartbeats is
appropriate for comparing systems.
Sensor Placement. Dataset 1 collected ECG traces from the
base of the neck. Dataset 2 collected ECG traces on the
forearms. Both collections used medical quality single use
electrodes. However, any operational system must design
a more robust collection method. This method must have
reusable electrodes, a concept of employment for locating
electrodes on normally exposed skin, and other human
factors. These issues are outside the scope of this paper.
However, the concept of employment does raise significant
concerns about the noise floor for an operational system. As
the noise floor increases the separability between the subject
and the nearest imposter reduces.
EURASIP Journal on Advances in Signal Processing 11
Table 3: Effects of varying levels of stimulation.
H0istrue H1istrue
Allowable
error (α, β)
Mean no.
of
heartbeats
Minimum
no. of
heartbeats
Maximum
no. of
heartbeats
Percent
correct
decision
Allowable
error (α, β)
Mean no.
of
heartbeats
Minimum
no. of
heartbeats
Maximum
no. of
heartbeats
Percent
correct
decision
0.01 5.57 2 17 96.6 0.01 4.41 2 10 93.1
Scalability. Depending on the application, an ECG-based
identity verification system may need to store credentials for
hundreds or thousands of individuals. The recent experi-
ments lack the sample sizes needed to determine large-scale
performance, and the next step is to assess performance over
much larger data sets. Because our approach compares the
credentials for the declared subject to the nearest imposter,
the separability among members of the training set is
critical. By always choosing j to be the closest imposter, we
guard against accepting a person’s credentials too readily.
Fortunately, determining the closest imposter is performed
using training data, offline, which greatly improves the
processing efficiency and system usability. It does, however,
raise a concern about extending these methods to appli-
cations involving large enrolled populations. An alternative
approach is to select j based on the features extracted from
the first heartbeat. One could select j to be the member of the
enrollment set closest to the first heartbeat from the test data,
where j
/
= i. In terms of the statistical formulation, H1isno
longer a simple hypothesis, since j is chosen to minimize a
criterion over the full enrollment set. A simple experiment
on a subset of the data revealed mean decision times of
approximately 8 heartbeats for α
= β = 0.01, compared to
6.5 using the nearest imposter. Further investigation of this
issue is still needed.
Long-Term Viability. Characteristics of an individual’s ECG
can change for a variety of medical reasons, including car-
diovascular disease and changes in medication. Research has
examined these issues from a clinical perspective, but further
investigation is needed to understand how these factors affect
ECG as a biometric for identification. For the data analyzed
in this paper, the time difference between the training and
test sets ranged from minutes to months, but no truly long-
term differences have been studied. Such a study needs to be
conducted, and existing clinical measurements are likely to
be the most readily available source of data. Depending on
the concept of employment, however, periodic re-enrollment
may be one strategy for addressing long-term changes in an
individual’s ECG signal.
7. Discussion
This research builds on previous investigations into the
viability of ECG as a biometric for human identification.
We focus specifically on a procedure for exploiting the ECG
signal for identity verification, with the optimization metric
being the number of heartbeats needed for the system to
make a decision. By using a method based on a sequential
procedure for statistical hypothesis testing, data acquisition
time is minimized. For the two data sets analyzed here, the
approach generally yields the correct decision given enough
heartbeats.
For modest levels of acceptable risk (α
= β = 0.01 or
0.05), the decision is often made after only 3 or 4 heartbeats
and is almost always made within 15 heartbeats. In practice,
this implies a data acquisition time of approximately 5 to 15
seconds. Lower risk tolerance (e.g., α
= β = 0.0001) could
require 30 seconds or more to reach a decision for some
individuals.
Whether the data acquisition time is acceptable in
practice will depend, of course, on the specific application.
One attractive approach is to use ECG in conjunction with
other biometrics, such as fingerprint and hand geometry.
This multimodality approach could support less demanding
performance limits for the ECG (e.g., α
= β = 0.01), while
providing a high level of security that will be very difficult to
forge or circumvent.
Further investigations are still needed to refine and
validate the methods presented here. Specific avenues for
future research include the following.
(i) Assessment of performance over a much larger
population of test subjects: larger data sets, including
data collected at greater time intervals, are necessary
to characterize the behavior of these methods.
(ii) Investigation of robustness to physical, mental, and
emotional states and longer baselines between visits:
heartrate will vary with a variety of stimuli. Irvine
et al. [3]andIsraeletal.[4] demonstrated that with
proper normalization, the fiducial-based features
are robust to mental and emotional states. Further
validation that similar results hold for the sequential
procedures would be useful.
(iii) Exploration of alternative feature extraction meth-
ods and verification algorithms: researchers have
proposed a variety of alternative feature extrac-
tion methods, including variations on the fiducial
features, principal component analysis, template
matching, and frequency-domain approaches. These
methods can be integrated into the sequential pro-
cedure framework, and a comparison of different
approaches could prove enlightening.
Acknowledgments
This research was sponsored by the Defense Advanced
Research Projects Agency (DARPA) under Contract no.
DABT63-00-C-1039, with additional support from Charles
Stark Draper Laboratory and SAIC. The data were collected
12 EURASIP Journal on Advances in Signal Processing
at the Virtual Reality Medical Center under the supervision
of Drs. Mark and Brenda Wiederhold. Additional assistance
was provided by Dr. Rodney Meyer, Dr. Lauren Gavshon, Ms.
Shannon McGee, and Ms. Elizabeth Rosenfeld. The authors
also wish to thank Dr. P. Jonathon Phillips, formerly of
DARPA, for valuable comments concerning the development
of this work. Finally, the authors wish to thank the anony-
mous reviewers for valuable insights and suggestions. The
views expressed here are those of the authors and do not
necessarily represent the positions of DARPA, SAIC, Draper
Laboratory, or VRMC.
References
[1] J.M.Irvine,B.K.Wiederhold,L.W.Gavshon,etal.,“Heart
rate variability: a new biometric for human identification,”
in Proceedings of the International Conference on Artificial
Intelligence (IC-AI ’01), pp. 1106–1111, Las Vegas, Nev, USA,
June 2001.
[2]J.M.Irvine,S.A.Israel,A.Cheng,M.D.Wiederhold,B.K.
Wiederhold, and S. McGehee, “Validation of new biometrics
for human identification,” in Proceedings of the Joint Statistical
Meetings (JSM ’02), New York, NY, USA, August 2002.
[3]J.M.Irvine,S.A.Israel,M.D.Wiederhold,andB.K.
Wiederhold, “A new biometric: human identification from
circulatory function,” in Proceedings of the Joint Statistical
Meetings of the American Statistical Association, pp. 1–7, San
Francisco, Calif, USA, August 2003.
[4]S.A.Israel,J.M.Irvine,A.Cheng,M.D.Wiederhold,and
B. K. Wiederhold, “ECG to identify individuals,” Pattern
Recognition, vol. 38, no. 1, pp. 133–142, 2005.
[5]J.M.Irvine,S.A.Israel,W.ToddScruggs,andW.J.Worek,
“eigenPulse: robust human identification from cardiovascular
function,” Pattern Recognition, vol. 41, no. 11, pp. 3427–3435,
2008.
[6]S.A.Israel,J.M.Irvine,B.K.Wiederhold,andM.D.
Wiederhold, “The heartbeat: the living biometric,” in Biomet-
rics: Theory, Methods, and Applications,N.V.Boulgouris,E.
Micheli-Tzanakou, and K. N. Plataniotis, Eds., Wiley-IEEE
Press, New York, NY, USA, 2009.
[7] M.D.Wiederhold,S.A.Israel,R.P.Meyer,andJ.M.Irvine,
Human Identification by Analysis of Physiometric Variation,
SAIC, San Diego, Calif, USA, 2006.
[8] L. Biel, O. Pettersson, L. Philipson, and P.Wide, “ECG analysis:
a new approach in human identification,” IEEE Transactions
on Instrumentation and Measurement, vol. 50, no. 3, pp. 808–
812, 2001.
[9] Y. Wang, F. Agrafioti, D. Hatzinakos, and K. Plataniotis, “Anal-
ysis of human electrocardiogram for biometric recognition,”
EURASIP Journal on Advances in Signal Processing, vol. 2008,
Article ID 148658, 11 pages, 2008.
[10] T. W. Shen, W. J. Tompkins, and Y. H. Hu, “One-lead ECG for
identity verification,” in Proceedings of the 2nd Joint Conference
of the IEEE Engineering in Medicine and Biology Society and
the 24th Annual Conference and the Annual Fall Meeting of the
Biomedical Engineering Society (EMBS/BMES ’02), vol. 1, pp.
62–63, Houston, Tex, USA, October 2002.
[11]F.R.Yu,H.Tang,V.C.M.Leung,J.Liu,andC H.
Lung, “Biometric-based user authentication in mobile ad hoc
networks,” Security and Communication Networks, vol. 1, no.
1, pp. 5–16, 2008.
[12] R. Palaniappan and S. M. Krishnan, “Identifying individuals
using ECG beats,” in Proceedings of the International Confer-
ence on Signal Processing and Communications (SPCOM ’04),
pp. 569–572, Bangalore, India, December 2004.
[13] M. Kyoso and A. Uchiyama, “Development of an ECG identifi-
cation system,” in Proceedings of the 23rd Annual International
Conference of the IEEE Eng ineering in Medicine and Biology
Society (EMBS ’01), vol. 4, pp. 3721–3723, Istanbul, Turkey,
October 2001.
[14] G. Wubbeler, M. Stavridis, D. Kreiseler, R D. Bousseljot, and
C. Elster, “Verification of humans using the electrocardio-
gram,” Pattern Recognition Letters, vol. 28, no. 10, pp. 1172–
1175, 2007.
[15] G. D. Clifford, F. Azuaje, and P. E. McSharry, Ad vanced
Methods and Tools for ECG Data Analysis,ArtechHouse,
Norwood, Mass, USA, 2006.
[16] H. C. Bazett, “An analysis of time relations of electrocardio-
grams,” Heart, vol. 7, pp. 353–370, 1920.
[17] D. P. Golden Jr., R. A. Wolthuis, and G. W. Hoffler, “A
spectral analysis of the normal resting electrocardiogram,”
IEEE Transactions on Biomedical Engineering,vol.20,no.5,pp.
366–372, 1973.
[18] D. Hawkins, “Body of evidence,” U. S. News & World Report,
vol. 132, no. 5, pp. 60–62, 2002.
[19] M. P. S. Chawla, H. K. Verma, and V. Kumar, “A new
statistical PCA-ICA algorithm for location of R-peaks in ECG,”
International Journal of Cardiology, vol. 129, no. 1, pp. 146–
148, 2008.
[20] P. de Chazal, C. Heneghan, E. Sheridan, R. Reilly, P. Nolan,
and M. O’Malley, “Automated processing of the single-
lead electrocardiogram for the detection of obstructive sleep
apnoea,” IEEE Transactions on Biomedical Engineering, vol. 50,
no. 6, pp. 686–696, 2003.
[21] M. Kotas, “Robust projective filtering of time-warped ECG
beats,” Computer Methods and Programs in Biomedicine, vol.
92, no. 2, pp. 161–172, 2008.
[22] K. Noponen, J. Kortelainen, and T. Sepp
¨
anen, “Invariant
trajectory classification of dynamical systems with a case study
on ECG,” Pattern Recognition, vol. 42, no. 9, pp. 1832–1844,
2009.
[23] R. Nygaard, G. Melnikov, and A. K. Katsaggelos, “A rate
distortion optimal ECG coding algorithm,” IEEE Transactions
on Biomedical Engineering, vol. 48, no. 1, pp. 28–40, 2001.
[24] N. C. Oza and K. Tumer, “Classifier ensembles: select real-
world applications,” Information Fusion, vol. 9, no. 1, pp. 4–20,
2008.
[25] R. Palaniappan and K. V. R. Ravi, “Improving visual evoked
potential feature classification for person recognition using
PCA and normalization,” Pattern Recognition Letters, vol. 27,
no. 7, pp. 726–733, 2006.
[26] K. N. Plataniotis, D. Hatzinakos, and J. K. M. Lee, “ECG bio-
metric recognition without fiducial detection,” in Proceedings
of the Biometric Consortium Conference (BCC ’06), pp. 1–6,
Baltimore, Md, USA, September 2006.
[27] A. van Oosterom, R. Hoekema, and G. J. H. Uijen, “Geometri-
cal factors affecting the interindividual variability of the ECG
and the VCG,” Journal of Electrocardiology,vol.33,no.3,pp.
219–227, 2000.
[28] M. Turk and A. Pentland, “Eigenfaces for recognition,” Journal
of Cognitive Neuroscience, vol. 3, no. 1, pp. 71–86, 1991.
[29] F. M. Bui, F. Agrafioti, and D. Hatzinakos, “Electrocardiogram
biometric,” in Biometrics: Theory, Methods, and Applications,
N. V. Boulgouris, E. Micheli-Tzanakou, and K. N. Plataniotis,
Eds., Wiley-IEEE Press, New York, NY, USA, 2009.
EURASIP Journal on Advances in Signal Processing 13
[30] F. Agrafioti and D. Hatzinakos, “ECG biometric analysis
in cardiac irregularity conditions,” Signal, Image and Video
Processing, pp. 1683–1703, 2008.
[31] D. Dubin, Rapid Interpretation of ECGs,Cover,Tampa,Fla,
USA, 6th edition, 2000.
[32] E. N. Marieb, Essential of Human Anatomy and Physiology,
Benjamin Cummings, San Francisco, Calif, USA, 7th edition,
2003.
[33] T. Pawar, N. S. Anantakrishnan, S. Chaudhuri, and S. P. Dut-
tagupta, “Transition detection in body movement activities for
wearable ECG,” IEEE Transactions on Biomedical Engineering,
vol. 54, no. 6, pp. 1149–1152, 2007.
[34] R. Jane, H. Rix, P. Caminal, and P. Laguna, “Alignment
methods for averaging of high-resolution cardiac signals: a
comparative study of performance,” IEEE Transactions on
Biomedical Engineering, vol. 38, no. 6, pp. 571–579, 1991.
[35] P. Laguna, R. Jane, O. Meste, et al., “Adaptive filter for event-
related bioelectric signals using an impulse correlated ref-
erence input: comparison with signal averaging techniques,”
IEEE Transactions on Biomedical Engineering, vol. 39, no. 10,
pp. 1032–1044, 1992.
[36] M. Alfaouri and K. Daqrouq, “ECG signal denoising by
wavelet transform thresholding,” American Journal of Applied
Sciences, vol. 5, no. 3, pp. 276–281, 2008.
[37] W. Zhang, X. Wang, L. Ge, and Z. Zhang, “Noise reduction
in ECG signal based on adaptive wavelet transform,” in
Proceedings of the 27th Annual International Conference of the
IEEE Engineering in Medicine and Biology Society (EMBS ’05),
pp. 2699–2702, Shanghai, China, January 2005.
[38] V. Almenar and A. Albiol, “A new adaptive scheme for ECG
enhancement,” Signal Processing, vol. 75, no. 3, pp. 253–263,
1999.
[39] M. Elena, J. M. Quero, and I. Borrego, “An optimal technique
for ECG noise reduction in real time applications,” in Proceed-
ings of the Annual International Conference on Computers in
Cardiology (CIC ’06), vol. 33, pp. 225–228, Valencia, Spain,
September 2006.
[40] A. K. Barros, M. Yoshizawa, and Y. Yasuda, “Filtering noncor-
related noise in impedance cardiography,” IEEE Transactions
on Biomedical Engineering, vol. 42, no. 3, pp. 324–327, 1995.
[41] A. K. Barros and N. Ohnishi, “Heart instantaneous frequency
(HIF): an alternative approach to extract heart rate variability,”
IEEE Transactions on Biomedical Engineering,vol.48,no.8,pp.
850–855, 2001.
[42] P. S. Hamilton, “A comparison of adaptive and nonadaptive
filters for reduction of power line interference in the ECG,”
IEEE Transactions on Biomedical Engineering,vol.43,no.1,pp.
105–109, 1996.
[43] A. H. Al-Khalidi, M. E. Lewis, J. N. Townened, R. S. Bonser,
and J. H. Coote, “A novel and simple technique to allow
detection of the position of the R-waves from intraventricular
pressure waveforms: application to the conductance catheter
method,” IEEE Transactions on Biomedical Engineering, vol. 48,
no. 5, pp. 606–610, 2001.
[44] B U. Kohler, C. Hennig, and R. Orglmeister, “The principles
of software QRS detection,” IEEE Engineering in Medicine and
Biology Magazine, vol. 21, no. 1, pp. 42–57, 2002.
[45] M. Ghosh, Handbook of Sequential Analysis, CRC Press, Boca
Raton, Fla, USA, 1st edition, 1991.
[46] A. Wald, Sequential Analysis, Dover, New York, NY, USA, 1994.
[47] E. L. Lehmann and J. P. Romano, Testing Statistical Hypotheses,
Springer, New York, NY, USA, 3rd edition, 2008.
[48] J. Faganeli and F. Jager, “Automatic distinguishing between
ischemic and heart-rate related transient ST segment episodes
in ambulatory ECG records,” in Proceedings of the 35th
Annual International Conference on Computers in Cardiology
(CIC ’08), vol. 35, pp. 381–384, Bologna, Italy, September
2008.
[49] G. B. Moody and R. G. Mark, “QRS morphology represen-
tation and noise estimation using the Karhunen-Loeve trans-
form,” in Proceedings of the Annual International Conference
on Computers in Cardiology (CIC ’89), vol. 16, pp. 269–272,
Jerusalem, Israel, September 1989.
[50] D. Clifford, A. Shoeb, P. E. McSharry, and B. A. Janz, “Model-
based filtering, compression and classification of the ECG,”
International Journal of Bioelectromagnetism, vol. 7, no. 1, pp.
158–161, 2005.