Báo cáo hóa học: "Research Article Diversity Characterization of Optimized Two-Antenna Systems for UMTS Handsets" pot
Bạn đang xem bản rút gọn của tài liệu. Xem và tải ngay bản đầy đủ của tài liệu tại đây (2.46 MB, 9 trang )
Hindawi Publishing Corporation
EURASIP Journal on Wireless Communications and Networking
Volume 2007, Article ID 37574, 9 pages
doi:10.1155/2007/37574
Research Article
Diversity Characterization of Optimized Two-Antenna
Systems for UMTS Handsets
A. Diallo,
1
P. Le Th u c ,
1
C. Luxey,
1
R. Staraj,
1
G. Kossiavas,
1
M. Franz
´
en,
2
and P S. Kildal
3
1
Laboratoire d’Electronique, Antennes et T
´
el
´
ecommunications (LEAT), Universit
´
edeNiceSophia-Antipolis,
CNRS UMR 6071, 250 rue Albert Einstein, B
ˆ
at. 4, Les Lucioles 1, 06560 Valbonne, France
2
Bluetest AB, Gotaverksgatan 1, 41755 Gothenburg, Sweden
3
Department of Signals and Systems, Chalmers University of Technology, 41296 Gothenburg, Sweden
Received 16 November 2006; Revised 20 June 2007; Accepted 22 November 2007
Recommended by A. Alexiou
This paper presents the evaluation of the diversity performance of several two-antenna systems for UMTS terminals. All the mea-
surements are done in a reverberation chamber and in a Wheeler cap setup. First, a two-antenna system having poor isolation
between its radiators is measured. Then, the performance of this structure is compared with two optimized structures having high
isolation and high total efficiency, thanks to the implementation of a neutralization technique between the radiating elements.
The key diversity parameters of all these systems are discussed, that is, the total efficiency of the antenna, the envelope correlation
coefficient, the diversity gains, the mean effective gain (MEG), and the MEG ratio. The comparison of all these results is especially
showing the benefit brought back by the neutralization technique.
Copyright © 2007 A. Diallo et al. This is an open access article distributed under the Creative Commons Attribution License,
which permits unrestricted use, distribution, and reproduction in any medium, provided the original work is properly cited.
1. INTRODUCTION
Nowadays, wireless mobile communications are growing ex-
ponentially in several fields of telecommunications. The new
generation of mobile phones must be able to transfer large
amounts of data and consequently increasing the transfer
rate of these data is clearly needed. One solution is to imple-
ment a diversity scheme at the terminal side of the commu-
nication link. This can be done by multiplying the number
of the radiating elements of the handset. In addition, these
radiators must be highly isolated to achieve the best diver-
sity performance. Also, the antenna engineers must take into
account the radiator’s environment of the handset to design
suitable multiantenna systems. In practice, the terminal can
be considered to operate in a so-called multipath propaga-
tion environment: the electromagnetic field will take many
simultaneous paths between the transmitter and the receiver.
In such a configuration, total efficiency, diversity gain, mean
effective gain (MEG), and MEG ratio are the most important
parameters for diversity purposes.
Only few papers are actually focusing on the design of
a specific technique to address the isolation problem of sev-
eral planar inverted-F antennas (PIFAs) placed on the same
finite-sized ground plane and operating in the same fre-
quency bands. In [1, 2], the authors are evaluating the iso-
lation between identical PIFAs when moving them all along
a mobile phone PCB for multiple-input multiple-output
(MIMO) applications. The same kind of work is done in [3–
6]fordifferent antenna types. The best isolation values are
always found when the antennas are spaced by the largest
available distance on the PCB, that is, one at the top edge
and the other at the bottom. Excellent studies can be found
in [7–16], but no specific technique to isolate the elements is
described in these papers. One solution is reported in [17],
however, for two thin PIFAs for mobile phones operating in
different frequency bands (GSM900 and DCS1800). It con-
sists in inserting high-Q-value lumped LC components at the
feeding point of one antenna to achieve a blocking filter at
the resonant frequency of the other. This solution gives sig-
nificant results in terms of decoupling but strongly reduces
the frequency bandwidth. Another very interesting solution
reported in [18, 19] consists in isolating the antennas by a
decoupling network, at their feeding ports, this solution suf-
fers from the fact that in small handsets available space is re-
stricted. Finally, a promising solution is described in [20], but
in this work the PIFAs are operating around 5 GHz.
Some authors of the current paper have already designed
and fabricated several multiantenna structures for mobile
2 EURASIP Journal on Wireless Communications and Networking
PCB 100 × 40 mm
2
UMTS PIFA
Feeding strip 1
Shorting strip 1
Shorting strip 2 Feeding strip 2
z
y
x
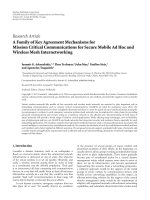
Figure 1: 3D view of the initial two-antenna system.
phone applications. In [21], the isolation problem has been
addressed for closely spaced PIFAs operating in very close
frequency bands with the help of a neutralization tech-
nique. Recently, several two-antenna systems operating in the
UMTS band (1920–2170 MHz) and especially including neu-
tralization line to achieve high isolation between the feeding
ports of their radiating parts have been designed for diversity
and MIMO applications [22]. Two prototypes have already
been characterized in terms of scattering parameters, total
efficiency, and envelope correlation coefficient. The obtained
results show that these structures have a strong potential for
an efficient implementation of a diversity scheme at the mo-
bile terminal side of a wireless link. However, to completely
characterize these prototypes, some particular facilities and
the associated expertise are needed [23]. The antenna group
of Chalmers Institute of Technology possesses these capabil-
ities through the Bluetest reverberation chamber [24].
This paper is the result of a short-term mission granted
by the COST 284. The antenna-design competencies of the
LEAT have been combined with the reverberation chamber
measurement skills of the antenna group of Chalmers Insti-
tute of Technology. Several prototypes have been measured at
Chalmers in terms of total efficiency, diversity gain, envelope
correlation coefficient, and mean effective gain. Efficiency re-
sults are compared with the same measurements obtained
through a homemade Wheeler Cap at the LEAT. The enve-
lope correlation coefficient, the MEG, and the MEG ratio cal-
culated from simulated values are also presented and com-
pared [23, 25–27]. We focus on the comparison of the per-
formance of an initial two-antenna system with two differ-
ent neutralized structures and especially the benefit brought
back by the neutralization technique.
2. DESIGNED STRUCTURES AND
S-PARAMETER MEASUREMENTS
The multiantenna systems were designed using the electro-
magnetic software tool IE3D [28]. The initial two-antenna
system is presented in Figure 1 (the design procedure was al-
ready described in [22]). It consists of two PIFAs symmetri-
cally placed on a 40
× 100 mm
2
PCB and separated by 0.12λ
0
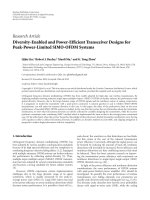
0.811.21.41.61.822.22.42.6
Frequency (GHz)
−50
−40
−30
−20
−10
0
(dB)
Simulated
Measured
S
21
S
11
/S
22
Figure 2: Simulated and measured S-parameters of the initial two-
antenna system.
PCB 100 × 40 mm
2
UMTS PIFA
Feeding strip 1
Shorting strip 1
Shorting strip 2
Feeding strip 2
z
y
x
Neutralization line
Figure 3: 3D view of the two-antenna system with a suspended line
between the PIFA shorting strips.
(18 mm at 2 GHz). They are fed by a metallic strip soldered
to an SMA connector and shorted to the PCB by an iden-
tical strip. Each PIFA is optimized to cover the UMTS band
(1920–2170 MHz) with a return loss goal of
−6dB.Theopti-
mized dimensions are of 26.5 mm length and of 8 mm width.
A prototype was fabricated using a 0.3-mm-thick nickel sil-
ver material (conductivity σ
= 4 × 10
6
S/m). In Figure 2,
we present the simulated and the measured S-parameters of
the structure. The absolute value S
21
reaches a maximum of
−5 dB in the middle of the UMTS band.
In the first attempt to improve the isolation between the
radiating elements, a suspended line as a neutralization de-
vice was inserted between the shorting strips of the two PI-
FAs (see Figure 3). The optimization of this line was already
explained in [21]. Figure 4 shows the S-parameters of this
new structure. We can see a good matching and a strong im-
provement of the isolation in the bandwidth of interest: the
measured S
21
parameter always remains below −15 dB. How-
ever, a different isolation can be obtained if we implement the
same neutralization technique between the two feeding strips
A. Diallo et al. 3
0.811.21.41.61.822.22.42.6
Frequency (GHz)
−50
−40
−30
−20
−10
0
(dB)
Simulated
Measured
S
21
S
11
/S
22
Figure 4: Simulated and measured S-parameters of the two-
antenna system with a line between the PIFA shorting strips.
PCB 100 × 40 mm
2
UMTS PIFA
Shorting strip 1
Feeding strip 1
Feeding strip 2
Shorting strip 2
z
y
x
Neutralization line
Figure 5: 3D view of the two-antenna system with a suspended line
between the PIFA feeding strips.
of the PIFAs (see Figure 5). We can observe in Figure 6 that a
deep null is now achieved in the middle of the UMTS band.
Moreover, the measured S
21
always remains below −18 dB in
the whole UMTS band. All these values seem to be very sat-
isfactory for diversity purposes.
3. COMPARISON OF THE DIVERSITY PERFORMANCE
3.1. Total efficiency
Traditionally, the radiation performance of an antenna is
measured outdoors or in an anechoic chamber. In order to
obtain the total efficiency, we need to measure the radia-
tion pattern in all directions in space and integrate the re-
ceived power density to find the total radiated power. This
gives the total efficiency when compared to the correspond-
ing radiated power of a known reference antenna. This final
result is obtained after a long measurement procedure. This
parameter can be measured very much faster and easier in
a reverberation chamber. However, it is necessary to mea-
sure a reference case (a dipole antenna having an efficiency
0.811.21.41.61.822.22.42.6
Frequency (GHz)
−50
−40
−30
−20
−10
0
(dB)
Simulated
Measured
S
21
S
11
/S
22
Figure 6: Simulated and measured S-parameters of the two-
antenna system with the line between the PIFA feeding strips.
of 96% in our case) and then the antenna system under test
(AUT). It is also important that the chamber is loaded in ex-
actly the same way for these both measurements. For the ref-
erence case, the transmission between the reference antenna
and the excitation antennas is measured in the chamber with
the reference antenna in free space that means at least half a
wavelength away from any lossy objects and/or the metallic
walls of the chamber. As soon as the reference case is com-
pleted, we can measure the AUT. From both measurements,
we can then compute P
ref
(1)andP
AUT
(2):
P
ref
=
S
21, ref
2
1 −
S
11
2
1 −
S
22, ref
2
,(1)
P
AUT
=
S
21, AUT
2
1 −
S
11
2
1 −
S
22, AUT
2
,(2)
where
S
21
is the averaged transmission power level, S
11
is the
free space reflection coefficient of the excitation antenna, and
S
22
is the free space reflection coefficient of the reference an-
tenna (or the antenna under test). The
−
denotes averaging
over n positions of the platform stirrer, polarization stirrer,
and mechanical stirrers. The total efficiency can be then cal-
culated from (3)
η
tot
=
1 −
S
22, AUT
2
P
AUT
P
ref
. (3)
Figure 7 shows the total efficiency in dB of all the antenna
systems (without the neutralization line (a), with the line
between the feeding strips (b), and with the line between
the shorting strips (c)). The simulated curves have been ob-
tained with the help of IE3D which uses the simulated scat-
tering parameters. The experimental curves have been mea-
sured in the reverberation chamber and with the help of a
homemade Wheeler-Cap setup [16]. With frequency averag-
ing, the standard deviation of the efficiency measurements is
4 EURASIP Journal on Wireless Communications and Networking
Table 1: Comparison of η
tot
and the MEG of both antennas of the different structures at f = 2GHz.
η
tot
(dB) antenna1 MEG (dB) antenna1 η
tot
(dB) antenna2 MEG (dB) antenna2
Sim. RC Sim. RC Sim. RC Sim. RC
Initial
−0.816 −0.75 −3.826 −3.75 −0.81 −1.25 −3.826 −4.25
Line between the
feeding strips
−0.10 −0.2 −3.11 −3.2 −0.09 −0.5 −3.108 −3.5
Line between the
shorting strips
−0.14 −0.35 −3.152 −3.35 −0.14 −0.65 −3.151 −3.65
Table 2: MEG ratio of the antennas for all the prototypes at f =
2GHz.
MEG1/MEG2
Initial 1,12
Line between the feeding strips 1,07
Line between the shorting strips 1,07
given as +/ − 0.5 dB in the reverberation chamber. The un-
certainty of the homemade Wheeler Cap system is assumed
to be quite the same. The total efficiency of both antennas
from each prototype is presented. It can be seen that they
are slightly different in the two measurement cases (dotted
lines and solid lines) due to the fact that the fabricated proto-
types suffer from small inherent asymmetries. However, only
one curve is presented for each simulation case due to perfect
symmetries and identical structure on the CAD software. We
can observe that all these curves are in a good agreement es-
pecially if we compare their maximums. The small frequency
shift observed in all the curves with the dotted lines is due
to the fact that the antenna was mechanically modified dur-
ing transportation for measurement, and therefore frequency
is detuned. This effect impacts directly the S
11
and then the
frequency location of the maximum of the total efficiency.
The improvement brought by the neutralization technique
is clearly shown: the maximum total efficiency of the neu-
tralized antennas is around
−0.25 dB, whereas the one of the
initial structure is less than
−1dB.
3.2. Mean effective gain and mean effective gain ratio
In order to characterize the performance of a multichannel
antenna in a mobile environment, different parameters as the
MEG and the MEG ratio are used. The total efficiency is the
average antenna gain in the whole space. Equation (4) shows
that it can be calculated from the integration of the radiation
pattern cuts
η
tot
=
2π
0
π
0
G
θ
(θ, ϕ)+G
ϕ
(θ, ϕ)
sin θd θdϕ
4π
,(4)
where G
θ
and G
ϕ
are the antenna power gain patterns.
The MEG is a statistical measure of the antenna gain in
a mobile environment. It is equal to the ratio of the mean
received power of the antenna and the total mean incident. It
can be expressed by (5)asin[6]:
MEG
=
2π
0
π
0
XPR
1+XPR
G
θ
(θ, ϕ)P
θ
(θ, ϕ)
+
1
1+XPR
G
ϕ
(θ, ϕ)P
ϕ
(θ, ϕ)
sin θd θdϕ,
(5)
where P
θ
and P
ϕ
are the angular density functions of the inci-
dent power, and XPR represents the cross-polarization power
gain which is defined in (6):
XPR
=
2π
0
π
0
P
θ
(θ, ϕ)sinθd θdϕ
2π
0
π
0
P
ϕ
(θ, ϕ)sinθd θdϕ
. (6)
In the case where the antenna is located in a statistically uni-
form Rayleigh environment (i.e., the case in the reverbera-
tion chamber), we have XPR
= 1andP
θ
= P
ϕ
= 1/4π.The
MEG is then equal to the total antenna efficiency divided by
two or
−3dB[27]. Moreover, to achieve good diversity gain,
the average received power from each antenna element must
be nearly equal: this corresponds to getting the ratio of the
MEG between the two antennas close to unity [29]. Ta ble 1
presents η
tot
and the MEG of both antennas for the three pro-
totypes at f
= 2 GHz. The “Sim.” values have been computed
using the simulated radiation patterns while the reverbera-
tion chamber results “RC” are taken from the previous mea-
surements.
The neutralization line provides an enhancement of the
η
tot
and the MEG as expected from the previous values. The
improvement of the MEG is about 0.7 dB with regard to the
initial structure. Table 2 presents the MEG ratio between the
two antennas of the different prototypes (computed from
the RC MEG) at 2 GHz. It is seen that the antennas have
comparable-average-received power because these entire ra-
tios are close to unity. Such a result was somewhat expected
due to the symmetric antenna configuration of our proto-
types. In fact, the MEG difference only shows here the proto-
typing errors we made during the fabrication process. Nev-
ertheless, all the results of this section confirm the benefit of
using a neutralization technique between the radiators.
3.3. Correlation
For diversity and MIMO applications, the correlation be-
tween the signals received by the antennas at the same side of
A. Diallo et al. 5
1.81.85 1.91.95 2 2.05 2.12.15 2.2
Frequency (GHz)
−10
−8
−6
−4
−2
0
To t a l e fficiency (dB)
Simulation
Wheeler cap
Reverberation chamber
(a)
1.81.85 1.91.95 2 2.05 2.12.15 2.2
Frequency (GHz)
−10
−8
−6
−4
−2
0
To t a l e fficiency (dB)
Simulation
Wheeler cap
Reverberation chamber
(b)
1.81.85 1.91.95 2 2.05 2.12.15 2.2
Frequency (GHz)
−10
−8
−6
−4
−2
0
To t a l e fficiency (dB)
Simulation
Wheeler cap
Reverberation chamber
(c)
Figure 7: Total efficiency of the two-antenna structures: (a) with-
out the neutralization line, (b) with the neutralization line between
the feeding strips, and (c) with the neutralization line between the
shorting strips.
1.81.85 1.91.95 2 2.05 2.12.15 2.2
Frequency (GHz)
0
0.1
0.2
0.3
0.4
0.5
Envelope correlation coefficient
S-parameters
Far field
Reverberation chamber
(a)
1.81.85 1.91.95 2 2.05 2.12.15 2.2
Frequency (GHz)
0
0.1
0.2
0.3
0.4
0.5
Envelope correlation coefficient
S-parameters
Far field
Reverberation chamber
(b)
1.81.85 1.91.95 2 2.05 2.12.15 2.2
Frequency (GHz)
0
0.1
0.2
0.3
0.4
0.5
Envelope correlation coefficient
S-parameters
Far field
Reverberation chamber
(c)
Figure 8: Envelope correlation coefficient versus frequency of the
two-antenna systems: (a) without the neutralization line, (b) with
the line between the feeding strips, and (c) with the neutralization
line between the shorting strips.
6 EURASIP Journal on Wireless Communications and Networking
−35 −30 −25 −20 −15 −10 −50 510
Relative received power (dB)
10
−3
10
−2
10
−1
10
0
Cumulative probability
Diversity gain
at 1%
(a)
−35 −30 −25 −20 −15 −10 −50 5 10
Relative received power (dB)
10
−3
10
−2
10
−1
10
0
Cumulative probability
Diversity gain
at 1%
(b)
−35 −30 −25 −20 −15 −10 −50 510
Relative received power (dB)
10
−3
10
−2
10
−1
10
0
Cumulative probability
Diversity gain
at 1%
(c)
Figure 9: Cumulative probability of the two-antenna systems over
a 4 MHz bandwidth at 2 GHz: (a) without the neutralization line,
(b) with the neutralization line between the feeding strips, and (c)
with the neutralization line between the shorting strips.
−35 −30 −25 −20 −15 −10 −50 5 10
Relative received power (dB)
10
−3
10
−2
10
−1
10
0
Cumulative probability
Diversity gain
at 1%
(a)
−35 −30 −25 −20 −15 −10 −50 5 10
Relative received power (dB)
10
−3
10
−2
10
−1
10
0
Cumulative probability
Diversity gain
at 1%
(b)
−35 −30 −25 −20 −15 −10 −50 5 10
Relative received power (dB)
10
−3
10
−2
10
−1
10
0
Cumulative probability
Diversity gain
at 1%
(c)
Figure 10: Smoothed cumulative probability of the two-antenna
systems over a 4 MHz bandwidth at 2 GHz: (a) without the neu-
tralization line, (b) with the neutralization line between the feed-
ing strips, and (c) with the neutralization line between the shorting
strips.
A. Diallo et al. 7
a wireless link is an important figure of merit. Usually, the en-
velope correlation is presented to evaluate the diversity capa-
bilities of a multiantenna system [30]. This parameter should
be preferably computed from 3D-radiation patterns [31, 32],
but the process is tedious because sufficient pattern cuts must
be taken into account. In the case of a two-antenna system,
the envelope correlation ρ
e
is given by (7)asin[31, 32]:
ρ
e
=
4π
F
1
(θ, ϕ)•
F
∗
2
(θ, ϕ)dΩ
2
4π
F
1
(θ, ϕ)
2
dΩ
4π
F
2
(θ, ϕ)
2
dΩ
,(7)
where
F
i
= (θ, ϕ) is the field radiation pattern of the antenna
system when the port i is excited, and
• denotes the Hermi-
tian product.
However, assuming that the structure will operate in a
uniform multipath environment, a convenient and quick al-
ternative consists by using (8)(see[31–33]):
ρ
12
=
S
∗
11
S
12
+ S
∗
12
S
22
2
1 −
S
11
2
−
S
21
2
1 −
S
22
2
−
S
12
2
. (8)
It offers a simple procedure compared to the radiation pat-
tern approach, but it should be emphasized that this equation
is strictly valid when the three following assumptions are ful-
filled:
(i) lossless antenna case that means having antennas with
high efficiency and no mutual losses [29, 30];
(ii) antenna system is positioned in a uniform multipath
environment which is not strictly the case in real envi-
ronments, however, the evaluation of some prototypes
in different real environments has already shown that
there are no major differences in these cases [34];
(iii) load termination of the nonmeasured antenna is 50 Ω.
In reality, the radio front-end module does not always
achieve this situation, but the 50 Ω evaluation proce-
dure is commonly accepted [35, 36].
All these limitations are clearly showing that in real systems
the envelope correlation calculated based on of the help of
the S
ij
parameters is not the exact value, but nevertheless is a
good approximation. In addition, it should be noted that an-
tennas with an envelope correlation coefficient less than 0.5
are recognized to provide significant diversity performance
[30].
To measure the correlation between the antennas of our
systems in the reverberation chamber, each branch is con-
nected to a separate receiver. The two different received sig-
nals are recorded, and the envelope correlation can be di-
rectly computed. Figure 8 presents the measured envelope
correlation coefficients of all the antenna systems. They are
compared with those obtained using (7)(computationfrom
the simulated IE3D complex 3D-radiation patterns) and
with those obtained using (8)(measuredS-parameter val-
ues). All these curves are in a moderate agreement, but it can
be seen that the envelope correlation coefficients of all the
prototypes are always lower than 0.15 on the whole UMTS
band: good performance in terms of diversity is thus ex-
pected [1]. Here, it is however somewhat difficult to claim
that the neutralization technique provides an improvement
of the correlation. It seems rather obvious that with such
spaced antennas operating in a uniform multipath environ-
ment, low correlation is not very difficult to achieve.
3.4. Apparent diversity gain and actual diversity gain
The concept of diversity means that we make use of two or
more antennas to receive a signal and that we are able to com-
bine the replicas of the received signal in a desirable way to
improve the communication link performance. One require-
ment is high isolation between the antennas; otherwise the
diversity gain will be low. The apparent diversity gain G
div app
relative to antenna1 and the actual diversity gain G
div act
are
defined in (9)
G
div app
=
S/N
S
1
/N
1
,
G
div act
=
S/N
S
1
/N
1
η
tot1
,
(9)
where η
tot1
is the total efficiency of antenna1.
Note that these formulas are valid only if the noise signals
N
1
(and N
2
for the second antenna) are independent of the
total efficiency. This is the case if the system noise is dom-
inated by those of the receivers or if the antenna noise tem-
perature is the same as the surrounding temperature. The last
condition is often close to being satisfied in mobile systems
because the antenna is rather omnidirectional and picks up
thermal noise mainly from the environment (ground, build-
ings, trees, human) around the antenna, and less from the
low sky temperature.
We c an see in Figure 9 the power samples of each two-
antenna system (without the neutralization line (a), with the
line between the feeding strips (b), and with the line between
the shorting strips (c)) averaged over a 20-MHz frequency
band at 2 GHz. We can observe that the combined signal
curves with the selection combining scheme (solid lines) are
steeper than the two curves of the antenna elements taken
alone (dotted lines). This is the benefit of combining the
two signals received by each antenna of the structure. By just
looking at the curves in Figure 9, the uncertainty is undoubt-
edly very large. This is due to the obvious lack of samples at
low-probability levels coming from the measurement proce-
dure.
The apparent diversity gain is determined by the power-
level improvement at a certain probability level. In Figures
9(a), 9(b),and9(c), we have chosen 1% probability. It is then
the difference between the strongest antenna element curve
and the combined signal curve. The power improvement is
7.6 dB for the system with low isolation, whereas it is 8.8 dB
and 9.1 dB for the system with high isolation, respectively,
for the line between the shorting strips and the line between
the feeding strips. As the total efficiency is not taken into ac-
count in the apparent diversity gain, the improvement only
comes from the fact that the radiation patterns are slightly
different in the case of the two neutralized structures. Es-
pecially, an increase of the cross-polarization level occurs in
the radiation patterns of the neutralized structures due to the
8 EURASIP Journal on Wireless Communications and Networking
Table 3: Summary of the measured and computed diversity gains of all the antenna systems.
Prototypes
To t a l e fficiency
best branch
Apparent
diversity gain
Apparent diversity
gain, smooth
curved
Actual diversity
gain
Actual diversity
gain, smooth
curved
Without any line −0.75 dB 7.6 dB 8.6 dB 6.3 dB 7.8 dB
Shorting strips link
−0.35 dB 8.8 dB 9.2 dB 8 dB 8.8 dB
Feeding strips link
−0.2 dB 9.1 dB 9.75 dB 8.6 dB 9.5 dB
fact that a strong current is flowing on the line. This increase
of the X-pol appears to be beneficial for the diversity gain.
When taking into account the total efficiency of the anten-
nas, we can compute the actual diversity gain as 6.3 dB for
the initial system, 8 dB and 8.6 dB for the neutralized short-
ing strips and feeding strips systems, respectively. The data
from Figure 9 were also processed with the smooth function
of MATLAB [37] in order to evaluate the validity of our mea-
surements. Several “smooth steps” were tried out in this op-
eration and the new curves are presented in Figure 10.Itap-
pears that all the apparent diversity gains were formerly un-
derestimated. The new actual diversity gains are now 7.8 dB,
8.8 dB, and 9.5 dB for, respectively, the initial, the neutralized
shorting strips and feeding strips systems. A summary of all
these values can be found in Table 3.
It seems obvious that the neutralization technique en-
hances the actual diversity gain. These results are consistent
with other publications [38] and even better due to the use of
highly efficient antennas here. We should also point out that
the apparent diversity gain and the actual diversity gain are
not so much different due to the same reason [39].
4. CONCLUSION
In this paper, we have presented different two-antenna sys-
tems with poor and high isolations for diversity purposes.
The reverberation chamber measurements at the antenna
group of Chalmers University of Technology have shown that
even if the envelope correlation coefficient of these systems is
very low, having antennas with high isolation will improve
the total efficiency and the effective diversity gain of the sys-
tem. The same conclusions have been drawn regarding the
MEG values. All these results point out the usefulness of our
simple solution to achieve efficient antenna systems at the
terminal side of a wireless link for diversity or MIMO appli-
cations. Next studies will focus on the effect of the users upon
the neutralization technique by positioning the antenna sys-
tems next to a phantom head.
ACKNOWLEDGMENT
The authors express their gratitude to the COST284 project
for providing the opportunity to make a short-term scientific
mission from the LEAT to Chalmers Institute.
REFERENCES
[1] Z. Ying and D. Zhang, “Study of the mutual coupling, corre-
lations and efficiency of two PIFA antennas on a small ground
plane,” in Proceedings of IEEE Antennas and Propagation Soci-
ety International Symposium, vol. 3, pp. 305–308, Washington,
DC, USA, July 2005.
[2] J. Thaysen and K. B. Jakobsen, “MIMO channel capacity ver-
sus mutual coupling in multi antenna element system,” in
Proceedings of the 26th Annual Meeting & Symposium on An-
tenna Measurement Techniques Association (AMTA ’04),Stone
Mountain, Ga, USA, October 2004.
[3] M. Karakoikis, C. Soras, G. Tsachtsiris, and V. Makios, “Com-
pact dual-printed inverted-F antenna diversity systems for
portable wireless devices,” IEEE Antennas and Wireless Prop-
agation Letters, vol. 3, no. 1, pp. 9–14, 2004.
[4] K L. Wong, C H. Chang, B. Chen, and S. Yang, “Three-
antenna MIMO system for WLAN operation in a PDA phone,”
Microwave and Optical Technology Letters, vol. 48, no. 7, pp.
1238–1242, 2006.
[5] S. H. Chae, S K. Oh, and S O. Park, “Analysis of mutual
coupling, correlations, and TARC in WiBro MIMO array an-
tenna,” IEEE Antennas and Wireless Propagation Letters, vol. 6,
pp. 122–125, 2007.
[6] H. T. Hui, “Practical dual-helical antenna array for diver-
sity/MIMO receiving antennas on mobile handsets,” IEE Pro-
ceedings: Microwaves, Antennas and Propagation, vol. 152,
no. 5, pp. 367–372, 2005.
[7] J. Villanen, P. Suvikunnas, C. Icheln, J. Ollikainen, and P.
Vainikainen, “Advances in diversity performance analysis of
mobile terminal antennas,” in Proceedings of the International
Symposium on Antennas and Propagation (ISAP ’04), Sendai,
Japan, August 2004.
[8] M. Manteghi and Y. Rahmat-Samii, “Novel compact tri-band
two-element and four-element MIMO antenna designs,” in
Proceedings of the International Symposium on Antennas and
Propagations (ISAP ’06), pp. 4443–4446, Albuquerque, NM,
USA, July 2006.
[9] M. Manteghi and Y. Rahmat-Samii, “A novel miniaturized tri-
band PIFA for MIMO applications,” Microwave and Optical
Technology Letters, vol. 49, no. 3, pp. 724–731, 2007.
[10] D. Browne, M. Manteghi, M. P. Fits, and Y. Rahmat-Samii,
“Experiments with compact antenna arrays for MIMO radio
communications,” IEEE Transaction on Antennas and Propa-
gation, vol. 54, no. 11, part 1, pp. 3239–3250, 2007.
[11] B. Lindmark and L. Garcia-Garcia, “Compact antenna array
for MIMO applications at 1800 and 2450 MHz,” Microwave
and Optical Technology Letters, vol. 48, no. 10, pp. 2034–2037,
2006.
[12] R. G. Vaughan and J. B. Andersen, “Antenna diversity in mo-
bile communications,” IEEE Transactions on Vehicular Tech-
nology, vol. 36, no. 4, pp. 149–172, 1987.
[13] B. K. Lau, J. B. Andersen, G. Kristensson, and A. F. Molisch,
“Impact of matching network on bandwidth of compact an-
tenna arrays,” IEEE Transactions on Antennas and Propagation,
vol. 54, no. 11, pp. 3225–3238, 2006.
A. Diallo et al. 9
[14] J. B. Andersen and B. K. Lau, “On closely coupled dipoles in a
random field,” IEEE Antennas and Wireless Propagation Letter,
vol. 5, no. 1, pp. 73–75, 2006.
[15] J. W. Wallace and M. A. Jensen, “Termination-dependent
diversity performance of coupled antennas: network theory
analysis,” IEEE Transactions on Antennas and Propagation,
vol. 52, no. 1, pp. 98–105, 2004.
[16] M. A. J. Jensen and J. W. Wallace, “A review of antennas
and propagation for MIMO wireless communications,” IEEE
Transactions on Antennas and Propagation, vol. 52, no. 11, pp.
2810–2824, 2004.
[17] J. Thaysen and K. B. Jakobsen, “Mutual coupling reduction us-
ing a lumped LC circuit,” in Proceedings of the 13th Interna-
tional Symposium on Antennas (JINA ’04), pp. 492–494, Nice,
France, November 2004.
[18] S. Dossche, S. Blanch, and J. Romeu, “Optimum antenna
matching to minimise signal correlation on a two-port an-
tenna diversity system,” IET Electronics Letters, vol. 40, no. 19,
pp. 1164–1165, 2004.
[19]S.Dossche,J.Rodriguez,L.Jofre,S.Blanch,andJ.Romeu,
“Decoupling of a two-element switched dual band patch
antenna for optimum MIMO capacity,” in Proceedings of
the International Symposium on Antennas and Propagations
(ISAP ’06), pp. 325–328, Albuquerque, NM, USA, July 2006.
[20] Y. Gao, X. Chen, C. Parini, and Z. Ying, “Study of a dual-
element PIFA array for MIMO terminals,” in Proceedings of
the International Symposium on Antennas and Propagations
(ISAP ’06), pp. 309–312, Albuquerque, NM, USA, July 2006.
[21] A. Diallo, C. Luxey, P. Le Thuc, R. Staraj, and G. Kossi-
avas, “Study and reduction of the mutual coupling between
two mobile phone PIFAs operating in the DCS1800 and
UMTS bands,” IEEE Transactions on Antennas and Propaga-
tion, vol. 54, no. 11, part 1, pp. 3063–3074, 2006.
[22] A. Diallo, C. Luxey, P. Le Thuc, R. Staraj, and G. Kossiavas,
“Enhanced diversity antennas for UMTS handsets,” in Pro-
ceedings of the European Conference on Antennas and Propa-
gations (EuCAP ’06), Nice, France, November 2006.
[23] P S. Kildal and K. Rosengren, “Correlation and capacity of
MIMO systems and mutual coupling, radiation efficiency,
and diversity gain of their antennas: simulations and mea-
surements in a reverberation chamber,” IEEE Communications
Magazine, vol. 42, no. 12, pp. 104–112, 2004.
[24] />[25] T. Bolin, A. Derneryd, G. Kristensson, V. Plicanic, and Z. Ying,
“Two-antenna receive diversity performance in indoor envi-
ronment,” Electronics Letters, vol. 41, no. 22, pp. 1205–1206,
2005.
[26] T. Taga, “Analysis for mean effective gain of mobile antennas
in land mobile radio environments,” IEEE Transactions on Ve-
hicular Technology, vol. 39, no. 2, pp. 117–131, 1990.
[27] K. Kalliola, K. Sulonen, H. Laitinen, O. Kivek
¨
as, J. Krogerus,
and P. Vainikainen, “Angular power distribution and mean ef-
fective gain of mobile antenna in different propagation envi-
ronments,” IEEE Transactions on Vehicular Technology, vol. 51,
no. 5, pp. 823–838, 2002.
[28] IE3D, Release 11.15, Zeland software, 2005.
[29] C. C. Chlau, X. Chen, and C. Q. Parinl, “A compact four-
element diversity-antenna array for PDA terminals in a mimo
system,” Microwave and Optical Technology Letters, vol. 44,
no. 5, pp. 408–412, 2005.
[30] S. C. K. Ko and R. D. Murch, “Compact integrated diversity
antenna for wireless communications,” IEEE Transactions on
Antennas and Propagation, vol. 49, no. 6, pp. 954–960, 2001.
[31] I. Salonen and P. Vainikainen, “Estimation of signal correla-
tion in antenna arrays,” in Proceedings of the 12th International
Symposium Antennas (JINA ’02)
, vol. 2, pp. 383–386, Nice,
France, November 2002.
[32] P. Brachat and C. Sabatier, “R
´
eseau d’antennes
`
a6Capteursen
Diversit
´
e de Polarisation,” in Proceedings of the 13th Interna-
tional Symposium Antennas (JINA ’04), Nice, France, Novem-
ber 2004.
[33] J. Thaysen and K. B. Jakobsen, “Envelope correlation in (N, N)
MIMO antenna array from scattering parameters,” Microwave
and Optical Technology Letters, vol. 48, no. 5, pp. 832–834,
2006.
[34] Z. Ying, V. Plicanic, T. Bolin, G. Kristensson, and A. Derneryd,
“Characterization of Multi-Channel Antenna Performance for
Mobile Terminal by Using Near Field and Far Field Parame-
ters,” COST 273 TD (04)(095), G
¨
oteborg, Sweden, June 2004.
[35] A. Derneryd and G. Kristensson, “Signal correlation including
antenna coupling,” Electronics Letters, vol. 40, no. 3, pp. 157–
159, 2004.
[36] A. Derneryd and G. Kristensson, “Antenna signal correlation
and its relation to the impedance matrix,” Electronics Letters,
vol. 40, no. 7, pp. 401–402, 2004.
[37] />[38] K. Rosengren and P S. Kildal, “Diversity performance of a
small terminal antenna for UMTS,” in Proceedings of Nordic
Antenna Symposium (Antenn ’03), Kalmar, Sweden, May 2003.
[39] P S. Kildal, K. Rosengren, J. Byun, and J. Lee, “Definition
of effective diversity gain and how to measure it in a rever-
beration chamber,” Microwave and Optical Technology Letters,
vol. 34, no. 1, pp. 56–59, 2002.