Báo cáo hóa học: " Research Article Comparative Study of Contour Detection Evaluation Criteria Based on Dissimilarity Measures" doc
Bạn đang xem bản rút gọn của tài liệu. Xem và tải ngay bản đầy đủ của tài liệu tại đây (1.71 MB, 13 trang )
Hindawi Publishing Corporation
EURASIP Journal on Image and Video Processing
Volume 2008, Article ID 693053, 13 pages
doi:10.1155/2008/693053
Research Article
Comparative Study of Contour Detection Evaluation Criteria
Based on Dissimilarity Measures
´
´ `
Sebastien Chabrier,1 Helene Laurent,2 Christophe Rosenberger,3 and Bruno Emile2
1 Laboratoire
Terre-Oc´an, Universit´ de la Polyn´sie Francaise, BP 6570, 98702 Faa’a, Tahiti, Polyn´sie Francaise, France
e
e
e
¸
e
¸
PRISME, ENSI de Bourges, Universit´ d’Orl´ans, 88 boulevard Lahitolle, 18020 Bourges Cedex, France
e
e
3 Laboratoire GREYC, ENSICAEN, Universit´ de Caen, CNRS, 6 boulevard du Mar´chal Juin, 14050 Caen Cedex, France
e
e
2 Institut
Correspondence should be addressed to H´ l` ne Laurent,
ee
Received 18 July 2007; Revised 5 November 2007; Accepted 7 January 2008
Recommended by Ferran Marques
We present in this article a comparative study of well-known supervised evaluation criteria that enable the quantification of the
quality of contour detection algorithms. The tested criteria are often used or combined in the literature to create new ones. Though
these criteria are classical ones, none comparison has been made, on a large amount of data, to understand their relative behaviors.
The objective of this article is to overcome this lack using large test databases both in a synthetic and a real context allowing a
comparison in various situations and application fields and consequently to start a general comparison which could be extended
by any person interested in this topic. After a review of the most common criteria used for the quantification of the quality of
contour detection algorithms, their respective performances are presented using synthetic segmentation results in order to show
their performance relevance face to undersegmentation, oversegmentation, or situations combining these two perturbations. These
criteria are then tested on natural images in order to process the diversity of the possible encountered situations. The used databases
and the following study can constitute the ground works for any researcher who wants to confront a new criterion face to wellknown ones.
Copyright © 2008 S´ bastien Chabrier et al. This is an open access article distributed under the Creative Commons Attribution
e
License, which permits unrestricted use, distribution, and reproduction in any medium, provided the original work is properly
cited.
1.
INTRODUCTION
One of the first steps in image analysis consists in image
segmentation. This stage, which requires homogeneity or
dissimilarity notions, leads to two main approaches based,
respectively, on region or contour detection. The purpose
is to group together pixels or to delimit areas that have
close characteristics and thus to partition the image into
similar component parts. Many segmentation methods
based on these two approaches have been proposed in the
literature [1–3] and this subject still remains a prolific one
if we consider the quantity of recent publications in this
topic. Nobody has already completely mastered such a step.
Depending on the acquisition conditions, the applied basic
image processing techniques (such as contrast enhancement
and noise removal), and the aimed interpretation objectives,
different approaches can be efficient. Each of the proposed
methods lays the emphasis on different properties and
therefore reveals itself more or less suited to a considered
application. This variety often makes it difficult to evaluate
the efficiency of a proposed method and places the user in
a tricky position because no method reveals itself as being
optimal in all cases.
That is the reason why many works have been recently
performed to solve the crucial problem of the evaluation of
image segmentation results [4–10]. The proposed evaluation
criteria can be split into two major groups. The first one
gathers the evaluation criteria called unsupervised which
consist in the computation of different statistics upon
the segmentation result to quantify its quality [11–13].
These methods are based on the calculation of numerical
values from some chosen characteristics attached to each
pixel or group of pixels. These methods have the major
advantage of being easily computable without requiring any
expert assessment. Nevertheless, most of them are not very
robust while using textured images and can also present
some important shift if the evaluation criterion and the
tested segmentation method are both based on the same
2
statistical measure. In such a case, the criterion will not be
able to invalidate some erroneous behaviors of the tested
segmentation method. The second group is composed of
supervised evaluation criteria which are computed from a
dissimilarity measure between a segmentation result and
a ground truth of the same image. This reference can
either be obtained according to an expert judgement or set
during the generation of a synthetic test database: in the
case of evaluating contour detection algorithms, the ground
truth can either correspond to a manually made contour
extraction or, if synthetic images are used, to the contour
map from which the dataset is automatically computed. Even
if these methods inherently depend on the confidence in
the ground truth, they are widely used for real applications
and particularly for medical ones [14–16]. In such a case,
the ability of a segmentation method to favor a subsequent
interpretation and understanding of the image is taken into
account.
We focus in this communication on evaluation criteria
dedicated to the contour approach and based on the computation of dissimilarity measures between a segmentation
result and a reference contour map constituting the ground
truth. All the criteria presented in this study do not therefore
require the continuity of the contours. For that reason, they
are particularly adapted for the evaluation of the usual first
step of background/foreground segmentation algorithms
which are commonly composed of a preliminary contour
detection algorithm followed by some edge closing method;
but they are also essential when applications requiring
segments detection and not closed contours are pursued. It
can, for example, concern the detection of rivers or roads
in aerial images or the detection of veins in palms images
for biometric applications. Until now, none comparative
study of classical evaluation criteria has been made on a
large amount of data. Generally, when a new evaluation
criterion is proposed, its performances are either tested on
a few examples (four or five different images) or on several
images corresponding to a single application. Moreover,
the performance study is rarely completed by the use of
synthetic images. However, a preliminary study in a synthetic
context can be very useful to test the behaviors of the
evaluation criteria face to often encountered situations like
undersegmentation, oversegmentation affecting the contour,
presence of noise, and so forth. Working in a controlled
environment often allows to more precisely understand the
way how a criterion evolves in some specific situations. We
try in this article to overcome this lack using large test
databases both in a synthetic and a real context allowing
a comparison of classical evaluation criteria in various
situations and application fields. These databases and the
following study could be the ground works for any researcher
who wants to confront a new criterion face to well-known
ones.
After a first part devoted to a review of evaluation metrics
dedicated to contour segmentation and based on dissimilarity measures, several classical criteria are compared. We
first tested the evaluation criteria on synthetic segmentation
results we created. We also tested them on three-hundred
images extracted from the Corel database which contains
EURASIP Journal on Image and Video Processing
Segmentation
method
Segmentation result (IC )
Metric
Supervised
evaluation
Original image (I)
Expert
Ground truth (Iref )
Figure 1: Supervised evaluation of a segmentation result.
various real images corresponding to different application
fields such as medicine, aerial photography, landscape
images, and so forth, as well as corresponding experts
contour segmentations [4]. The conducted study shows how
these databases can be useful to compare the performances
of several criteria and put into obviousness their specific
behaviors. Finally, we conclude this study and give different
perspectives of works in this topic.
2.
SUPERVISED EVALUATION CRITERIA FOR
CONTOUR SEGMENTATION METHODS
The different methods presented in this section can either
be applied with synthetic or experts ground truths. In the
case of synthetic images, the ground truths are of course
totally reliable and have an extreme precision, but are not
always realistic. For real applications, the expert ground truth
is subjective and the confidence attached to this reference
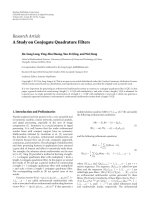
segmentation has to be known. Figure 1 presents the supervised evaluation procedure on a real image extracted from
the Corel database [4].
The next paragraphs present a review of some classical
available metrics used in this supervised context for contour
segmentation methods. These criteria have often been the
basis for the proposal of new ones, either by being modified
or combined.
Let Iref be the reference contours corresponding to a
ground truth, IC the detected contours obtained through a
segmentation result of an image I.
2.1.
Detection errors
Different criteria have initially been proposed to measure
detection errors [17, 18]. Most of them are based on the
following expressions or on various definitions issued from
them.
The overdetection error (ODE) corresponds to detected
contours of IC which do not match Iref :
ODE IC , Iref =
card IC/ref
,
card(I) − card Iref
(1)
S´ bastien Chabrier et al.
e
3
where card(I) is the number of pixels of I, card(Iref ) the
number of contour pixels of Iref , and IC/ref corresponds to the
pixels belonging to IC but not to Iref .
The underdetection error (UDE) corresponds to Iref
pixels which have not been detected:
A good segmentation result should simultaneously minimize
these three types of error.
Extensions of these detections errors have also been
proposed combining them with an additional term taking
into account the distance to the correct pixel position [7].
e
where Hα corresponds to the R` nyi entropies parametrized
by α > 0. This parameter is set to 3 in the comparative study
[22].
If these measures permit to obtain a global comparison between two images, they are often described in the
literature as not correctly transcribing the human visual
perception and more particularly the topological transformations (translations, rotations, etc.). The concerned graylevel domain is indeed not taken into account. If gray-level
images are used, a same intensity difference will then be
equally penalized whatever the domain can be. In our case,
these distances are used with binary images, this drawback
does, therefore, not exist anymore. In the same way, the
global position information does not intervene in distance
computation. Thus, if the same object appears in the two
images with a simple translation, the distances will increase
in an important way. If this evolution can be disturbing
with an object detection objective, for example, it becomes
an advantage in our case where a contour translation is a
mistake.
2.2. Lq and divergence distances
2.3.
Another idea to compare two images IC and Iref is to compute
between the two images some distance measures [19, 20].
A well-known set of such distances is constituted by the Lq
distances:
The Hausdorff distance between two pixels sets is computed
as follows [23]:
UDE IC , Iref =
card Iref/C
,
card Iref
(2)
where Iref/C corresponds to the pixels belonging to Iref but not
to IC .
Last, the localization error (LE) takes into account the
percentage of nonoverlapping contour pixels:
LE(IC , Iref ) =
card Iref/C ∪ IC/ref
card(I)
x∈X
Lq IC , Iref =
IC (x) − Iref (x)
card(X)
q
.
(3)
1/q
,
(4)
x∈X
DBH IC , Iref = −Log
DJE IC , Iref = J1
IC (x) − Iref (x) × Log IC (x)/Iref (x)
,
card(X)
x∈X
IC (x) × Iref (x)
,
card(X)
IC (x) + Iref (x)
, IC (x) ,
2
with
J1 IC (x), Iref (x)
IC (x) × Iref (x) −
Hα IC (x) + Hα Iref (x)
2
(6)
(7)
where
a∈IC
b∈Iref
,
(8)
If HAU(IC , Iref ) = d, this means that all the pixels belonging
to IC are not farther than d from some pixels of Iref . Although
this measure is theoretically very interesting and can give
a good similarity measure between the two images, it is
described as being very noise-sensitive.
Several extensions of this measure, like the Baddeley
distance, can be found in the literature [24].
2.4.
Pratt’s figure of merit
This criterion [25] corresponds to an empirical distance
between the ground truth contours Iref and those obtained
with the chosen segmentation IC :
PRA Iref , IC
=
(5)
= Hα
HAU IC , Iref = max h IC , Iref , h Iref , IC ,
h IC , Iref = max min a − b
where Ii (x) is the intensity of pixel x in image Ii , q ≥ 1,
and X corresponds to the common domain of IC and Iref ;
in our case, X is the complete image. These distances which
are initially defined to deal with the intensities of the pixels
can also be used for binary images. Note that, among these
distances, the classical root mean squared (RMS) error can be
obtained with q = 2. For the comparative study, q has been
chosen in {1, 2, 3, 4} defining the L1 , L2 , L3 , and L4 distances.
The considered measures can be completed by different
distances issued from probabilistic interpretations of images:
the Kă llback and Bhattacharyya (DKU and DBH) distances
u
and the “Jensen-like” divergence measure (DJE) based on
R` nyi entropies [21]:
e
DKU IC , Iref =
Hausdorff distance
1
max card Iref , card IC
card(IC )
k=1
1
,
1 + d2 (k)
(9)
where d(k) is the distance between the kth pixel belonging
to the segmented contour IC and the nearest pixel of the
reference contour Iref .
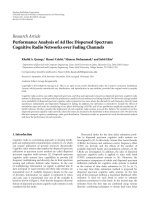
This measure has no theoretical proof but is however one
of the most used descriptors. It is not symmetrical and does
not express undersegmentation or shape errors. Moreover,
it is also described as being sensitive to oversegmentation
and localization problems. To illustrate some limits of this
criterion, we present in Figure 2 different situations with an
4
EURASIP Journal on Image and Video Processing
Object
Object
Object
(a)
(b)
(c)
Figure 2: Different situations with an identical number of misclassified pixels and leading to the same criterion value.
identical number of misclassified pixels and leading to the
same criterion value.
The three depicted situations are very dissimilar and
should not be equally marked. The misclassified pixels
should belong to the object in Figure 2(c) and to the
background in Figure 2(a). The proposed criterion considers
these situations as equivalent although the consequences
on the object size and shape are totally different. Moreover, this criterion does not discriminate between isolated
misclassified pixels (Figure 2(b)) or a group of such pixels
(Figure 2(a)) though the last situation is more prejudicial.
Modified versions of this criterion have been proposed in
the literature [26].
2.5. Odet’s criteria
Different measurements have been proposed in [27] to estimate various errors in binary segmentation results. Amongst
them, two divergence measures seem to be particularly
interesting. The first one (OCO) evaluates the divergence
between the oversegmented contour pixels and the reference
contour pixels:
N
OCO IC , Iref =
1 o d(k)
No k=1 dTH
n
,
(10)
where d(k) is the distance between the kth pixel belonging
to the segmented contour IC and the nearest pixel of the
reference contour Iref , No corresponds to the number of oversegmented pixels, and dTH is the maximum distance, starting
from the segmentation result pixels, allowed to search for a
contour point. If a pixel of the segmentation result is farther
than dTH from the reference, the criterion value is highly
penalized (all the more since n is big), the quotient d(k)/dTH
exceeding one. n is a scale factor which permits to weight
the pixels depending on their distance from the reference
contour.
The second one (OCU) estimates the divergence between
the undersegmented contour pixels and the computed contour pixels:
N
OCU IC , Iref
1 u du (k)
=
Nu k=1 dTH
n
,
(11)
where du (k) is the distance between the kth nondetected pixel
and the nearest one belonging to the segmented contour and
Nu corresponds to the number of undersegmented pixels.
These two criteria take into account the relative position
for the over- and undersegmented pixels. The threshold dTH ,
which has to be set according to each application precision requirement, permits to take the pixels into account
differently with regard to their distance from the reference
contour. These criteria also allow, thanks to exponent n, to
differently weight the estimated contour pixels that are close
to the reference contour and those whose distance to the
reference contour is close to dTH . With a small value of n, the
first ones are privileged, which leads to a precise evaluation.
For the comparative study, n is set to 1 and dTH equals 5.
2.6.
Discussion
As previously exposed, most of the presented criteria are
based on the computation of distance measures between
a segmentation result and a ground truth. Even if the
principles are often quite similar, no comparison has been
realized in the literature to evaluate the relative performances
of these proposed criteria. The problem lies in the fact
that the reference is not always easily available. Though a
few databases of assessed real images exist, a preliminary
study on synthetic images seems to be a powerful manner
to make a reliable comparison. Working in a controlled
environment indeed allows to more precisely understand the
way how a criterion evolves in some specific situations like
undersegmentation, oversegmentation affecting the contour,
presence of noise, and so forth.
3.
COMPARATIVE STUDY
When new evaluation criteria are proposed in the literature,
the definitions and principles on which they are based are
of course exposed. Thereafter, their behaviors are generally
illustrated by a few examples, often on some segmentation
results of a chosen image. A comparative study with classical
existing methods is sometimes conducted on a limited test
database. However, a comparative study of the principal
evaluation criteria, made on a large amount of data and
enabling to determine their relative relevance and their
favored application contexts, is not systematically done. We
try to fill this lack in this section. The main supervised evaluation criteria defined for contour segmentation results and
previously exposed are here tested. They mainly rely on the
computation of distances between an obtained segmentation
result and a ground truth. The tested criteria are ODE, UDE,
LE, L1 , L2 , L3 , L4 , DKU, DBH, DJE, HAU, PRA, OCO, and
OCU. In order to make the comparison easier for the reader,
we made all the criteria evolve in the same way. They all are
positive, growing with the amplitude of the perturbations.
The value 0 corresponds therefore to the best result. We
first studied the criteria on synthetic segmentation results.
Afterwards, we tested the chosen criteria on a selection of real
images extracted from the Corel database for which manual
segmentation results provided by experts are available [4].
Contrary to synthetic cases, this database allows us to process
S´ bastien Chabrier et al.
e
5
the diversity of the possible encountered situations in natural
images. Indeed, it contains images corresponding to different
application fields such as aerial photography or landscape
images.
3.1. Preliminary study on synthetic
segmentation results
Localization error
Undersegmentation
Ground truth
In order to study the behaviors of the previously presented
criteria in the face of different perturbations, we first generated some synthetic segmentation results corresponding to
several degradations of a ground truth we created. Some of
the obtained results were described in [28]; we present in this
article the complete study.
The used ground truth is composed of five components:
a central ring and four external contours (see Figure 3). The
tested perturbations are the following:
Figure 3: Ground truth and examples of perturbations.
Undersegmentation results
Different examples of the considered perturbations are presented in Figure 3.
Figure 4 presents the evolution of four criteria (L1 , HAU,
OCO, OCU) in the face of undersegmentation. The Y coordinates of the curves present the criteria values, the Xcoordinates correspond to the different segmentation results
to assess. Four of them (results 4, 11, 15, and 28) are
presented in Figure 4 and are put into obviousness on the
curves thanks to bold or dotted lines. OCO is equal to
zero whatever case is considered. As OCO only measures
oversegmentation, it equivalently grades a segmentation
result with one or several components missing. ODE has
the same behavior. L1 presents different stages allowing
to gradually penalize undersegmentation. This behavior
corresponds to the expected one and the majority of the
criteria evolves in that way (UDE, LE, L1 , L2 , L3 , L4 , DKU,
DBH, DJE, PRA). HAU also presents a graduated evolution
but seems to suffer from a lack of precision. It equivalently
grades some segmentation results even if the number of
detected components is completely different (see, e.g., the
segmentation results 11 and 15). Finally, OCU, which
normally measures undersegmentation, does not allow to
correctly differentiate the synthetic segmentation results. For
example, it better grades result 15 than result 28.
Figure 5 presents the evolution of three criteria (DKU,
PRA, OCO) in the face of oversegmentation corresponding
to the presence of impulsive noise. OCO penalizes too
strongly the presence of oversegmentation: for example, it
Oversegmentation:
dilatation of the
contours
4:
11:
15:
28:
×10−3
L1
HAU
1
6
4
0.5
2
Evaluation criteria
(i) undersegmentation: one or several components of the
ground truth are missing;
(ii) oversegmentation affecting the complete image: noisy
ground truth with impulsive noise (probability from
0.1% to 50%);
(iii) oversegmentation affecting the contour area: from 1 to
5 dilatation processes;
(iv) over- and undersegmentation affecting the contour
area: impulsive noise (probability of 1%, 5%, 10%, or
25%) in the contour area (width from 1 to 5 pixels);
(v) localization error: synthetic segmentation results obtained by contour shifts from 1 to 5 pixels in the four
cardinal directions.
Over- and
undersegmentation
affecting
the contour area
Oversegmentation:
impulsive noise
affecting the complete
image
0
10
1
20
OCO
30
0
10
20
OCU
30
10
20
30
0.8
0.6
0.4
0.2
0
−1
10
20
30
0
Figure 4: Evolution of four evaluation criteria in the face of undersegmentation.
2:
6:
(0.2 %)
2:
4:
Evaluation criteria
LE
12:
×10−3
(25 %)
PRA
L2
0.24
0.15
0.2
0.1
0.16
0.05
0.12
1
DKU
25
2
3
4
5
1
2
3
4
5
Figure 6: Evolution of two evaluation criteria in the face of oversegmentation due to the dilatation of contours.
0.8
17
Evaluation criteria
(1 %)
Oversegmentation results
EURASIP Journal on Image and Video Processing
Oversegmentation results
6
0.6
9
0.4
0.2
1
2 4
6
8 10 12
×10−3
2 4
6
8 10 12
OCO
76
73
70
67
2 4
6 8 10 12
Figure 5: Evolution of three evaluation criteria in the face of
oversegmentation corresponding to the presence of impulsive noise.
equivalently grades the segmentation results with impulsive
noise of probabilities 0.2% and 25%. Moreover, the evolution
of this criterion is not monotonic. HAU has the same kind
of behavior. DKU really penalizes oversegmentation only
when it reaches a high level. ODE, LE, L1 , L2 , L3 , L4 ,
DBH, DJE have the same kind of behavior. OCU and UDE,
which only measure undersegmentation, equivalently grade
segmentation results with a small or high presence of noise.
They are equal to zero whatever case is considered. Finally,
PRA permits to penalize the presence of impulsive noise as
soon as it appears. This criterion is the only one with a
behavior that is close to the human decision: an expert will
notice the presence of noise even for a small proportion and
will immediately penalize it. On the other hand, an expert
will not grade too noisy segmentation results very differently.
Concerning oversegmentation due to the dilatation of
contours, except UDE and OCU which are equal to zero
whatever case is considered, the other criteria present quite
the same behavior which is the expected one: Figure 6
presents as an example the evolution of LE and L2 .
In order to testthe influence of combined over- and
undersegmentation, we first added, in the contour area, an
impulsive noise with probabilities of 1%, 5%, 10% and 25%.
The noise was, respectively, added in a neighborhood of the
contour with a window width from 1 to 5 pixels. Figure 7
presents the evolution of three criteria (DJE, HAU, PRA) in
the face of this perturbation. We can notice that, as expected,
HAU ranks the segmentation results with respect to the
width of the noisy area around the contour. Nevertheless,
it does not seem to take into account the probability of
apparition of noise: the three examples presented in Figure 7
are equivalently graded. HAU and OCO, which evolve in the
same way, seem to suffer from a lack of precision in that case.
On the other hand, DJE and PRA correctly evolve penalizing
in a more important way a high probability and a large noisy
area around the contour. Most of the other criteria: LE, ODE,
DBH, DKU, L1 , L2 , L3 , and L4 have the same behavior.
Last, we studied the influence of localization error. For
these synthetic segmentation results, the contours have been
moved from 1 to 5 pixels in the four cardinal directions.
Figure 8 presents the evolution of three criteria (ODE, UDE,
PRA) in the face of this perturbation. In this figure, the
original contour appears dotted to make the perturbation
remarkable. We can observe that all the criteria penalize
more a segmentation result if it corresponds to an increasing
shifting. Whatever, UDE and PRA are more precise (OCO,
OCU, and HAU evolve in a similar way).
As a result of this preliminary study, we can conclude
that most of the studied criteria have a global correct
behavior, that is, a behavior corresponding in general to the
expected one. However, some of them turned out not to
be appropriate to characterize some situations. Table 1 sums
up the performances of the different criteria in the face of
the considered perturbations. The OCO and OCU criteria
were computed with the parameters advocated in [27] (n =
1 and dTH = 5). Fitted parameters seem to be essential to
obtain the optimal performances for each situation. This
shows that these criteria are less generic than ODE or UDE.
These conclusions could be useful to make the necessary
choices to propose a new measure combining two criteria
dedicated, respectively, to under- and oversegmentation.
S´ bastien Chabrier et al.
e
7
Table 1: Relevance of the different criteria for each considered perturbation (the more stars, the better criterion).
Undersegmentation
∗∗
ODE
UDE
LE
L1
L2
L3
L4
DKU
DBH
DJE
HAU
PRA
OCO
OCU
Over-/undersegmentation
∗∗∗
∗∗∗
∗∗
∗∗∗
∗∗∗
∗∗
∗∗∗
∗∗∗
∗∗
∗∗
∗∗
∗∗∗
∗∗∗
∗∗
∗∗
∗∗
∗∗∗
∗∗∗
∗∗
∗∗
∗∗
∗∗∗
∗∗∗
∗∗
∗∗
∗∗
∗∗∗
∗∗∗
∗∗
∗∗∗
∗∗
∗∗∗
∗∗∗
∗∗
∗∗∗
∗∗
∗∗∗
∗∗∗
∗∗
∗∗∗
∗∗
∗∗∗
∗∗∗
∗∗
∗
∗
∗∗∗
∗
∗∗∗
∗∗∗
∗∗∗
∗∗∗
∗∗∗
∗∗∗
∗
∗∗∗
∗
∗∗∗
∗
4:
∗∗∗
(1 %-4 pixels)
9:
19:
(5 %-4 pixels)
4:
11:
(1 pixel-top)
×10−4
DJE
6
10
4
5
2
10
15
(5 pixels-left)
HAU
×10−3
×10−3
ODE
10.2
20
5
10
15
20
PRA
0.5
0.3
9
9.4
UDE
12
9.8
Evaluation criteria
15
5
(3 pixels-bottom)
(25 %-4 pixels)
17:
×10−4
Evaluation criteria
Localization error
∗∗∗
Segmentation results
Segmentation results
Oversegmentation
Noise
Dilatation
6
9
3
5
10
15
20
5
10
15
20
PRA
0.8
0.7
0.1
0.6
5
10
15
20
0.5
5
Figure 7: Evolution of three evaluation criteria in the face of
combined over- and undersegmentation localized in the contour
area.
10
15
20
Figure 8: Evolution of three evaluation criteria in the face of
combined over- and undersegmentation due to contours shifting.
8
EURASIP Journal on Image and Video Processing
Ground truths
Expert 1
Expert 2
Widened
1 2 3 3
1 2 2
1 2
1 2
1 2
1
2
3
3
3
3
2
1
1
2
2
2
2
3
2
1
1
1
1
1
2
3
2
1
1
Fused
2 3 3
1 2 2
1 1
1
1
2
3
2
2
2
1
2
3
3
3
1
2
2
2
widened
4 7 9
1 4 6
1 3
3
2
7
8
6
6
5
3
5
8
9
9
8
6
3
2
5
6
6
7
9
6
3
2
3
3
4
7
8
5
3
3
2
3
2
2
1
1
2
3
3
3
2
2
1
ground
2
5
8
7
6
6
3
6
9
9
9
Expert 3
ground truths
1
2
2
2
3
3
2
1
1
1
1
2
3
2
1
1
1
1
2
3
2
2
2
1
2
3
3
3
1 2 3 2
1 2 3
1 2
1 2
1 2
1
1
2
2
2
1
2
3
3
3
2
1
1
2
2
2
3
2
1
1
1
1
2
3
2
1
1
1
2
3
2
2
1
2
3
3
3
1
2
2
2
Fused ground truth
3
6
6
6
Figure 10: Principle on which the fused ground truths are created.
Figure 9: Examples of real images extracted from the Corel database and corresponding experts ground truths.
HAU revealed itself as being not relevant to precisely characterize undersegmentation or localization errors. Finally, LE,
L1 , L2 , L3 , L4 , DKU, DBH, DJE, and PRA have a correct
behavior in the face of the considered perturbations, PRA ,
giving in this preliminary study the most clear-cut decision.
3.2. Complementary study on real
segmentation results
In order to complete this preliminary study, we tested the
different criteria on segmentation results issued from real
images to process the diversity of the possible encountered
situations. Our database was composed of 300 images
extracted from the Corel database for which manual segmentation results provided by experts are available [4].
Figure 9 presents two examples of the available images
and corresponding ground truths established by different
experts. For each image of the database, 5 to 8 experts ground
truths are available.
We can notice that these ground truths can be quite
dissimilar. Some experts only attach to put into obviousness
the main objects in the image. Others are more sensitive
to the objects present in the background. We then decided
to make a fusion of the different expert ground truths in
order to obtain a more representative one. The following
method was applied to create the fused ground truths: for
each expert ground truth, a widened one was created. The
pixels belonging to the contour were set to 3, their direct
neighbors (4-connected) were set to 2, and the following
ones, connected to direct neighbors, were set to 1. For one
Figure 11: Examples of obtained fused ground truths.
Figure 12: Example of the fuzzy contour map obtained for two
original images of the Corel database with the Canny filter.
S´ bastien Chabrier et al.
e
9
Original image
1
1
LE
0.5
0
1
50
100
150
200
1
250
DKU
0.5
0
50
100
150
200 250
L3
0.5
200
250
0
50
100
150
200 250
50
100
150
200
250
L1
OCU
0.5
50
100
150
200 250
L4
100
150
200 250
50
100
150
1
0
150
200
250
DJE
0
50
100
150
1
200
250
L2
0
50
100
150
1
200 250
OCO
0.5
200 250
PRA
0
50
100
150
1
200 250
HAU
0.5
0.5
50
100
0.5
1
0
50
0.5
1
0
0
1
DBH
0.5
1
0
150
0.5
1
0
100
0.5
0.5
0
50
1
ODE
UDE
0.5
50
100
150
200 250
0
50
100
150
200 250
Figure 13: Evolution, for one image of the Corel database, of the 14 studied criteria for segmentation results obtained with the Canny filter
using different thresholds.
real image, all the available widened ground truths were
added and a pixel was considered as belonging to the contour
if its score strictly exceeded twice the number of experts.
Figure 10 presents the principle on which the fused ground
truths were established and Figure 11 presents the fused
ground truths obtained for two real images.
These filters generate fuzzy contour maps. Figure 12
presents examples of the maps obtained for two images with
the Canny filter.
In order to test the different evaluation criteria, we segmented the image database with 10 segmentation algorithms
based on threshold selection [29]:
(i)
(ii)
(iii)
(iv)
(v)
(vi)
(vii)
(viii)
(ix)
(x)
color gradient,
texture gradient,
second-moment matrix,
brightness/texture gradients,
gradient multiscale magnitude,
brightness gradient,
first-moment matrix,
color/texture gradients,
gradient magnitude,
Canny filter.
As we need binary contour maps, we thresholded the
fuzzy contour maps to obtain various segmentation results.
The threshold value (Th) was set from 5 to 255. For each
segmentation result, the 14 studied criteria were computed
using the fused ground truth. Figures 13 and 14 present the
different curves obtained with the Canny filter on two images
of the Corel database. The Y -coordinates of the curves
present the criteria values. The X-coordinates correspond to
the different chosen values (Th ∈ [5, 255]) to threshold the
fuzzy contour map: a very small threshold value conducting
to a high oversegmented segmentation result. In order to
make the comparison easier for the reader, we normalized
the criteria: they all evolve between 0 and 1, 0 being the best
result.
A relevant criterion should be able to detect a compromise between under- and oversegmentation and consequently present a minimum. This approach is similar to the
one proposed in [7]. A criterion which evolves in a monotonic way is indeed not satisfactory. If it always increases
(resp., decreases), that means that the oversegmented (resp.,
the undersegmented) case is too much favored. Similarly,
even if it is not monotonic, a criterion which systematically
selects the first tested threshold value: Th = 5 (resp., the last
10
EURASIP Journal on Image and Video Processing
Original image
1
1
LE
0.5
0
1
50
100
150
1
200
250
DKU
0.5
0
50
100
150
200 250
L3
0.5
200
0
50
100
150
200 250
OCU
0.5
50
100
150
200
100
150
200 250
150
200
250
DJE
50
100
150
1
L1
200
250
L2
0.5
50
100
150
0
200 250
50
100
150
1
L4
200 250
OCO
0.5
50
100
150
1
0
0
250
0
200 250
50
100
150
1
PRA
200 250
HAU
0.5
0.5
50
100
0.5
1
0
50
1
DBH
1
0
0
250
0.5
1
0
150
0.5
1
0
100
0.5
0.5
0
50
1
ODE
UDE
0.5
50
100
150
0
200 250
50
100
150
200 250
Figure 14: Evolution, for one image of the Corel database, of the 14 studied criteria for segmentation results obtained with the Canny filter
using different thresholds.
Table 2: Situation mostly favored by the criteria for segmentation
results issued from real images of the Corel database.
Undersegmentation
Figure 15: Binary images obtained using the optimal threshold
selected by the criterion PRA for the two original images of Figures
13 and 14 with the Canny filter.
tested threshold value: Th = 255) as being the best, must be
rejected.
We can observe, on both Figures 13 and 14 that the
LE, L1 , L2 , L3 , L4 , DJE, DKU criteria are always decreasing,
preferring the undersegmentation. As a result of their definitions, OCO and ODE also privilege the undersegmentation.
ODE
UDE
LE
L1
L2
L3
L4
DKU
DBH
DJE
HAU
PRA
OCO
OCU
√
Compromise
Oversegmentation
√
√
√
√
√
√
√
√
√
√
√
√
√
Similarly, UDE and OCU privilege the oversegmentation. We
can also notice that DBH is not relevant. First of all, it evolves
S´ bastien Chabrier et al.
e
11
1
300 images of the
©Corel database
0.5
0
1
100
150
1
200
250
DKU
0.5
0
50
100
150
200 250
L3
0.5
150
200
250
0
50
100
150
200 250
50
100
150
200
250
L1
OCU
0.5
50
100
150
200 250
L4
100
150
200 250
50
100
150
1
0
150
200
250
DJE
0
50
100
150
1
200
250
L2
0
50
100
150
1
200 250
OCO
0.5
200 250
PRA
0
50
100
150
1
200 250
HAU
0.5
0.5
50
100
0.5
1
0
50
0.5
1
0
0
1
DBH
0.5
1
0
100
0.5
1
0
50
0.5
50
UDE
0.5
1
ODE
0.5
0
1
LE
50
100
150
200 250
0
50
100
150
200 250
Figure 16: Mean evolution, for the 300 images of the Corel database, of the 14 studied criteria for segmentation results obtained with 10
segmentation algorithms based on threshold selection.
in a monotonic way, and the obtained values are very similar
whatever case is considered: high over- or undersegmentation. These results allow to balance the conclusions resulting
from the preliminary study using synthetic segmentation
results. It shows the interest to complete the study with real
segmentation results. Finally, only two criteria allow to detect
a compromise: PRA and HAU. We can however notice, as
previously mentioned in the preliminary study on synthetic
segmentation results, that HAU seems to suffer from a lack of
precision. It equivalently grades some segmentation results
even if a different threshold value always conducts to slightly
different situations (see, e.g., Figure 14: for a threshold value
growing from 5 to 90, HAU is constant).
Figure 15 presents the binary images obtained using the
optimal threshold selected by the criterion PRA for the two
original images of Figures 13 and 14 with the Canny filter.
Figure 16 presents the mean curves obtained on the 300
images of the Corel database using for each image the 10
segmentation algorithms. If these curves only present the
global trends of the criteria behaviors, they are nevertheless
revealing. Some of them are very similar with those presented
in the single cases of Figures 13 and 14 expressing repetitive
behaviors. The two criteria presenting a minimum are PRA
and HAU. These two criteria allow in almost all cases to
detect a compromise.
Table 2 sums up the situation mostly favored by the
different criteria in the face of segmentation results issued
from real images of the Corel database.
4.
CONCLUSION
We presented in this article a review of classical available
metrics used for the evaluation, in the supervised context,
of contour detection methods. The studied criteria compute
a dissimilarity measure between a segmentation result and
a ground truth. We tested their relative performances on
synthetic and real segmentation results. Thanks to the
first part of the comparison, done on synthetic results,
we concluded that different criteria (LE, L1 , L2 , L3 , L4 ,
DKU, DBH, DJE, and PRA) had a global correct behavior.
PRA stood out as the most interesting one, giving more
discriminated results and allowing a most clear-cut decision.
The second part of the comparative study, done on real
segmentation results, confirmed this conclusion.
This article permitted to start a general comparison
which could be extended by any person interested in this
12
EURASIP Journal on Image and Video Processing
topic. The used databases are at everyone’s disposal at the
following addresses:
(i) />.html for the synthetic segmentation results;
(ii) />vision/grouping/segbench/for the real segmentation
results extracted from the Corel database.
This study concerned criteria which do not require the
continuity of the contours, we plan to first of all complete it
using criteria dedicated to the evaluation of region detection
algorithms when segmentations presenting closed contours
are available (at least closed by the image edges). In these
cases, the correspondence between contours and regions can
be easily obtained.
Secondly, we plan to combine different criteria in order
to obtain a new one taking advantage of their relative
specificities. It could be, for example, interesting to combine
OCO and OCU which are, respectively, dedicated to the
detection of over- and undersegmentation.
We are also interested in assessing if a criterion is able to
reflect the subjective evaluation of a human expert or not.
We plan to realize a psychovisual study for the comparison
of contour segmentation results. The goal of this experiment
will be first of all to know if the comparison of multiple
contour segmentation results of a single image can be made
easily and can provide a similar judgement for different
experts. This psychovisual study could also be used to
check if evaluation criteria are able to reproduce the human
judgment.
These evaluation criteria could finally be applied in
medical contexts when comparisons with expert diagnostics
are required. When new segmentation methods are proposed
in this context, their behaviors are often illustrated by few
examples and generally visually assessed. An evaluation
criterion will permit to overcome this subjective step or to
confirm it.
[5]
[6]
[7]
[8]
[9]
[10]
[11]
[12]
[13]
[14]
[15]
ACKNOWLEDGMENT
The authors would like to thank the Conseil R´ gional du
e
Centre and the European union (FSE) for their financial
support.
REFERENCES
[1] R. M. Haralick and L. G. Shapiro, “Image segmentation
techniques,” Computer Vision, Graphics, and Image Processing,
vol. 29, no. 1, pp. 100–132, 1985.
[2] M. Heath, S. Sarkar, T. Sanocki, and K. Bowyer, “Comparison
of edge detectors: a methodology and initial study,” Computer
Vision and Image Understanding, vol. 69, no. 1, pp. 38–54,
1998.
[3] J. Freixenet, X. Mu˜ oz, D. Raba, J. Mart´, and X. Cuf´, “Yet
n
ı
ı
another survey on image segmentation: region and boundary
information integration,” in Proceedings of the 7th European
Conference on Computer Vision (ECCV ’02), pp. 408–422,
Copenhagen, Denmark, May 2002.
[4] D. R. Martin, C. C. Fowlkes, D. Tal, and J. Malik, “A database
of human segmented natural images and its application to
[16]
[17]
[18]
[19]
[20]
[21]
evaluating segmentation algorithms and measuring ecological
statistics,” in Proceedings of the 8th IEEE International Conference on Computer Vision (ICCV ’01), vol. 2, pp. 416–423,
Vancouver, BC, Canada, July 2001.
G. Liu and R. M. Haralick, “Optimal matching problem in
detection and recognition performance evaluation,” Pattern
Recognition, vol. 35, no. 10, pp. 2125–2139, 2002.
Y. Yitzhaky and E. Peli, “A method for objective edge
detection evaluation and detector parameter selection,” IEEE
Transactions on Pattern Analysis and Machine Intelligence,
vol. 25, no. 8, pp. 1027–1033, 2003.
N. L. Fern´ ndez-Garc´a, R. Medina-Carnicer, A. Carmonaa
ı
Poyato, F. J. Madrid-Cuevas, and M. Prieto-Villegas, “Characterization of empirical discrepancy evaluation measures,”
Pattern Recognition Letters, vol. 25, no. 1, pp. 35–47, 2004.
` e
S. Chabrier, “Contribution a l’´ valuation de performances
en segmentation d’images,” Ph.D. dissertation, Universit´
e
d’Orl´ ans, Orl´ ans, France, 2005.
e
e
S. Wang, F. Ge, and T. Liu, “Evaluating edge detection through
boundary detection,” EURASIP Journal on Applied Signal
Processing, vol. 2006, Article ID 76278, 15 pages, 2006.
Y.-J. Zhang, Ed., Advances in Image and Video Segmentation,
IRM Press, Hershey, Pa, USA, 2006.
R. Zeboudj, “Filtrage, seuillage automatique, contraste et
`
contours: du pr´ -traitement a l’analyse d’image,” Ph.D. dise
sertation, Universit´ de Saint Etienne, Saint Etienne, France,
e
1988.
M. Borsotti, P. Campadelli, and R. Schettini, “Quantitative
evaluation of color image segmentation results,” Pattern
Recognition Letters, vol. 19, no. 8, pp. 741–747, 1998.
C. Rosenberger, “Mise en oeuvre d’un syst` me adaptatif
e
de segmentation d’images,” Ph.D. dissertation, Universit´ de
e
Rennes, Rennes, France, December 1999.
S. Montr´ sor, M. J. Lado, P. G. Tahoces, M. Souto, and
e
J. J. Vidal, “Analytic wavelets applied for the detection of
microcalcifications. A tool for digital mammography,” in
Proceedings of the 12th European Signal Processing Conference
(EUSIPCO ’04), pp. 2215–2218, Vienna, Austria, September
2004.
F. Marques, G. Cuberas, A. Gasull, D. Seron, F. Moreso, and
N. Joshi, “Mathematic morphology approach for renal biopsy
analysis,” in Proceedings of the 12th European Signal Processing
Conference (EUSIPCO ’04), pp. 2195–2198, Vienna, Austria,
September 2004.
W. W. Lee, I. Richardson, K. Gow, Y. Zhao, and R. Staff,
“Hybrid segmentation of the hippocampus in MR images,” in
Proceedings of the 13th European Signal Processing Conference
(EUSIPCO ’05), Antalya, Turkey, September 2005.
W. A. Yasnoff, J. K. Mui, and J. W. Bacus, “Error measures
for scene segmentation,” Pattern Recognition, vol. 9, no. 4, pp.
217–231, 1977.
Y.-J. Zhang, “A survey on evaluation methods for image
segmentation,” Pattern Recognition, vol. 29, no. 8, pp. 1335–
1346, 1996.
H. Laurent, “D´ tection de ruptures spectrales dans le plan
e
´
tempsfr equence,” Ph.D. dissertation, Universit´ de Nantes,
e
Nantes, France, November 1998.
M. Basseville, “Distance measures for signal processing and
pattern recognition,” Signal Processing, vol. 18, no. 4, pp. 349–
369, 1989.
O. Michel, R. Baraniuk, and P. Flandrin, “Time-frequency
based distance and divergence measures,” in Proceedings
of IEEE International Symposium on Time-Frequency and
S´ bastien Chabrier et al.
e
[22]
[23]
[24]
[25]
[26]
[27]
[28]
[29]
Time-Scale Analysis (TFTS ’94), pp. 64–67, Philadelphia, Pa,
USA, October 1994.
R. Baraniuk, P. Flandrin, and O. Michel, “Information and
complexity on the time-frequency plane,” in Proceedings of
the 14th Gretsi Symposium on Signal and Image Processing
(GRETSI ’93), vol. 1, pp. 359–362, Juan-les-Pins, France,
September 1993.
M. Beauchemin, K. Thomson, and G. Edwards, “On the
Hausdorff distance used for the evaluation of segmentation
results,” Canadian Journal of Remote Sensing, vol. 24, no. 1, pp.
3–8, 1998.
A. J. Baddeley, “An error metric for binary images,” in
Proceedings of the 2nd International Workshop on Robust
Computer Vision, pp. 59–78, Bonn, Germany, March 1992.
W. K. Pratt, O. D. Faugeras, and A. Gagalowicz, “Visual
discrimination of stochastic texture fields,” IEEE Transactions
on Systems, Man and Cybernetics, vol. 8, no. 11, pp. 796–804,
1978.
K. C. Strasters and J. J. Gerbrands, “Three-dimensional image
segmentation using a split, merge and group approach,”
Pattern Recognition Letters, vol. 12, no. 5, pp. 307–325, 1991.
C. Odet, B. Belaroussi, and H. Benoit-Cattin, “Scalable
discrepancy measures for segmentation evaluation,” in Proceedings of the International Conference on Image Processing
(ICIP ’02), vol. 1, pp. 785–788, Rochester, NY, USA, September
2002.
S. Chabrier, H. Laurent, C. Rosenberger, and Y.-J. Zhang,
“Supervised evaluation of synthetic and real contour segmentation results,” in Proceedings of the 14th European Signal Processing Conference (EUSIPCO ’06), Florence, Italy, September
2006.
D. R. Martin, C. C. Fowlkes, and J. Malik, “Learning to
detect natural image boundaries using local brightness, color,
and texture cues,” IEEE Transactions on Pattern Analysis and
Machine Intelligence, vol. 26, no. 5, pp. 530–549, 2004.
13