Báo cáo hóa học: "Research Article Development of a Testbed for Wireless Underground Sensor Networks" ppt
Bạn đang xem bản rút gọn của tài liệu. Xem và tải ngay bản đầy đủ của tài liệu tại đây (2.08 MB, 14 trang )
Hindawi Publishing Corporation
EURASIP Journal on Wireless Communications and Networking
Volume 2010, Article ID 620307, 14 pages
doi:10.1155/2010/620307
Research Article
Development of a Testbed for
Wireless Underg round Sensor Networks
Agnelo R. Silva and Mehmet C. Vuran
Department of Computer Science and Engineering, University of Nebraska-Lincoln, Lincoln, NE 68588, USA
Correspondence should be addressed to Agnelo R. Silva,
Received 2 June 2009; Revised 21 October 2009; Accepted 27 November 2009
Academic Editor: Arnd-Ragnar Rhiemeier
Copyright © 2010 A. R. Silva and M. C. Vuran. This is an open access article distributed under the Creative Commons Attribution
License, which permits unrestricted use, distribution, and reproduction in any medium, provided the original work is properly
cited.
Wireless Underground Sensor Networks (WUSNs) constitute one of the promising application areas of the recently developed
wireless sensor networking techniques. WUSN is a specialized kind of Wireless Sensor Network (WSN) that mainly focuses on the
use of sensors that communicate through soil. Recent models for the wireless underground communication channel are proposed
but few field experiments were realized to verify the accuracy of the models. The realization of field WUSN experiments proved to
be extremely complex and time-consuming in comparison with the traditional wireless environment. To the best of our knowledge,
this is the first work that proposes guidelines for the development of an outdoor WUSN testbed with the goals of improving the
accuracy and reducing of time for WUSN experiments. Although the work mainly aims WUSNs, many of the presented practices
can also be applied to generic WSN testbeds.
1. Introduction
Wireless Underground Sensor Networks (WUSNs) are a
natural extension of the wireless sensor network (WSN)
phenomenon to the underground environment. WUSNs
have been considered as a potential field that will enable a
wide variety of novel applications in the fields of intelligent
irrigation, border patrol, assisted navigation, sports field
maintenance, intruder detection, and infrastructure moni-
toring [1]. Despite their potential, very few field experiments
[2–4] have been realized, which delays the proliferation
of WUSN applications. Recent models for the wireless
underground communication channel are also proposed but
few field experiments was realized to verify the accuracy of
the models [2, 3, 5]. One possible explanation for the lack
of a significant number of field experiments for WUSNs is
that such experiments proved to be extremely complex and
present novel challenges compared to the traditional wireless
environment. Moreover, constant changes in the outdoor
environment, such as the soil moisture, can contribute to
the problems related to the repeatability and comparisons
between WUSN experiments.
In this paper, we describe a WUSN testbed which was
built in two locations. The first part of the experiments was
realized in University of Nebraska-Lincoln City Campus on
a field provided by the UNL Landscaping Services during
August–November 2008 period. The second part of the
experiments was realized in UNL South Central Agricultural
Laboratory, Clay Center, NE, during July–October 2009
period. Moreover, the experiments in [4] followed the
guidelines described in this work. Based on the experiences
acquired from hundreds of hours of WUSN experiments
in this testbed, the details related to the development of
an outdoor WUSN testbed are presented in this work.
To the best of our knowledge, this is the first work that
proposes guidelines for the development of a WUSN testbed
to improve the accuracy and to reduce the time for WUSN
experiments. The recommended practices in this work range
from radio frequency (RF) measurements using sensor nodes
to the use of practical techniques that significantly reduce
the time to install and remove the sensor nodes in the
underground setting. The main objective of this work is the
proliferation of best practices in the area of WUSNs in the
following issues:
(i) the time reduction for the realization of WUSN
experiments through the use of a WUSN testbed,
(ii) the improvement of the accuracy,
2 EURASIP Journal on Wireless Communications and Networking
(iii) an easier and standardized way to compare results
from experiments realized in different WUSN
testbeds,
(iv) establishment of a standard methodology for WUSN
measurements.
The rest of this paper is organized as follows: In Section 2,
an overview of a WUSN testbed and its physical layout
are presented. In Section 3, diverse aspects to be controlled
in a WUSN experiment, such as the digging process, the
soil composition, the soil moisture, the antenna orientation,
and the transitional region are discussed. In Section 4,
detailed guidelines to preserve the quality and accuracy of
the experiments, even when sensor nodes are used as RF
measurement tools, are presented. The overall architecture
of a WUSN testbed and the aspects of its software are
provided in Section 5. The preparation for the experiments
and the results of an outdoor WUSN testbed are presented in
Section 6. Finally, the conclusions are discussed in Section 7.
2. WUSN Testbed Architecture
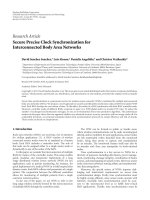
Three different communication links exist in WUSNs based
on the locations of the sender and receiver nodes, as shown
in Figure 1.
(i) Underground-to-underground (UG2UG) Link: the
communication occurs entirely using the soil
medium, as illustrated in Figure 1(a).
(ii) Underground-to-aboveground (UG2AG) Link: the
sender is a buried sensor node and the receiver is an
aboveground device, as illustrated in Figure 1(b).
(iii) Aboveground-to-underground (AG2UG) Link: the
sender is an aboveground device and the receiver is
a buried sensor node, as illustrated in Figure 1(c).
Accordingly, a WUSN testbed must support experiments
in these 3 communication scenarios. The testbed architecture
for UG2UG experiments is presented in Section 2.1.The
extension of the testbed to support aboveground nodes is
discussed in Section 2.2.
2.1. UG2UG Testbed. A WUSN testbed must allow an easy
configuration of the physical deployment aspects. As shown
in Figure 1, these deployment parameters reflect the location
of the sensor nodes. The parameter d
bg
, also called burial
depth, is defined as the distance between the center of
the antenna of the buried sensor node and the surface of
the soil. The distance above the ground d
ag
, used in the
UG2AG and AG2UG scenarios, is the distance between the
center of the antenna of the aboveground device and the
surface of soil. Finally, the parameter d
h
is the horizontal
internode distance between the sender and the receiver
nodes. Therefore, from the communication perspective, the
antenna is the element of interest. In fact, the actual locations
of the sensor, processor, and transceiver modules are not
considered in defining the physical distances of a WSUN
testbed experiment, only the antenna. However, preliminary
tests show that metallic objects nearby the antenna of a node
can significantly impact the results of WUSN experiments.
Therefore, the actual position of a node’s module, such as
a soil moisture sensor, may change the results, and this
scenario must be avoided or informed in the report of the
experiment.
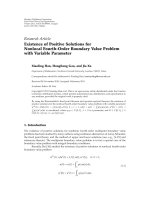
Figure 2 illustrates the grid concept applied in a WUSN
testbed mainly designed for UG2UG experiments. The
grid concept is very important in wireless communication
testbeds. The basic idea is to perform multiple simultane-
ous point-to-point (sender-receiver) tests, speeding up the
overall time spent in an experiment. As shown in Figure 2(a),
one of the sensors temporarily has the role of sender and it
broadcasts a sequence of test messages. Only one node can
be selected as a sender for each experiment. Therefore, the
remaining nodes in Figure 2(a) are potential receivers. After
the end of the test, it is possible to verify the results of the
experiments consulting each receiver individually.
However, the scheme in Figure 2(a) results in high
interference since a node may be on the direct path between
two other nodes as shown in Figure 2(b).Analternate
solution is to perform experiments individually as shown in
Figure 2(c), which eliminates any obstacles between sensor
nodes. Therefore, it is clear that the original grid idea must be
modified in underground settings to maintain the accuracy
of WUSN experiments and also to provide the flexibility
of having multiple simultaneous tests. A simple solution is
shown in Figure 2(d). This new scheme proposes a direct
line-of-sight (without obstacles) between the hole where
the sender is located and the holes where the receivers are
located. The difference is more clear when the top views of
Figure 2(a) and Figure 2(d) are compared. With this new
design, the grid imposes two constraints in the WUSN
testbed.
(i) Aholeisdesignatedonlyforthesenders:the hole,
which is used to place the sender node(s), that is, the
sender hole, must have direct line-of-sight with all
other holes. In other words, no other hole or obstacle
can exist between the sender holes and the other
holes. It is possible to have multiple senders in the
same sender hole. However, only one sender can be
active at a given moment.
(ii) At the senders hole, no receivers are allowed: if receivers
are placed at the same hole as the sender, one of them
can be a potential communication obstacle to the
other. For instance, if the nodes Sender A, Receiver
1, and Receiver 2 are buried, in this order, in the
same hole, the Receiver 1 will be an obstacle for the
propagation of waves from the Sender to the Receiver
2.
Based on the dimensions of the sensor nodes and the
communication constraints empirically verified in [4], the
physical layout for basic WUSN testbeds is illustrated in
Figure 3. The layouts are presented in a top view, where each
circle is a hole. The presented layouts consider the use of
10 cm-diameter holes and commodity WSN sensor nodes
with a maximum transmit power of +10 dBm. Naturally, the
EURASIP Journal on Wireless Communications and Networking 3
d
bg1
Sender
d
h
d
bg2
Receiver
(a)
d
bg
Sender
d
h
d
ag
Receiver
(b)
d
bg
Receiver
d
h
d
ag
Sender
(c)
Figure 1: The three communication scenarios supported by the WUSN testbed: (a) underground-to-underground (UG2UG), (b)
underground-to-aboveground (UG2AG), and (c) aboveground-to-underground (AG2UG) communication.
To p v i e w
(a)
To p v i e w
(b)
To p v i e w
(c)
To p v i e w
Burial depth
(d)
Figure 2: (a) The grid concept used to speed up the experiments in a WUSN testbed. (b) A case, where the grid can interfere with the results.
(c) Ideal case for experiments and (d) an alternate grid solution.
distances can be modified if larger and more powerful sensor
nodes are used. The first layout in Figure 3(a) is used for
internode distance experiments. The 5 holes in the center
are used by sender nodes and only one of these holes can
contain an active sender for an experiment. The horizontal
holes in Figure 3(a), with the exception of the central one,
are assigned for receiver nodes. Multiple receivers holes can
be active in an experiment. The holes at the right side
of the central node are used for redundant receivers. As
shown in Figure 3(a), the same internode distance is used
for the receivers A and A
, where the latter is used for
redundancy in experiments. After the end of the experiment,
the results of the receiver A are expected to be very close to
the measurements from the sensor A
, assuming they have
the same burial depth. As shown in Figure 3(a), this first
architecture provides:
(i) direct line-of-sight between sender and receiver with-
out any artificial obstacle,
(ii) simultaneous experiments for different internode
distances and, optionally, different burial depths,
(iii) high accuracy in the results through the redundancy
in the measurements.
The use of multiple nodes in the same hole, as suggested
in Figure 2(d), deserves special attention. In this case, the
testbed would be actually based on a 3D-grid which is
a natural option to speed up the experiments. However,
the placement of a sensor nearby the antenna of another
underground node can interfere with the experiment results.
Preliminary tests are necessary to verify if this interference
will potentially occur before deciding for the use of a 3D-grid
in the underground setting. In the experiments in [4], the use
of multiple nodes at the same hole was not possible due to the
interference issues. Therefore, in that case, every hole in the
layout contains only one sensor and the underground part of
the testbed was constrained to a 2D-grid.
It is possible to extend the testbed in Figure 3(a) to
support multiple senders at different holes. However, the
complexity of this new layout can be pretty high, and the
implementation of a unique and general purpose testbed can
be very difficult. One alternate solution is to create additional
testbeds for this kind of experiments. One example of
application of this new testbed is the transmission contention
experiments. In Figure 3(b), the layouts of the 4-sender and
8-sender cases are shown.
2.2. Testbed Extension: Above ground Nodes. UG2AG and
AG2UG links are required for several functionalities of
WUSNs, such as network management and data retrieval.
Therefore, the WUSN testbed must also provide support for
UG2AG and AG2UG experiments. As shown in Figure 3(a),
4 EURASIP Journal on Wireless Communications and Networking
Sender
Receiver (s)
Redundant receiver (s)
10 cm
15 cm
To p v i e w
A A
(a)
Sender (s)
Receiver
(b)
Figure 3: WUSN testbed layouts for UG2UG communication: (a) The layout used to investigate the effects of the internode distance and
(b) the layout used for transmission contention tests: 4 and 8-sender cases.
the UG2UG testbed has 5 special holes for sender nodes and
20 holes for receivers. Extending the WUSN to aboveground
experiments implies that the sender (or the receivers) will
be located above the soil surface. Accordingly, the grid
scheme can be adapted to this new scenario. The following
guidelines are provided for extending the WUSN testbed for
aboveground experiments.
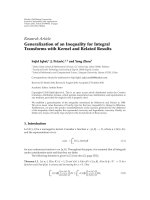
(i) The surface of the paper pipe must be aligned with
the soil surface, as shown in Figure 4(a).
(ii) The propagation of the antenna cannot be disturbed
by the paper pipes filled with soil (discussed in
Section 3.1), as shown in Figure 4(b). The mentioned
paper pipes can be used, but the antenna must be
positioned in a way that it points to the direction of
the aboveground device(s), as shown in Figure 4(a).
(iii) The hole must have a direct line-of-sight (without
obstacles) to the aboveground device(s), as shown in
Figure 4(c).
(iv) The aboveground nodes devices can be easily in-
stalled using a 10 cm-length buried 3/4
PVC pipe
in conjunction with a wood stake. It also possible
to build a grid of aboveground devices, as shown in
Figure 4(c).
All the devices and schemes presented in this section
speed up the realization of our experiments. Without these
schemes, the same experiments would last more than 3 times.
At the same time, the accuracy of these experiments is not
compromised.
3.FactorsThatImpactOutdoorWUSNTestbeds
In this section, the factors that impact the realization of
WUSN experiments are presented. The challenges of burying
and unburying sensor nodes are presented, and the use
of paper and plastic pipes is described in Section 3.1.The
analysis of the soil texture and soil moisture of the WUSN
testbed is included as an essential part of the results of
the experiments in Section 3.2. The errors caused by the
antenna orientation and the use of sensor nodes to make RF
measurements are discussed in Sections 3.3 and 3.4. Finally,
the issues related to the transitional region of WUSNs are
presented in Section 3.5.
(a)
(b) (c)
AG nodes
UG node
Figure 4: UG2AG and AG2UG experiments. (a) The antenna
must be positioned in the direction of the aboveground device
and without any obstacle. (b) Some aspects allowed for UG2UG
experiments are not allowed for aboveground experiments. (c) Grid
of aboveground nodes.
3.1. The Digging Process. Burying and unburying sensor
nodes are very time-consuming tasks in underground set-
tings. For instance, in our experimental testbed, almost 2
hours were necessary to dig a single 20 cm-diameter, 1m-
depth hole, even with the use of an electric power auger.
Therefore, an initial consideration about the dimensions of
the holes is necessary. Besides the time issue, the larger a hole
is, the larger is the modification of the soil density at that
area, and this parameter affects the signal attenuation caused
by the soil [4, 6]. A second aspect is related to the depth of the
hole. The majority of the WUSN applications will not require
burial depths higher than 1 m [1, 4, 5, 7]. Therefore, the
WSUN testbed considered in this section assumes a burial
depth smaller than 1 m. The process of digging deeper holes
is only feasible with special machines. On the other hand,
for shallow holes, there are many simple and manual digging
tools available in the market considering that the diameter of
EURASIP Journal on Wireless Communications and Networking 5
the hole is restricted to up 4 cm. In the case of our testbed, the
required minimum diameter is 7.5 cm due to the dimensions
of the sensor node. Therefore, 8 cm-diameter holes were dug
with power augers. The difficulty to bury a sensor node also
highlights an important aspect for the success of WUSN
applications: the deployment of hundreds or thousands of
these devices needs to be relatively simple. In this sense,
sensor nodes with cylindrical form and a tiny diameter (2.5
to 4 cm) are required.
Besides the difficulty and the time spent in the process
of burying and unburying sensor nodes, the repetition of
an experiment is also a challenge. To place a sensor node
and its antenna at the same place and orientation in a
deeper hole is not an easy task. This issue is aggravated
with the use of small holes, such as a 10 cm-diameter hole.
To address these challenges, the use of paper and plastic
(PVC) pipes is required. In our testbed, preliminary tests
using Mica2 [8] motes at 433 MHz are realized to verify how
the adoption of paper and plastic pipes would interfere in
the results of the experiments [4]. The comparison between
the results, with and without paper and plastic pipes, shows
an additional attenuation ranging from 2 to 8 dB. These
values correspond, respectively, to the use of paper pipes and
different thicknesses of plastic pipes. These values are still
considered small in comparison with the value of the soil
attenuation which typically varies from 20 to 50 dB [4]. To
obtain a smaller attenuation value due to the introduction of
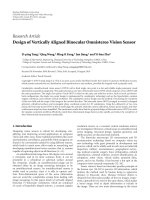
the plastic pipe, smaller thicknesses can be used. In Figure 5,
the use of a paper pipe,madewitha55
×70 cm poster board,
is illustrated. In this case, the variation caused by the paper
pipe is smaller than 1.5 dB.
The paper/plastic pipe helps to preserve the physical
structure of the hole for multiple experiments. However,
to perform the experiments, the sensor should also be
covered with soil. Therefore, the reuse of a hole for multiple
experiments is still a problem. A possible solution for this
issue is the use of paper pipes filled with soil. In our testbed,
additional 7.5 cm-diameter paper pipes are used for this
purpose. These new paper pipes contain the same soil which
is taken out from the digging process. These pipes, with
both ends sealed, can have different lengths, helping to make
experiments for different burial depths.
3.2. Soil Texture and Soil Moisture. The characteristics of the
soil have a strong influence on the signal attenuation [1, 4–
7]. As a consequence, WUSN experiments realized without
the characterization of the soil are incomplete. In parallel
with the preparation of the testbed, soil samples must be
collected and sent to a specialized laboratory for soil analysis.
The soil texture analysis provided by the laboratory presents
very important parameters to be added in all results from
the testbed. In Tabl e 1, the soil analysis from our testbed
performed by a specialized laboratory [9] is presented as an
example.
Besides the soil texture, the water content (WC), or soil
moisture, is other parameter to be included in every WUSN
experiment report. However, differently from the soil texture,
which is very stable for the same site, the WC is dynamic and
depends on the environment and the weather. Moreover, the
WC also varies as a function of the burial depth [3, 10]. These
facts are important because the WC can significantly modify
the results of an experiment, as suggested in [3–5, 7].
There are two basic methods to measure the amount of
water in the soil: soil water content and soil water potential
measurements [10]. The soil water potential measurement,
expressed in bars units, is related to the energy status of the
soil water. Tensiometer and electrical resistance sensors are
some examples of soil sensors that can be used to gather
water potential measurements. This method provides a more
realistic measurement of the actual plant water stress and,
therefore, has a significant value for irrigation purposes. On
the other hand, the soil water content measurement provides
an effective measurement of the portion of water in the soil
sample. This aspect has a direct relation with the dielectric
properties of the soil [6] and, consequently, impacts the
underground wireless communication behavior [3–5, 7].
Thesoilwatercontent(WC)canbeexpressedintwo
forms: gravimetric water content (GWC) and volumetric
water content (VWC). A method called oven drying method
is usually used to calculate the GWC [10]. This method
consists of separating and weighing a sample of the soil.
Then,thissoilsampleiscompletelydriedinanovenandit
is weighed again. The difference in the weights divided by
first measurement represents the VWC in the soil sample,
a number varying from 0 to 1. Having the GWC value, the
VWC can be obtained by [10]
VWC
=
GWC ∗ρ
soil
ρ
water
,
(1)
ρ
soil
=
m
soil
V
soil
,
(2)
where VWC and GWC are the volumetric water content and
gravimetric water content of the soil sample, respectively, ρ
soil
is the soil density in g/cm
3
, ρ
water
is the water density (1 g/cm
3
at 4
◦
C), m
soil
is the mass of the soil sample in g, and V
soil
is
the volume of the soil sample in cm
3
.
Despite its simplicity, the direct evaluation of the VWC
using the gravimetric method is not practical for the WUSN
testbed for three reasons. First, the gravimetric method
implies that a soil sample must be regularly removed from
the testbed and this continuous process is time-consuming
and destructive. Second, the conversion of GWC to VWC
given by (1) depends on the bulk soil density parameter. This
density changes for different burial depths and its measure-
ment requires additional attention [10]. As a result, the good
accuracy of the GWC measurement can be compromised
in the VWC conversion. Finally, it is not possible to have a
significant number of measurements of the VWC on a long-
term experiment. For instance, if we would like to analyze
the effects of the rainfall over the WUSN communication,
the presence of a person continuously taking soil samples
would be required. Instead, the use of soil moisture sensors
that can dynamically take VWC measurements is required
in the testbed. Some examples of these sensors are the
time domain reflectometer (TDR) and capacitance-based
devices [10]. Recent work in WUSN shows the successful
6 EURASIP Journal on Wireless Communications and Networking
(a) (b)
Figure 5: (a) The structure and installation of paper pipes. (b) Use of paper pipes in 10 cm-diameter and 90 cm-depth holes for a temporary
WUSN testbed.
Table 1: Example of a soil analysis report.
Depth Organic matter Texture %Sand %Silt %Clay
0–15 cm 6.4 Loam 27 45 28
15–30 cm 2.6 Clay Loam 31 40 29
30–45 cm 1.5 Clay Loam 35 35 30
use a capacitance-based sensor, ECH
2
OEC-5[11] sensor
[3, 12, 13], for water content measurements.
TheWCmeasurementsmustbecollectedfrequently
to confirm that the same WC value is present during the
experiments. This is specially recommended when a set
of experiments is partitioned into many different sessions
and distinct days. This continuous need of taking WC
measurements during a set of experiments is another
reason for the use of soil moisture sensors as part of
the testbed infrastructure. The soil texture and the WC
must be informed together in the experiments reports.
The comparisons between experiments realized in different
testbeds are only feasible including with these parameters in
the analysis.
3.3. Antenna Orientation. Usually, the antenna orientation
is not a very critical factor for over-the-air wireless com-
munication experiments. However, considering the extreme
attenuation due to the soil propagation, the antenna orien-
tation is an additional constraint to be considered in the
deployment of WUSNs, specially for multihop underground
networks, where the communication range varies based on
the antenna orientation. Accordingly, the experiments in a
WUSN testbed can be easily compromised if the antenna
orientation is not carefully adjusted.
To illustrate the impacts of antenna orientation, experi-
ments are performed by placing a sender and a receiver, both
Mica2 motes [8], at different angles as shown in Figure 6(a)
[4]. The vertical polarization of the antennas is specifically
adopted because preliminary tests proved that it provided
the best results for our WUSN testbed environment; however
the explanation in this section also applies to other types of
antenna polarization.
The original antenna of a Mica2 mote is a standard one-
quarter wavelength monopole antenna with 17 cm-length.
It is well known that this type of antenna does not exhibit
a perfect omni-directional radiation pattern. Therefore, it
is expected that changes in the antenna orientation cause
variations on the signal strength of the receiver node. These
variations are specially significant when the underground
scenario is considered. The experiments are performed
at a transitional region (defined in Section 3.5), that is,
nearby the boundaries of the underground communication
range.
In Figure 6(b), the packet error rate (PER) is shown
as a function of the node orientation. When the relative
angle varies from 90
◦
to 340
◦
, the PER increases and the
orientation of a node has a significant impact on the
communication success. When the antenna orientation is
between 120
◦
and 300
◦
, the communication between the
nodes is not possible.
To avoid the interference of the antenna orientation over
the experiments results, it is important to choose a unique
antenna orientation for all experiments in a WUSN testbed.
In our experiments, only the 0
◦
orientation (Figure 6(a))
is used in order to eliminate the effects of the antenna
orientation. Naturally, for every combination of sensor node
type and its antenna, different antenna polarizations and
orientations can be adopted as the default configuration for
all experiments. Accordingly, an experiment similar to the
one shown in Figure 6 must be performed to maintain the
accuracy of the results and also to provide the recommenda-
tion of the best configuration for the sensor deployment.
EURASIP Journal on Wireless Communications and Networking 7
0
◦
45
◦
90
◦
115
◦
180
◦
340
◦
360
◦
(a) Relative angles for the antenna
0
0.1
0.2
0.3
0.4
0.5
0.6
0.7
0.8
0.9
1
Packet error rate
0 30 60 90 120 150 180 210 240 270 300 330 360
Relative angle of the receiver relative to the sender
(b) PER versus relative angle for the antenna
Figure 6: The scheme used to test the effects of the antenna orientation in the wireless underground communication [4].
3.4. Misalignment of RF Measurements. In an ideal wireless
testbed, the best accurate tools are selected to be used as
the instrumentation for the RF measurements. However,
this is not usually the case for WUSN testbeds for two
reasons. First, it is a common approach in WUSNs to
use the sensor nodes to cooperate and provide the most
reliable and efficient communication solution. Therefore,
sensor nodes are expected to be also used as network
instrumentation. Second, if a special and more accurate
instrument, such as a spectrum analyzer, is used at the
receiver side of the experiment, the grid idea cannot be
applied and multiple tests must be performed one-by-one.
The natural consequence is the increase of the time to
conclude the experiments.
The grid-based testbed layout involves the measurements
from many sensor nodes. Therefore, it is expected that
differences between the RF measurements from different
sensor nodes cause significant accuracy issues. In the context
of a WSUN testbed, we refer to this issue as misalignment
problem. A node is defined to be aligned with a given set of
nodes if
(i) its PER varies at most 10% from the average PER
calculated for the set of nodes,
(ii) its RSSI average varies at most +/
−1 dB from the
average RSSI for the set of nodes.
Usually, the nodes present different receiver sensitivities
[8]. This fact can cause the mentioned misalignment prob-
lem and the accuracy of the experiments can be compro-
mised. Considering this, a balanced approach adopted in
a WUSN testbed is to continue using the sensor nodes as
part of the RF instrumentation, but selecting only a subset
of the nodes. The selected nodes for an experiment are the
ones previously qualified to perform the RSS measurements.
Therefore, before using the sensor nodes for the WUSN
experiments, they are tested in typical WSN scenarios,
using over-the-air tests, in a process called qualification
test. The reason for this test is explained by the following
example.
Suppose that we want to test 3 receiver nodes, all placed
in the same hole at different burial depths. The results
from this experiment can only be validated if these nodes
present similar RSS measurements for an over-the-air test,
using the same internode distance. If this is the case, the
distinct underground measurements provided by the nodes
at different burial depths are actually related to the burial
depth effects and not a difference caused by their receiver
sensitivities.
As an example of a qualification test, one sensor node
is assigned with the role of broadcasting (over the air)
a total of 200 packets, 30 bytes each, to a set of nodes
located in the same physical position and exactly with the
same antenna orientation. The transmit power used by the
sender node must be small in order to allow the RSS/PER
comparison at critical conditions. Usually, we use
−10 dBm
as the transmit power of the sender and 5 m as the internode
distance between the sender and the set of nodes under
qualification process. After the test, the results are collected
from each node and only the subset of nodes that have similar
PER and average RSSI, as previously defined, are selected
to participate in the experiment. However, as expected, this
kind of approach has at least two drawbacks. First, the
process is very time-consuming and must be repeated every
new day/session of experiments. Second, usually it is not
possible to use all the available nodes for the experiment,
which means that the grid is constrained by the number
of qualified nodes. For instance, in our experiments, using
Mica2 motes, generally only 50% of the available nodes
were qualified for each day of experiments. Surprisingly,
the qualified nodes are not always the same nodes. The use
of sensor nodes as instrumentation for RF measurements
requires a huge effort in order to maintain the accuracy of
the results. Also, the total number of nodes to be available
8 EURASIP Journal on Wireless Communications and Networking
for a WUSN testbed is significantly higher than the actual
number of nodes used in the experiments.
3.5. Transitional Region of WUSNs. It is well known that
in traditional wireless communication (air channel), there
is a region where the reliability of the signal varies, until
the point where the communication ceases. It was reported
that this issue is highly accentuated in WSNs and this
critical region is called the transitional region [14]. However,
results from preliminary UG2UG experiments show that the
underground transitional region is significantly smaller than
its air channel counterpart [4]. As already commented, the
main problem with wireless underground communication is
the very high signal attenuation caused by the soil [1, 4, 5, 7].
At the same time, usually sensor nodes present low power
RF transceivers. The combination of these factors results in a
very small width of the transitional region. This fact causes
problems in realizing WUSN experiments and it is one of the
main reasons for the small number of experiments in this
area.
The identification of the transitional region in a WUSN
environment, which defines the limits of the communication
range, is tied to the burial depth of the nodes, the soil
texture, and the WC. For instance, in some of our UG2UG
experiments, the transitional region presented a width of
less than 15% of the maximum internode distance. More
specifically, with a maximum internode distance of 100 cm
and a transmit power of +5 dBm, the transitional region
is located between 85 cm and 95 cm [4]. As expected, such
small distance is very critical: an imperceptible slight move-
ment in one direction, when burying the node, causes the
change from a good communication region to a transitional
region. Therefore, if the tests are being realized very close to
the transitional region, a careless manipulation of the sensors
can cause significant interferences in the results.
Considering all the presented facts, the recommendation
is to limit all the experiments to a secure region which
is not the transitional region. Restricting the experiments
in a secure region is a way to preserve the quality and
accuracy of the WUSN experiments. For instance, if WC
experiments are realized in the transitional region, it will not
be clear if the RSS and PER results uniquely reflect the WC
effects or if the results are also affected by the instabilities
of the transitional region. On the other hand, for instance,
experiments realized at 50% of the maximum internode
distance present very stable results and the repeatability and
comparisons between experiments are feasible in this secure
region [4]. Naturally, the exception for this guideline is when
the maximum internode distance and the transitional region
are the aspects under investigation in the experiments.
Many aspects or variables that can potentially interfere
with the quality of the WUSN experiments are considered
in this section. Guidelines are provided to minimize the
issues or completely eliminate the interference of one or
multiple variables. The qualification phase is particularly
very important due to the well known differences in the
transceiver performances of low-cost sensor nodes. However,
even with a qualified set of nodes, the interpretation of the
results can still be affected by the way the RF measurements
are realized. Guidelines to realize such measurements are
provided in the next section.
4. Standardized RF Measurements
A WUSN testbed is generally used to provide the infrastruc-
ture necessary for the realization of comparisons between
experimental results and the predictions made by theoretical
models. However, it has been reported that sensor nodes
are being used to make RF measurements, usually the RSS
[14]. This is usually necessary and desirable because many
communication protocols take advantage of the use of the
sensor node as an RF measurement tool to make decisions
related to multihop schemes, topology, localization, and
so forth. However, it is possible to identify some issues
related to the use of sensor nodes for such measurements. In
Section 4.1, a methodology to avoid the issues caused by the
limitations of the sensor node receiver circuitry is presented.
In Section 4.2, guidelines to correctly estimate the path loss
exponent are provided.
4.1. Clipping Effect. Wireless communication channel mod-
els usually use empirically determined parameters, such as
path loss exponent (PLE). In a WUSN testbed scenario,
the sensor nodes can be used to take RF measurements
for the estimation of such parameters. However, these
measurements can introduce distortions in the results. The
following case involving Mica2 motes was observed in our
experiments and illustrates the problem.
Based on the well known Friis free space propagation
model [15], it is expected that an increase in the intern-
ode distance between sender and receiver corresponds to
a decrease in the received signal strength. This scenario
is illustrated in Figure 7(a), where RSS are reported for
different distances between the sender and the receivers.
However, when the transmit power level of the sender node
increases from +5 dBm to +10 dBm, the RSS measurements
do not match the 5 dB increase, as illustrated in Figure 7(b).
We refer to this issue as the clipping effect. Consequently, the
clipping effect creates distortions in the PLE estimation. The
PLE expresses the rate at which the signal power decays as a
function of the distance [15] and it is an important input
parameter in many WSN/WUSN communication models
[14]. This parameter is usually calculated based on many
RSS measurements performed by the sensor nodes. If the
PLE estimation is not accurate, there will be distortions
between the estimations of the communication model and
the experimental data provided by the testbed.
The clipping effect is caused by the limitations of the
receiver circuitry of the sensor node. In Figure 8, a typical
RF circuitry of a sensor node is shown. If a strong signal is
received above a certain limit specified by the manufacturer
of the sensor, a limite r circuit will operate and a maximum
RSS will be informed as the RSSI level. Accordingly, different
signal levels will correspond to the same informed RSSI and
this is the clipping effect.
The clipping effect is challenging because it depends
specifically on the hardware. Moreover, the nominal value of
EURASIP Journal on Wireless Communications and Networking 9
Sensor measurements:
Correct measurements:
−54 dBm −56 dBm −58 dBm −60dBm
−54 dBm −56 dBm −58 dBm −60dBm
Sender (transmit power: +5 dBm)
Receiver
(a) Transmit power level = +5 dBm
Sensor measurements:
Correct measurements:
−52 dBm −52 dBm −53 dBm −55dBm
−49 dBm −51 dBm −53 dBm −55 dBm
Sender (transmit power: +10 dBm)
Receiver
(b) Transmit power level = +10 dBm
Figure 7: (a) Normal measurements. (b) The clipping effect.
LNA
RSS
Receiver
RSSI
RSSI
Mixer
RF IN
IF stage Demod
LNA: low-noise amplifier
IF: intermediate frequency
Figure 8: Typical receiver circuitry of a sensor node.
the maximum RSS informed by the manufacturer may also
vary as mentioned in Section 3.4. The consequences of the
clipping effect on a WSN/WUSN testbed are as follows.
(i) Incorrect interpretation of the testbed data. The com-
munication model can predict a RSS value and the
experimental data can show a smaller result. If this
smaller value is exactly the maximum nominal RSSI
of the receiver, probably this is not a model mismatch.
(ii) Inaccuracy in the model prediction. If the communi-
cation model is using the testbed to obtain certain
empirical parameters, such as PLE, the results of the
model will be negatively affected by these incorrect
measurements.
Although the first mentioned consequence is not critical
because it is only related to the way the experimental data
from the testbed is analyzed, the second consequence must be
avoided or solved. Therefore, in the case of PLE estimation,
only combinations of transmit power levels and internode
distances that are clearly not affected by the clipping effect
can be used. This guideline is specially important when
defining the reference distance for PLE measurements [15].
In the next section, guidelines to calculate PLE is presented
with a methodology to choose the appropriate reference
distance to avoid the mentioned clipping effect.
4.2. Path Loss Exponent Estimation Using Sensor Nodes. The
PLE is an essential input parameter in wireless communica-
tion models. In this section, a methodology is presented to
estimate the PLE using sensor nodes in a WUSN testbed.
Select the refe rence distance d
0
. The typical approach
to determine the received power from the receiver node’s
perspective, located a distance d from the sender node, is
the use of the well known Friis equation related to the free
space propagation model. However, the application of this
equation assumes the availability of detailed information
about the antennas gain/losses, the overall losses due to
transmission line attenuation, filter losses, and so forth,
Another more practical approach to predict the received
power at a given distance d from the sender is the use of
direct measurements in the radio environment [15]. For this
approach, a reference distance d
0
from the sender node is
chosen. This distance d
0
must be determined considering two
simultaneous constraints
(i) d
0
must lie in the far-field (Fraunhofer) region. The far-
field region is defined as the region beyond the far-
field distance d
f
which is defined by [15]
d
f
=
2D
2
λ
,(3)
where D is the largest physical linear dimension of
the antenna and λ is the wavelength of the RF wave in
meters. For instance, for the Mica2 node operating at
433 MHz, D is approximately 0.17 m and, therefore,
d
f
is 8.3 cm. In this case, d
0
must be greater than
8.3 cm.
(i) d
0
must be smaller than any distance d us ed in the
deployment of the nodes (d
0
<d). For instance, for the
over-the-air path of the UG2AG/AG2UG links using
Mica2, it is usual to consider d
0
= 1 m because the
minimum internode distance between the sensors is
typically higher than 1 m.
After selecting a value for the reference distance d
0
, the
next step is to setup the sender at its minimum transmit
power and collect the RSS measurements at the receiver.
10 EURASIP Journal on Wireless Communications and Networking
An additional RSS measurement is taken considering at this
time the maximum transmit power. The difference between
both measurements must be approximately the nominal
difference between the maximum and minimum transmit
power levels used. If this goal is not achieved, a higher value
for d
0
must be chosen and the above tests must be repeated.
In the experiments reported in Section 6, the distance d
0
is
10 m. Any RSS measurement for internodes distances smaller
than 10 m will have an error due to the nature of the RF
instrumentation used (the sensor node itself). However, if a
spectrum analyzer is used, the reference distance d
0
= 1m
could be adopted without any loss of accuracy. Naturally, the
value for d
0
will vary for different models of sensor nodes and
their antennas. Moreover, the use of multiple receivers will
improve the quality of the results in the procedures described
in this section.
Take RSS measurements for distances d>d
0
. Configure
the maximum transmit power level at the sender and take
many RSS measurements for internode distances higher than
d
0
. For our experiments with Mica2 motes, using +10 dBm
for the transmit power, two additional distances are used for
the RSS measurements: d
1
= 15 m and d
2
= 20 m.
Apply a linear regression technique to estimate PLE (η).
Using the following equation and applying Minimum Mean
Square Error (MMSE) technique [15], it is possible to
estimate PLE (η) to be used by the wireless communication
model:
p
i
= p
(
d
0
)
−10η log
10
(
d
i
/d
0
)
,
(4)
where
p
i
is the measured RSS for each measurement instance
i.
Even if the PLE is not expected to be used, the approach
observed in the presented methodology represents the set of
best practices for RF measurements using sensor nodes in
generic WSNs. In this way, any parameter to be used in a
communication model which is based on RSS measurements
of sensor nodes must follow a similar approach aiming the
accuracy of the investigated model. The guidelines presented
in this section can be applied to any WSN experiment. In fact,
their relevance with this work is mostly related to the air path
of the UG2AG and AG2UG experiments.
5. WUSN Testbed Software Architecture
A simple and effective software architecture to be used in
WUSN testbeds is presented in this section. The software
architecture is illustrated in Figure 9. One node, called
manager, sends the configuration data for the experiment
to a node called the sender. The configuration data must
include the following parameters: transmit power level, delay
between the messages, size of each message, and the total
number of messages for the experiment. In the Figure 10,
a screenshot of our WUSN testbed software running in a
laptop is shown.
After receiving the configuration data from the manager,
the sender broadcasts the messages. After the broadcasting
period, the sender informs the manager node, via radio
channel, that it finished this phase. At this moment, the
operator of the experiment can request the results from
each receiver node via radio channel. It is also possible to
select multiple senders to start a transmission contention
experiment.
The software in the manager node stores the configura-
tion data for a given experiment, the manual annotations
from the operator for that experiment, and the results from
each receiver in a local file. If a receiver node receives a
request for the results of an experiment but it did not have
anything in its buffer, it returns a message to the manager
informing no results, that is, packet error rate (PER)
= 100%.
After sending the results to the manager, the receiver erases
its buffer. Also, if the receiver receives messages from a
new experiment, it automatically erases the previous results
whichwerenotrequestedbythemanager.
For the realization of long-term experiments, that is,
experiments that are extended for a longer period of time,
such as 24 hours, some modifications in the previous archi-
tectural scheme are necessary. First, the operator configures
the experiment informing its long-term feature. Then, a
special message is sent from the manager to the sender
node. This special message informs the sender that it must
broadcast messages with a higher interval, for example,
every minute. The message broadcasted by the sender to the
receivers also has the information regarding the long-term
experiment. Accordingly, the receivers will store the results
into their Flash memories due to the fact that the RAM
memory is not usually large enough to buffer all the results.
Finally, the process of capturing the results must also be
modified for the long-term experiments. If the radio channel
is used for the transfer of long-term results, the process could
take hours to finish. The solution is to have each receiver
directly connected to the computer acting as the manager,
when the dump of the experiment results is started. In fact,
this is the only situation where a cable (usually USB or serial)
is necessary in the WUSN testbed.
Each broadcasted message in a given experiment has a
sequence number. When the receiver receives that message,
it saves in its buffer a summary of the message: its sequence
number and the RSSI level related to the reception of the
message. The RSSI information is provided by the transceiver
of the sensor node as previously discussed in Section 4.
Therefore, the summary of the message has exactly the same
size in the receiver’s buffer irrespective of the size of the
message. The sequential numbers are used to identify if the
loss of packets occur. Therefore, this observation can help
to identify if the experiment suffered interference during
its realization. If this is the case, the experiment can be
promptly repeated or the source of interference can be
identified.
6. Experiment Setup and Results
In this section, the details of the experiment preparation
phase are presented. Also, the results of WUSN experiments,
which are performed according to the proposed WUSN
EURASIP Journal on Wireless Communications and Networking 11
Manager
Config
data
Sender
Receivers
(a)
Messages
broadcast
Sender
(b)
End of
test
(c)
Request A
A
B
(d)
Results
from A
A
B
(e)
Figure 9: Software architecture of the WUSN testbed. (a) The manager sends the configuration to the sender. (b) The sender starts the
experiment and (c) informs the conclusion. (d), (e) The manager captures the results.
Figure 10: A screenshot of the WUSN testbed software running in
alaptop.
testbed and guidelines, are presented. Related to the prepa-
ration of a WUSN experiment, the following aspects must be
known a priori.
(i) Soil texture. This evaluation is realized once, for a
given testbed location. The soil texture report must
be done for different depths, as shown in Ta bl e 1.
(ii) Water content (WC). This evaluation must be fre-
quently performed as mentioned in Section 3.2.
Moreover, it is very important to know the values of
WC for different burial depths of the sensors to be
tested.
(iii) Attenuation due to the use of paper/plastic pipes. This
evaluation is realized once, when the WUSN testbed
is being built. The fixed average RSS difference
between the results with and without the pipes
are recorded. If they cannot be neglected, all the
RSS results from the experiments must be adjusted
accordingly.
(iv) Default antenna orientation. This evaluation is real-
ized once, for a given model of sensor node and
its antenna. As mentioned in Section 3.3, the best
antenna orientation are found and fixed for all
experiments with that sensor.
(v) Transitional region. The range of this value will
change as a function of the soil composition, WC,
frequency, and transmit power. It is necessary to
know, a priori, the different values for this region
according to the mentioned parameters. Therefore,
experiments in the transitional region must be
avoided when trying to analyze a specific aspect of the
WUSN communication, as explained in Section 3.5.
The first step in the preparation for a WUSN experiment
is the qualification test, exemplified in Section 3.4.After
having the set of nodes to be used, the next step is the
assignment of the roles for the sensor nodes. Considering
that the manager node does not interfere on the results
because it only triggers the start of the experiments and
captures the results, the manager node can be elected
randomly from the set of available nodes and there is no
need to change its role. The node presenting smaller variance
in its qualifying results must be selected as the sender. The
same sender node can be used for all experiments in a
single session. However, the use of the same sender node for
different experiments sessions, for example, different days,
is not recommended. As expected, the remaining qualified
nodes can act as receivers. After the preparation phase, the
WUSN experiments can be performed.
The rest of this section is composed of the presentation
and the analysis of the results of WUSN experiments. These
results are presented as examples of the successful use of
the WUSN testbed and its related guidelines. For more
detailed analysis of the results, the reader is referred to [4].
An analysis of the soil texture of the testbed environment
was made by a specialized laboratory [9] and the results
are shown in Ta ble 1 . The experimental results are divided
into five classes: UG2UG, UG2AG, AG2UG, WC effects, and
long-term (24 hours) experiments. All the experiments were
realized with a 40 cm burial depth. The results of the first
3 classes of experiments are shown in Figure 11 and the
Ta bl e 2 complements the results. In this table, the maximum
internode distances for a PER smaller than 30% are shown.
12 EURASIP Journal on Wireless Communications and Networking
−110
−100
−90
−80
−70
−60
−50
Received signal strength (dBm)
10 20 30 40 50 60 70 80 90 100
Horizontal inter-node distance (cm)
TX power +10 dBm
TX power +5 dBm
TX power 0 dBm
TX power
−3dBm
(a) Underground-to-underground (UG2UG) experiment [4]. Burial
depths of the sender and the receiver: d
bg
= 40 cm.
−90
−85
−80
−75
−70
−65
−60
−55
−50
Received signal strength (dBm)
0
(40)
50
(64)
100
(108)
150
(155)
200
(204)
250
(253)
300
(303)
Horizontal inter-node distance/(actual distance) (cm)
TX power +10 dBm
TX power +5 dBm
TX power 0 dBm
TX power
−3dBm
(b) Underground-to-aboveground (UG2AG) experiment. Burial depth
of the sender: d
bg
= 40 cm. Receiver’s height: d
ag
= 0.
−107
−102
−97
−92
Received signal strength (dBm)
10
(41)
20
(45)
30
(50)
40
(57)
50
(64)
60
(72)
70
(81)
80
(89)
90
(98)
100
(108)
Horizontal inter-node distance/(actual distance) (cm)
TX power +10 dBm
TX power +5 dBm
TX power 0 dBm
TX power
−3dBm
(c) Aboveground-to-underground (AG2UG) experiment. Burial depth of
the receiver: d
bg
= 40 cm. Sender’s height: d
ag
= 0.
Figure 11: WUSN testbed results with commodity WSN sensor nodes. RSS versus horizontal internode distance d
h
.
The results of the last 2 classes of experiments are shown in
Figure 12.
In Figure 11(a), the results of UG2UG experiments are
presented [4]. For this experiment and the next 2, the RSS
values are shown as a function of the horizontal internode
distance for different transmit power levels. The variance
of the RSS values is also provided. The clipping effect
mentioned in Section 4 is observed in Figure 11(a).Fora
transmit power of +10 dBm, the RSS reported is the same
as the maximum RSS informed by the manufacturer of the
Mica2 mote [8]. As shown in Figure 11(a) and in Tab le 2 , the
maximum internode distance is found around 80 and 90 cm
for transmit powers of +5 and +10 dBm, and 50 cm for
−3
and 0 dBm. These results show that the transitional region,
discussed in Section 3.5, is also a function of the transmit
power of the sender.
In Figure 11(b), the results of UG2AG experiments
are shown. The receiver is positioned at the soil surface
(d
r
ag
= 0). As shown in Figure 11(b) and in Tab le 2 , the
maximum internode distance is found to be between 2 and
EURASIP Journal on Wireless Communications and Networking 13
−80
−75
−70
−65
−60
−55
−50
Received signal strength (dBm)
−3dBm 0dBm 5dBm 10dBm
Tr an smi t p ow er l eve l
Dry soil (GWC
= 11%)
Wet soil (GWC
= 18%)
(a) Effects of soil moisture over underground communication [4]. Burial
depths of the sender and the receiver: d
bg
= 40 cm. Internode distance: d
h
=
30 cm.
−70
−68
−66
−64
−62
−60
−58
−56
−54
Received signal strength (dBm)
6:00 9:00 12:00 15:00 18:00 21:00 0:00 3:00 6:00
From 4- Nov-08 6 AM to 5-Nov-08 6 AM
Underground communication
Over-the-air communication
(b) Wireless underground communication channel: high stability [4].
Burial depths of the sender and the receiver: d
bg
= 40 cm. Internode
distance: d
h
= 50cm.Transmitpower:+10dBm.
Figure 12: WUSN testbed results (UG2UG) with commodity WSN sensor nodes. RSS for dry and wet soil scenarios. Comparison between
underground and over-the-air wireless communication.
Table 2: Maximum internode distance for PER < 30%.
−3 dBm 0dBm +5 dBm +10 dBm
UG2UG 55cm 55cm 85cm 95cm
UG2AG 200 cm 200 cm 250cm 300 cm
AG2UG 15cm 25cm 55cm 85cm
3 m, depending on the transmit power level. The results
from AG2UG experiments are shown in Figure 11(c).The
sender is positioned at the soil surface (d
s
ag
= 0). As shown
in Figure 11(c) and in Ta ble 2 , the maximum internode
distance is found to be between 10 and 90 cm, depending
on the transmit power level. These results are in accordance
with the extreme attenuation suffered by the signal as shown
in Figure 11(c) and due to the fact that the sensitivity of the
Mica2 mote is around
−95 dBm [8]. Since these experiments
are realized in the transitional region, the realization of them
are challenging. The use of redundant nodes, as shown in
Figure 2, is specially recommended in this kind of scenario.
In Figure 12(a), the effects of the soil moisture on the
underground communication can be observed. The RSS
values are shown as a function of the transmit power level
for two soil conditions: dry (GWC
= 11%) and wet (GWC
= 18%). The GWC measurements followed the guidelines
explained in Section 3.2. The horizontal internode distance is
30 cm and the nodes are buried at a depth of 40 cm, which is
the default burial depth for all experiments mentioned here.
The PER is below 10% in all cases. As shown in Figure 12(a),
for a transmit power of
−3 dBm, the additional attenuation
caused by the higher WC is almost 20 dB. Using a higher
transmit power, it is possible to cancel the adverse effects
of the WC. Applying these results to the WUSN testbed, it
is clear that even small variations of WC can significantly
alter the results of the experiments. Therefore, a careful
and continuous control of the WC in a WUSN testbed is
essential.
In the last experiment, the temporal characteristics of the
wireless underground channel are investigated. Accordingly,
a 24-hour experiment is performed with the following
parameters: the horizontal internode distance is 50 cm and
the transmit power is +10 dBm. For comparison, the same
experiment is repeated over-the-air in an indoor environ-
ment with an internode distance of 5 m and a transmit
power of +10 dBm. In Figure 12(b), the RSS values are
shown as a function of time. The PER values are omitted
because they are extremely low, never higher than 0.5%
[4]. Each data point shows the average of 30 minutes of
RSS information, which corresponds to 150 packets. In
Figure 12(b), the confidence intervals of the RSS are also
shown along with the average values for each point as well
as the results of the over-the-air experiments. As shown in
Figure 12(b), the maximum variation of the signal strength is
around 1 dB. Compared to the over-the-air communication,
underground wireless channel exhibits a stable characteristic
with time. To perform this kind of long-term experiment, a
special attention to the battery level is necessary. We used
special battery packs for both sender and receiver nodes to
prevent errors caused by the battery level. Also, observe that
the experiment is located in a secure region (Section 3.5),
14 EURASIP Journal on Wireless Communications and Networking
allowing a clear analysis of the wireless underground channel
stability under normal conditions.
7. Conclusions
The development of an outdoor WUSN testbed and the
realization of WUSN experiments are challenging. This work
provides a set of guidelines that result in a balanced approach
between high accuracy and a practical implementation of
a WUSN testbed. The basic approach behind the proposed
guidelines is the identification and elimination/mitigation
of each variable which significantly affects the experiment
results.
A WUSN testbed architecture is presented and aspects
such as physical layout and software are discussed. The
use of paper and plastic pipes are considered in detail,
explaining the advantages of these devices in the process of
burying and unburying sensor nodes. The influences of the
antenna orientation and the soil moisture are highlighted.
The importance of the qualification tests and procedures to
identify the transitional region in a WUSN are discussed.
Finally, results from experiments with the WUSN testbed are
provided. The analysis of the results exemplifies the relation
between the application of the guidelines proposed in this
work with the accuracy of the results.
The ultimate goal of this work is to contribute to the
efforts in modeling the wireless underground communica-
tion completely and developing simulation environments. To
achieve this objective, an accurate outdoor WUSN testbed is
essential for the evaluation of the theoretical communication
models for WUSNs.
Acknowledgments
The authors would like to thank Dr. Suat Irmak for his
valuable comments throughout the development of the
WUSN testbed at Clay Center, NE and Emily Casper and
the UNL Landscaping Services staff for their valuable help
during the experiments at City Campus.
References
[1] I. F. Akyildiz and E. P. Stuntebeck, “Wireless underground
sensor networks: research challenges,” Ad Hoc Networks, vol.
4, no. 6, pp. 669–686, 2006.
[2] H. R. Bogena, J. A. Huisman, H. Meier, U. Rosenbaum, and
A. Weuthen, “Hybrid wireless underground sensor networks:
quantification of signal attenuation in soil,” Vadose Zone
Journal, vol. 8, no. 3, pp. 755–761, 2009.
[3] J. Tiusanen, “Wireless soil scout prototype radio signal
reception compared to the attenuation model,” Precision
Agriculture, vol. 10, no. 5, pp. 372–381, 2009.
[4] A. R. Silva and M. C. Vuran, “Empirical evaluation of wireless
underground-to-underground communication in wireless
underground sensor networks,” in Proceedings of the 5th IEEE
International Conference on Distributed Computing in Sensor
Systems (DCOSS ’09), vol. 5516 of Lecture Notes in Computer
Science, pp. 231–244, Marina del Rey, Calif, USA, June 2009.
[5] L. Li, M. C. Vuran, and I. F. Akyildiz, “Characteristics
of underground channel for wireless underground sensor
networks,” in Proceedings of the Annual Mediterranean Ad Hoc
Networking Workshop (Med-Hoc-Net ’07), Corfu, Greece, June
2007.
[6] N.Peplinski,F.Ulaby,andM.Dobson,“Dielectricproperties
of soils in the 0.3–1.3-GHz range,” IEEE Transactions on
Geoscience and Remote Sensing, vol. 33, no. 3, pp. 803–807,
1995.
[7] I. F. Akyildiz, Z. Sun, and M. C. Vuran, “Signal propagation
techniques for wireless underground communication net-
works,” Physical Communication, vol. 2, no. 3, pp. 167–183,
2009.
[8] “Crossbow Mica2, Micaz, and IRIS motes,” http://www
.xbow.com/.
[9] “Ward Laboratories,” />[10] W. H. Gardner, “Water content,” in Methods of Soil Analysis—
Part 1,A.Klute,Ed.,AmericanSocietyofAgronomy—Soil
Science Society of America, Madison, Wis, USA, 2nd edition,
1986.
[11] “Decagon devices. EC-5 sensor,” />research/soil/ec5.php.
[12] C. Ritsema, H. Kuipers, L. Kleiboer, et al., “A new wireless
underground network system for continuous monitoring of
soil water contents,” Water Resources Research Journal, vol. 45,
pp. 1–9, 2009.
[13] H. R. Bogena, J. A. Huisman, C. Oberdorster, and H.
Vereecken, “Evaluation of a low-cost soil water content sensor
for wireless network applications,” Journal of Hydrology, vol.
344, no. 1-2, pp. 32–42, 2007.
[14] M. Zuniga and B. Krishnamachari, “Analyzing the transitional
region in low power wireless links,” in Proceedings of the 1st
Annual IEEE Communications Society Conference on Sensor
and Ad Hoc Communications and Networks (SECON ’04),pp.
517–526, Santa Clara, Calif, USA, October 2004.
[15] T. S. Rappaport, Wireless Communications—Principles and
Practice, Prentice Hall, Englewood Cliffs, NJ, USA, 1st edition,
1996.