Báo cáo hóa học: " Research Article A Multievent Congestion Control Protocol for Wireless Sensor Networks" pptx
Bạn đang xem bản rút gọn của tài liệu. Xem và tải ngay bản đầy đủ của tài liệu tại đây (967.25 KB, 12 trang )
Hindawi Publishing Corporation
EURASIP Journal on Wireless Communications and Networking
Volume 2008, Article ID 803271, 12 pages
doi:10.1155/2008/803271
Research Article
A Multievent Congestion Control Protocol for
Wireless Sensor Networks
Faisal B. Hussain,
1
Yalcin Cebi,
1
and Ghalib A. Shah
2
1
Department of Computer Engineering, Dokuz Eylul University, 35100 Izmir, Turkey
2
Department of Computer Engineering, College of Electrical and Mechanical Engineering, National University of
Sciences and Technology (NUST), Rawalpindi 46000, Pakistan
Correspondence should be addressed to Ghalib A. Shah,
Received 8 February 2008; Revised 29 October 2008; Accepted 7 December 2008
Recommended by Abraham Fapojuwo
Wireless sensor networks are application-dependent networks. An application may require general event region information, per-
node event region information, or prioritized event information in case of multiple events. All event flows are subject to congestion
in wireless sensor networks. This is due to the sudden impulse of information flow from a number of event nodes to a single
destination. Congestion degrades system throughput and results in energy loss of nodes. In this paper, we present a multievent
congestion control protocol (MCCP) for wireless sensor networks. MCCP supports multiple event reporting modes, that is, general
event reporting, per-node fair event reporting, and prioritized multiple event reporting. MCCP efficiently mitigates congestion and
provides output according to selected event reporting mode. MCCP uses hop-by-hop packet delivery time and buffer size as the
basic metrics for congestion detection. Moreover, we introduce a schedule-based scheme at the transport layer for rate assignment
and ordered delivery of event packets to underlying routing layer. This helps to avoid packet collisions and increases the packet
delivery ratio even in high densities. Detailed simulation analysis confirms that MCCP decreases packet drops and provides high
packet delivery ratio (above 90%) for multiple event reporting modes.
Copyright © 2008 Faisal B. Hussain et al. This is an open access article distributed under the Creative Commons Attribution
License, which permits unrestricted use, distribution, and reproduction in any medium, provided the original work is properly
cited.
1. INTRODUCTION
Wireless sensor networks (WSNs) in recent years have
emerged as key systems for information gathering and
control. Sensors gather information from the environment
through measuring mechanical, thermal, biological, chem-
ical, optical, and magnetic phenomena. The electronics
then process the information derived from the sensors and
through some decision making capability direct critical event
information to the sink. Applications may require that nodes
send sensing information either periodically or on event
occurrence.
Wireless sensor networks are characterized by their
unique requirements which are application-specific (see
[1, 2]). An application may require general event region
information, per-node event information, or multiple events
information, and so forth. Consider a WSN working inside
a mine for the purpose of environmental monitoring and
control. The nodes monitor events like fire, oxygen content
in air, sudden increase in pressure, and leakage of toxic gases.
For events like increase in temperature and pressure, general
event region information can be sufficient but for events like
leakage of poisonous, gas or oxygen content in air precise
per-node information is required to identify unsafe regions
in the mine. Moreover, interrelated events like fire and
decrease in oxygen content in air can occur at the same time.
Multiple events may need to be reported at different rates
when observed altogether. Therefore, a single application
might require information to be delivered in different event
reporting modes, for instance, simple, fair, or prioritized.
Event information flow (many to one) causes congestion
in wireless sensor networks since a number of event sensing
nodes send their event information to the sink at the same
time [3]. A node gets congested if the incoming rate of
packets is more than its outgoing rate which results in buffer
overflow.
Density of the network is an important factor that
increases the degree of congestion; considering fix trans-
mission power of nodes. Due to random deployment, the
difference between densities in the network will be even more
2 EURASIP Journal on Wireless Communications and Networking
0
10
20
30
40
50
60
Buffer size
20 40 60 80 100 120 140 160
Time (s)
10 nodes
50 nodes
70 nodes
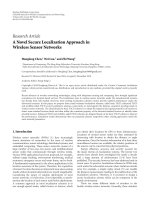
Figure 1: Average buffer size of 10, 50, and 70 event reporting
nodes.
extreme in worst-case networks [4]. Because of high density,
packets will be dropped due to collisions at the MAC layer.
Also, contention for medium-access increases as packets do
not get a chance for transmission in busy medium. This
results into an increase in buffer size of nodes in dense
networks. We illustrate this fact in Figure 1, where we observe
the average buffer occupancy of event nodes under variable
densities in a 100
× 100 m sensor field with 100 nodes. The
event reporting region is centered at (40,40) coordinates
and having a radius of 20 m. A number of 10, 50, and 70
event nodes report event to maintain a constant reporting
rate (70 pkts/sec) at the sink located at (90,90) coordinates;
without using any congestion control scheme. It is evident
from Figure 1 that as the number of event reporting nodes
increase within the event reporting region, the average buffer
occupancy of event reporting nodes also increases.
WSNs are application-dependent networks [1]. There-
fore, different congestion control schemes [3, 5–7]have
been proposed in literature aiming to handle congestion
in WSNs while providing optimal throughput, fair per-
node throughput, or prioritized throughput. Congestion
control protocols for wireless sensor networks generally
consist of two basic parts. Firstly, a congestion detection
mechanism and secondly, a rate-control mechanism to
adjust the reporting rate of nodes in order to avoid or
mitigate congestion. These protocols use different metrics
for congestion detection like buffer size, packet interarrival
time, packet service time, channel sampling, and trafficload
assessment. For adjusting the reporting rates of nodes either
a sink-based or in-network node-based solution is used. In
both cases, event reporting nodes are assigned a reporting
rate so that they can forward event packets in accordance
with congestion status; using jittered forwarding of packets.
A jitter is the random delay which is added at the time a
packet is delivered to underlying layers by the transport layer.
This delay is used to avoid any possible collisions, as the
packet is broadcasted in a shared wireless environment.
In this paper, we propose a single multievent congestion
control protocol (MCCP) for wireless sensor networks.
MCCP addresses the issue of congestion control while
providing optimal throughput, fair per-node throughput,
and prioritized throughput for multiple events. MCCP is
implemented at the transport layer. It uses hop-by-hop
packet delivery time and buffer size as the basic metrics
for rate adjustment and congestion detection. Moreover,
we introduce a schedule-based scheme at the transport
layer for rate assignment and ordered delivery of event
packets to underlying routing layer. By using a schedule-
based scheme at the transport layer helps to avoid packet
collisions and increases the packet delivery ratio even in high
densities.
The paper is organized as follows. In Section 2, related
works on congestion control, fair event reporting, and
rate adjustment are presented. Basic network setup, system
definitions, and assumptions for MCCP protocol are pre-
sented in Section 3. The operation of the MCCP protocol
is presented in Section 4.InSection 5, detailed simulation
results are shown and in Section 6, the paper is concluded.
2. RELATED WORK
In this section, several congestion avoidance and control
protocols, rate adjustment mechanisms, fairness schemes,
and transport protocols for wireless sensor networks are
reviewed. In [8, 9], the major issues of transport layer
protocols in WSNs and a detailed survey of major congestion
and transport protocols have been presented.
Congestion detection and avoidance (CODA) in sensor
networks [3] uses open-loop and closed-loop mechanisms to
handle congestion which is detected on the basis of channel
sampling and buffer occupancy. Once congestion is detected,
the open-loop mechanism broadcasts back pressure message
to their neighboring nodes which further propagate these
messages to upstream source nodes, depending on their
local buffer occupancy. SenTCP [6] uses hop-by-hop, open-
loop congestion control mechanism that detects congestion
using both buffer occupancy and packet interarrival time. In
SenTCP, nodes avoid congestion by issuing periodic feedback
signals to adjust the reporting rate of their upstream nodes
depending on local buffer status. Priority-based congestion
control protocol (PCCP) [10] uses packet interarrival time
and packet service time to detect congestion level at a node
and employs weighted fairness to allow nodes to receive
priority-dependent throughput. If all nodes have the same
priority, then PCCP can give same per-node throughput.
With different priorities, PCCP can provide throughput
based on the priority of the node.
The congestion signals or rate adjustment information in
CODA [3], SenTCP [6], and PCCP [10]propagatebackfrom
the congestion region to the source nodes. However, if the
congestion region is at multiple hops from the source nodes,
or in case of high node density, these congestion signals
are dropped and they do not reach to source nodes. We
Faisal B. Hussain et al. 3
demonstrate in our simulation results that the use of source-
based congestion mitigation techniques in dense networks is
not a good solution.
Mitigating congestion in wireless sensor networks [11]
suggests multiple approaches for congestion removal which
span on different layers of the traditional protocol stack.
These approaches include hop-by-hop flow control based
on buffer occupancy, rate limiting to implement fairness,
and a prioritized medium access control (MAC) protocol
that decreases the back-off window of a congested node.
However, these schemes are applicable for networks in
which nodes offer same traffic load and the routing tree
is not significantly skewed. Event-to-sink reliable transport
(ESRT) in wireless sensor networks [12] uses change in
local buffer level of a node during consecutive intervals to
predict congestion resulting in a decrease in the reporting
rate by the sink. In case of congestion, ESRT regulates all
sources in the network regardless of a particular node causing
congestion; this decreases the overall system throughput. A
price-oriented reliable transport protocol (PORT) [13] uses
link loss estimation as a basic source of congestion detection
and avoids congestion by dynamically forwarding packets to
less-congested nodes. In dense networks, link losses are high
which are generally not because of congestion but due to
collisions of packets. In PORT, sink directs individual nodes
to increase or decrease their reporting rates. However, in
dense networks, sending such control information to every
node is very difficult since nodes can be at multiple hop
distance from the sink.
Congestion avoidance based on light-weight buffer man-
agement in sensor networks [14] suggests sending a packet to
a neighboring node only when the neighboring node has the
buffer space to hold the packet. Nodes inform their neigh-
boring nodes about their residual buffer size by piggybacking
the buffer size either in data or acknowledgement (ACK)
packet. However, this requires extra control information
to be sent on per-packet basis. Interference-aware fair rate
control (IFRC) in wireless sensor networks [15]detectscon-
gestion by monitoring average queue length and exchanges
congestion state among the potential interferers using a
congestion sharing mechanism. In IFRC, each node adds
its buffer size and current congestion state in every packet
that it forwards resulting into extra energy consumption
per-packet basis. Credit-based fairness control in wireless
sensor network (CFRC) [16] allocates bandwidth to nodes
basedoneffective amount of sensed information which is
dependent on node density and their distribution instead
of uniformity. However, CFRC does not provide per-node
fairness instead provides fairness on credit basis depending
on sensed information by a node.
In [17], a congestion avoidance scheme for WSNs which
is based on light-weight buffer management is presented. It
suggests that a sender should transmit a packet only when
it knows that the receiver has the buffer to store the packet.
Therefore, data packets are piggybacked to update buffer
state. When a sensor x sends out a data packet, it piggybacks
its residual-buffer size in the frame header. If a neighbor y
overhears a frame from x, it caches the residual-buffer size of
x. When y overhears a packet which is sent by another sensor
to x, it reduces the residual-buffer size of x by one. In [18],
an aggregation-based congestion control for sensor networks
(CONCERT) is presented. CONCERT uses adaptive data
aggregation in order to reduce the amount of information
travelling through out the network rather than using a back-
pressure approach to regulate source nodes transmission rate
on congestion.
Congestion control and fairness (CCF) for many-to-
one routing in sensor networks [5] uses buffer size to
detect congestion. CCF implements a tree-based technique
in which each node calculates its subtree size. Reporting
rate is allocated to nodes depending on their subtree sizes.
Every node maintains a separate queue for each of their
previous hop nodes. Nodes forward packet from these
queues depending on the subtree size of the previous hop
nodes during each epoch. Sensor nodes have limited memory
resources (see [19, 20]), maintaining a separate queue for
each previous hop node is not a memory efficient solution;
especially in dense networks. Also, in case of multiple events,
CCF treats all events similarly which can have different
reporting rate requirements.
As a summary, congestion control protocols for wireless
sensor networks generally consist of two basic parts. Firstly,
a congestion detection mechanism and secondly, a rate-
control mechanism to adjust the reporting rate of nodes
in order to avoid or mitigate congestion. As a result, these
protocols provide general event(s) information (CODA [3],
SenTCP [6], ESRT [12]), per-node fair event information
(CCF [5], IFRC [15]), and prioritized event information
(PCCP [10]). However, we present a single MCCP protocol
that mitigates congestion while providing general event
information, per-node event information, and prioritized
event information for multiple events. Moreover, MCCP
associates a schedule-based scheme at the transport layer in
order to avoid packet losses in dense networks.
3. SYSTEM DEFINITION
In this section, we explain the basic system-related def-
initions, network setup, and assumptions. The network
comprises of non-mobile wireless sensor nodes and a sink.
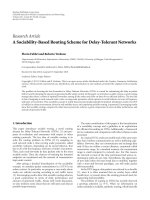
We define the nodes as event reporting (E-REP), routing
(E-R), reporting and routing (E-REP-R), and idle nodes. If
b, c, d are the nodes routing through node a, then b, c, d
are the previous hop or child nodes of a and a is the next
hop node of b, c, d, as shown in Figure 2. All nodes routing
event information through node a are associated with same
information flow.
MCCP uses minimum hop forwarding at the routing
layer. In order to achieve minimum hop routing, each node
maintains a next hop table which contains the list of its
possible next hop nodes, which are at minimum hop distance
from the sink. The table is established during the initial
network setup as the sink broadcasts a route discovery
packet. The route discovery packet includes source ID (sink),
sender ID, and hop count. Neighboring nodes receiving the
packet add the sending node into their next hop table and
increments the hop count of the packet. A node receiving
a route discovery packet only forwards it to the next hop
4 EURASIP Journal on Wireless Communications and Networking
g
e
f
c
b
a
d
Sink
Event packets
Schedule packets
Figure 2: Flow of event and schedule packets
node if the hop distance of the received packet is smaller
than or equal to the already stored hop distance, otherwise,
it discards the packet. Hence, next hop table is established at
network setup time using controlled flooding. Nodes during
event reporting randomly select a single next hop node from
their table and forward their packets through that node.
MCCP is designed to mitigate congestion and pro-
vide optimal throughput for the following event reporting
modes.
(1) Simple event reporting mode (SERM).Sensornodes
report event to the sink in order to provide maximum
event region information. Simple event reporting
aims to achieve maximum system throughput irre-
spective of per-node share at the sink. Therefore, this
event reporting mode is suitable for events that are
required to send general event region information.
(2) Fair event reporting mode (FERM).Sensornodes
report event to the sink in order to provide the same
per-node throughput at the sink. Therefore, sensor
nodes within a single flow adjust their reporting rates
in order to fairly distribute the bandwidth among all
the event reporting nodes.
(3) Prioritized event reporting mode (PERM). In sensor
networks depending on application needs, different
metrics like event, node, region, or time are used
for priority. We consider event-based priority for
multiple events that are reported through a single
flow which aims to distribute the system bandwidth
among different event reporting nodes depending on
their reporting rates. As a result, nodes with high
reporting rates deliver more packets to the sink than
nodes with lower reporting rates; irrespective of node
distance from the sink.
Sink in MCCP is responsible for the selection of appro-
priate event reporting mode. Also, during event reporting,
sink can shift between different event reporting modes
allowing sink to obtain detailed and precise event region
information. However, selection of event mode and the
decision of when to shift the event mode is application-
dependent, therefore, it is out of the scope of this paper.
Nodes in MCCP maintain successive fixed size data (γ-
second) and schedule (δ-second) intervals throughout their
life time. During the data intervals, nodes generate/route
available event information, and during schedule intervals
routing nodes send transmission schedule for their previous
hop nodes. The schedule comprises of slot length (λ sec),
total number of slots, and allocated number of slots for a
previous hop node. We define slot in terms of a time duration
during which a node forwards a single packet.
The duration of data and schedule interval does not
change. Since the slot length’s duration changes in each
schedule interval, the rate at which packets will be sent
during the next data interval will change. Hence, slot length
determines the reporting rate of a node during an interval. If
the slot length is short, more traffic will be forwarded by the
node and vice versa.
One of the purposes of using schedules and scheduled
packet forwarding at transport layer is to decrease the MAC
layer collisions. CSMA-based scheme senses the channel
before broadcasting a packet. If the neighboring nodes
are not using the medium, then a node can broadcast its
packet. The use of schedule increases the probability that
when a node is forwarding packet in its allocated data
slots, the neighboring nodes will not be transmitting data.
As a result, when the MAC layer senses the medium, it
will be free. Hence, packet drops due to collisions will
decrease. For TDMA-based MAC layer, synchronization is
required between MCCP’s transport layer schedule and MAC
layer’s schedule for TDMA. However, MCCP is proposed to
operate with CSMA-based MAC layer (IEEE 802.11), and the
synchronization of MCCP with TDMA based MAC layer is
not considered.
The first hop node from the sink in MCCP is responsible
for sending the initial schedule to their previous hop nodes
during the start of each schedule interval. The slot length
for each data interval is updated by E-REP-R and E-R nodes
during schedule interval (details of slot length calculation
and slot allocation are explained in the Section 4). The
slot length received from a parent node or next hop node
is termed as basic slot length (BSL) while the slot length
calculated by the node itself is termed as local slot length
(LSL). E-REP-R and E-R nodes after receiving the schedule
from parent node send either LSL or BSL to their previous
hop nodes in the schedule using slot length selection
procedure (discussed in Section 4.3.1). Hence, each node in
MCCP follows the schedule received from their next hop
node. If a node does not receive a new schedule during
schedule interval, then during the next data interval, it
continues transmission using the old schedule.
TDMA-based techniques use fixed time slots that are
assigned to sources. However, in our schedule-based scheme,
time slots are dynamically assigned during the sched-
ule intervals depending on the average packet delivery
time observed by nodes and their buffer size. For best
results, schedule-based schemes require strict synchroniza-
tion among the nodes sharing a schedule. In this work, it is
assumed that the nodes are synchronized.
We define packet delivery time in our congestion control
scheme as the t ime a packet takes to reach from the transport
buffer of a previous hop node to the next hop node’s transport
buffer. Nodes maintain a queue at the transport layer and
Faisal B. Hussain et al. 5
forward a single packet from it during their allocated slots.
Packet delivery time not only includes service time but
also the transmission time plus the reception time at the
destination. Congestion is likely to occur if the packet
delivery time of nodes exceeds the packet delivery time of
their previous hop node resulting in a buffer overflow.
We divide the buffer size of nodes into three ranges
low, medium (optimal), and high. The goal of congestion
control mechanism is to maintain the buffer size of nodes
within the optimal range. If the buffer size is low/high, nodes
will decrease/increase the slot length for the next interval,
respectively, to achieve optimal range; otherwise, nodes will
maintain the slot length for the next interval. Hence, each
node adjusts the reporting rate (through slot length) of its
previous hop nodes so that the buffer is optimally utilized
and to avoid congestion while providing high throughput.
4. MULTIEVENT CONGESTION CONTROL PROTOCOL
The operation of MCCP includes a mechanism to detect
congestion and to adjust the reporting rate (slot length)
of nodes. In order to detect and remove congestion, the
slot lengths are calculated by nodes depending on their
local network conditions; in terms of average packet delivery
time and buffer size. Other important points of MCCP
include slot allocation to nodes on event occurrence and
the principles of schedule-based scheme. In this section,
we explain slots allocation, slot length calculation, and the
operationofschedule-basedscheme.
4.1. Slot allocation
A slot is a time interval during which a node can forward
a single packet. Therefore, the greater the number of slots
assigned to a particular node the greater will be its reporting
rate. In case of simple and prioritized event reporting, slots
are assigned equal to the total reporting rate of a node.
However, in case of fair event reporting, nodes are assigned
slots equal to their subtree size.
Nodes start reporting by sending their initial application-
defined event reporting rate to one of their next hop nodes
during data interval. Also, using this information, each node
determines its subtree size. The next hop nodes forward their
updated subtree size and total reporting rate which is the
sum of its own event reporting rates (in case of event node)
and reporting rate of all the nodes traversing through it. In
this way, the first hop node from the sink obtains the total
reporting rate of the flow as well as its subtree size. The
first hop node, after receiving the initial event request assigns
slots to their previous hop nodes during schedule interval;
depending on event-reporting mode.
(1) Slot Allocation for SERM. Let R
min
be the minimum
reporting rate among all the events observed by the
network. Then, in order to simplify slot assignment,
we assume that reporting rates of all other events
will be a factor of R
min
, expressed as 2
n
R
min
,where
n
≥ 0. Let R
1
be the initial reporting rate for an
event E
1
. The number of slots S
j
i
, assigned to jth
Table 1: Transmission schedule generated by node a in SERM and
PERM.
Node ID Total slots Initial slot End slot Slot length (sec)
b 711 0.1
c 726 0.1
d 777 0.1
Table 2: Transmission schedule generated by node a in FERM.
Node ID Total slots Initial slot End slot Slot length (sec)
b 611 0.1
c 625 0.1
d 666 0.1
previous hop neighbor of node i, can be calculated
as R
j
/R
i
min
,whereR
j
is the reporting rate of the jth
node and R
i
min
is the minimum reporting rate among
the children of ith such that R
j
, R
i
min
∈ 2
n
R
min
and
R
j
≥ R
i
min
.IfN
k
are the total number of nodes to be
routed through the ith node, then it calculates total
number of slots as
k
j
=1
R
j
/R
i
min
.
(2) Slot Allocation for FERM. In case of fair event
reporting slots are assigned according to subtree sizes
of previous hop nodes. The subtree size depends on
number of event nodes and not on their reporting
rates. Therefore, even in case of multiple events with
different reporting rates nodes can forward packets
with node-based fairness so that all nodes have same
representation at the sink. The number of slots S
j
i
assigned to jth previous hop neighbor of node i is
equaltothesubtreesizeT
j
of the jth node.
(3) Slot Allocation for PERM. In case of prioritized event
reporting for multiple events, slots are assigned with
respect to minimum reporting rate among all events
observed by the network (R
min
). Therefore, total
number of slots allocated to all the previous hop
nodes (N
k
)ofnodei in case of prioritized event
reporting will be
k
j
=1
R
j
/R
min
.
For example, let us assume for simplicity that all nodes except
node a in Figure 2 are event-reporting nodes. Furthermore,
let the initial reporting rates of nodes be b(10), c(10), d(10),
e(10), f (20), and g(10). Then, the total reporting rate of
node b, c,andd will be 10, 50, and 10, respectively, while
node a has a total reporting rate of 70. Moreover, the subtree
sizes of nodes b, c,andd are1,4,and1,respectively,while
node a has total subtree size of 6. Therefore, node a in SERM
and PERM will assign slots to previous hop nodes as shown
in Ta ble 1 while slot allocation for FERM is shown in Tab le 2 .
Nodes b, c,andd will divide their data interval into 0.1
second intervals; the initial slot length on event occurrence.
These nodes will forward one event packet to node a during
their allocated slots.
Node c is an E-REP-R node, therefore, depending on
event reporting mode node c will generate a schedule for
nodes e and f . Tables 3, 4,and5 show the schedules given
6 EURASIP Journal on Wireless Communications and Networking
Table 3: Transmission schedule generated by node c in SERM.
Node ID Total slots Initial slot End slot Slot length (sec)
e 412 0.1
f 434 0.1
Table 4: Transmission schedule generated by node c in FERM.
Node ID Total slots Initial slot End slot Slot length (sec)
e 634 0.1
f 655 0.1
Table 5: Transmission schedule generated by node c in PERM.
Node ID Total slots Initial slot End slot Slot length (sec)
e 734 0.1
f 756 0.1
to nodes e and f by node c in SERM, FERM, and PERM,
respectively. Likewise, node e will generate a schedule for
child node g.
4.2. Slot length calculation
In order to provide optimal throughput while avoiding
congestion, the slot length is calculated by nodes depending
on local network condition; in terms of average packet
delivery time and buffer size.
Nodes observe the average packet delivery time of their
previous hop nodes in a data interval from the received
packets. The average packet delivery time observed during
the data interval is used as the slot length for the next
data interval. However, if a node’s buffer is either under- or
overutilized during the data interval, then the node adjusts
its slot length in order to optimally utilize the buffer.
Algorithm 1 illustrates the slot length calculation proce-
dure. Let λ
t
i
be the slot length for the tth interval; B
t
i
and
B
t−1
i
be the buffer size for the tth and (t − 1)th interval of
ith node. Then, in order to calculate appropriate slot length
for the next interval λ
t+1
i
, a node measures change in buffer
occupancy (φB) between two consecutive data intervals and
the predicted buffer occupancy (ρB) for the next interval,
similar to ESRT [12]as
φB
t−1,t
i
= B
t
i
−B
t−1
i
, ρB
t+1
i
= B
t
i
+ φB
t−1,t
i
. (1)
In case the predicted buffer occupancy is not in the
optimal buffer occupancy range (O
p
B
min
↔ O
p
B
max
), then
nodes adjust their slot length for the next interval by adding
or subtracting a deviation factor (ω
t
) in the current slot
length. We calculate deviation factor ω
t
i
for the ith node at
the end of tth interval as
Deviation
ω
t
i
=
±
O
p
B −ρB
t+1
i
O
p
B ∗λ
t
i
,
O
p
B =
O
p
B
min
+ O
p
B
max
2
.
(2)
1: CurrentSlotLength (λ
t
) = AverageDeliveryDelay
2: if BuffSize
= AverageDeliveryDelay then
3: /
∗ Initially when event is detected and reported ∗/
4: NextSlotLength(λ
t+1
) = 0.1 sec (Default)
5: GO TO Step 26
6: end if
7: if BuffSize
= 0 then
8: /
∗Special case when reporting rate is low∗/
9: λ
t+1
= λ
t
/2
10: GO TO Step 26
11: end if
12: Calculate PredictedBuffSize(ρB)/
∗ Using (1)∗/
13: if ρB < 0 then
14: /
∗if previous buffer size is greater than current∗/
15: ρB
= BuffSize
16: end if
17: if ρB < O
p
B
min
then
18: Calculate DeviationFactor (ω)/
∗Using (2)∗/
19: λ
t+1
= λ
t
−ω
20: else if ρB > O
p
B
max
then
21: Calculate DeviationFactor (ω) /
∗Using (2)∗/
22: λ
t+1
= λ
t
+ ω
23: else
24: λ
t+1
= λ
t
25: end if
26: Transmit Schedule
Algorithm 1: Slot length calculation (procedure is called at the
start of each schedule interval by routing and reporting and routing
nodes).
Hence, the slot length for (t + 1)th interval will be
λ
t+1
i
= λ
t
i
−ω
t
i
(if ρB
t+1
i
<O
p
B
min
),
λ
t+1
i
= λ
t
i
+ ω
t
i
(if ρB
t+1
i
>O
p
B
max
),
λ
t+1
i
= λ
t
i
(if ρB
t+1
i
∈ O
p
B
min
←→ O
p
B
max
).
(3)
4.3. The operation of schedule-based scheme
In this section, we present the operation of our schedule-
based scheme which is controlled by the first hop node from
the sink. Each node maintains data and schedule intervals,
therefore, the operation of MCCP can be subdivided into
schedule interval and data interval operations. Each schedule
interval is followed by a data interval.
4.3.1. Schedule interval
During every schedule interval nodes starting from the first
hop nodes send their schedule packets to their previous
hop nodes. Each previous hop node before forwarding their
schedule to their child nodes compares its local slot length
(LSL) with the next hop node’s basic slot length (BSL). There
are three possibilities: local slot length less than, greater than,
or equal to basic slot length.
(i) LSL < BSL. In this case, the node receiving the
schedule is locally less congested than its next hop
Faisal B. Hussain et al. 7
node. Therefore, it can allow its previous hop nodes
to send packets at a higher rate. This helps to increase
the overall system throughput. However, it will result
in unordered delivery of packets to next hop node
resulting in unfairness and affecting the prioritized
delivery of packets. Therefore, in mode 1, the nodes
will send LSL while in modes 2 and 3, BSL is sent to
their child nodes in the schedule.
(ii) LSL > BSL. In this case, the node receiving the
schedule is more congested than its next hop node.
Therefore, in all modes, the nodes will send LSL to
their child nodes in the schedule although it will
result in unfairness in mode 2 but will mitigate local
congestion.
(iii) LSL
≈ BSL. In this case, local and basic slot lengths
are approximately equal, therefore, the nodes will
send basic slot length to their child nodes.
The addition of schedule interval can increase the report-
ing delay for events; depending on the length of schedule
interval. MCCP can be modified to operate in overlapping
schedule and data intervals to remove the delay cast by
schedule intervals. So, during schedule intervals, nodes will
continue to forward packets. In this case, when congestion
occurs, the sent schedule packets can be dropped due to
congestion. Therefore, packet drops in overlapping schedule
and data intervals will be higher than in the nonoverlapping
form. As a result considering nonreal time events, this work
uses nonoverlapping schedule and data intervals.
4.3.2. Data interval
Each node maintains slot intervals equal to their selected slot
length during their data interval. At the expiry of each slot
interval, a node checks whether it is allowed to send packet
during this slot according to its schedule. In case of event
reporting node during the allocated slots, it sends an event
packet to the next hop node. While routing, nodes simply
forward a packet from the transport buffer to its next hop
node in its allocated slots. However, event reporting and
routing nodes send new event packets as well as forward
event packets from the transport queue according to their
schedule.
Schedule packets are a natural overhead in MCCP. The
duration (length) of a schedule interval defines the time in
which nodes are allowed to send transmission schedule for
their previous hop node. The length of schedule interval
is dependent on the total number of hops (TNHs) in the
flow. If ψ is the minimum hop-by-hop packet delivery time,
then ψ
× TNH is the minimum time required to deliver
all schedule packets for a linear node arrangement. Since
in MCCP nodes do not forward packets during schedule
intervals, the network is idle. Therefore, schedule packets are
not subject to congestion, likewise interference is minimum.
As a result, schedule packets are immediately delivered.
On the other hand, the number of schedule packets
generated during every schedule interval are very less and
constant as compare to data packets. Let K be the number
of event reporting nodes while N be the number of non-idle
Table 6: Simulation parameters.
Transport Layer MCCP
Network Layer Minimum hop routing
MAC Layer IEEE 802.11
Data Packet Length 36 bytes
Schedule Packet Length 24 bytes
Transport Queue 50 packets
IFQlength 65packets
Transmit Power 0.660 W
Receive Power 0.395 W
Radio Range 20 m
Data Interval 4 sec
Schedule Interval 1 sec
nodes in a single flow. Non-idle nodes include all E-REP, E-
R, and E-REP-R nodes. In this case, N
−1 will be the number
of schedule packets generated during each schedule interval.
If λ is the slot length during a data interval set by the first hop
node of the flow, then (1/λ)
∗ γ will be the number of data
packets delivered to sink by the flow.
A data interval defines the time span during which nodes
are allowed to forward their data packets in their allocated
slot lengths. The number of packets generated during a
data interval are dependent on the slot length (λ) and data
interval length (γ).Thesmallerthevalueofλ, the greater
will be number of packets delivered to sink during data
interval. Slot length is adjusted by nodes, therefore, its value
is dependent on packet delivery time and buffer size of nodes.
However, length of data interval (γ) is fixed. The longer the
length of data interval, the greater will be the number of
packets delivered to sink during the data interval, but in
case of congestion, the greater will be the number of packets
dropped since congestion can only be mitigated in schedule
intervals by adjusting the slot length of nodes. The smaller
the length of data interval, the greater will be the overhead
of schedule packets since MCCP maintains successive data
and schedule intervals. Therefore, as shown in simulation
results (see Section 5.4), we select the length of data and
schedule intervals in order to provide maximum throughput
with minimum overheads and packet drops.
5. SIMULATION RESULTS OF MCCP
We evaluate the performance of MCCP in terms of packet
delivery ratio, fair event reporting at sink, prioritized
event reporting, and energy consumption. Furthermore, we
demonstrate that using a schedule-based mechanism at the
transport layer in contrast to jittered forwarding increases
the packet receive ratio and the throughput even in high
densities. We show the performance of MCCP using network
simulator ns-2 [21], which is a scalable discrete-event
simulator. Ta bl e 6 summarizes the configuration parameters
for the simulations.
MCCP is used at the transport layer. We use minimum
hop routing at the routing layer. CSMA-based IEEE 802.11
is used as the MAC layer. In MCCP, all received/generated
8 EURASIP Journal on Wireless Communications and Networking
packets are queued at the transport layer and are further
forwarded according to the schedule followed by the nodes.
Thelengthofthistransportqueueis50packets.Thelength
of IFQ, transmit power and receive power are mirrored to
commonly used sensor nodes like Mica [20].
We compare MCCP with source-based congestion mit-
igation (SCM) scheme where the congestion signal prop-
agates from congestion region to source nodes similar to
CODA [3]. Moreover, congestion is detected on the basis
of buffer size, and reporting rate of nodes is adjusted using
additive increase multiplicative decrease (AIMD) mecha-
nism. For SCM, we use an increment factor of 1.3 and
decrement factor of 2. We also compare our simulation
results with a fairness mechanism similar to CCF [5];
commonly referenced fairness scheme for wireless sensor
networks. In our implementation of CCF, nodes use packet
service time to predict their reporting rates. Furthermore,
nodes use buffer size to predict congestion. Each node
implements a separate child node queue at the transport
layer. Fairness is achieved by forwarding packets from the
child node queues equal to subtree size of each child node.
5.1. Packet delivery ratio
Packets delivery ratio decreases either by an increase in
the reporting rate or by an increase in the density of the
network (considering fixed transmission power for nodes).
This is evident from Figure 3, in which 20, 50, and 70 event
reporting nodes, respectively, centered at (40, 40) report the
event at different reporting rates using an SCM scheme. In
Figure 3, with the increase in the number of event reporting
nodes, sending congestion signal to source nodes which are
at multiple hops from congestion region is difficult. As a
result congestion is not properly controlled. Also, AIMD-
based rate control schemes are not able to properly adjust the
reporting rate of nodes as an increment/decrement factor is
independent of the number of event reporting nodes.
In Figure 4, we show the performance of MCCP in SERM
with different number of event reporting nodes. The packet
delivery ratio is above 90% under low and high densities.
This is because our congestion control mechanism not only
avoids but controls congestion by efficiently adjusting the
reporting rate of congested nodes resulting in few packet
drops.
In Figure 5, we compare the packet delivery ratio of
MCCP in FERM with CCF [5]. In Figure 5,for50nodes,
CCF [5] provides high packet receive ratio since the density
of event reporting nodes is less. However, due to interference
and busy medium at high density, CCF fails to provide high
packet receive ratio for 100 nodes. In order to guarantee
fair per-node throughput, each node is assigned a respective
schedule in FERM. By transmitting data in allocated slots,
nodes minimize the affect of interference and collision
observed in high densities. Therefore, packet receive ratio
of MCCP in fairness mode is very high in low and high
densities. If we compare the packet delivery ratio of MCCP
in SERM and FERM from Figures 4 and 5,performance
0
0.2
0.4
0.6
0.8
1
1.2
Packet delivery ratio
01234567891011
Interval (10 s)
20 event nodes
50 event nodes
70 event nodes
Figure 3: Packet receive ratio of 20, 50, 70 event reporting node
using SCM scheme.
0
0.2
0.4
0.6
0.8
1
Packet delivery ratio
01234567891011
Interval (10 s)
20 event nodes
50 event nodes
70 event nodes
Figure 4: Packet receive ratio of 20, 50, 70 event reporting nodes
using MCCP in SERM.
of MCCP in FERM is better. This is because the system
throughput of MCCP in FERM is lower than in SERM.
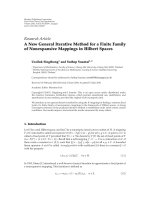
5.2. Fair event reporting
Event reporting is fair if the per-node throughput at the sink
is the same for all event reporting nodes in the flow. Figure 6
shows the simulation scenario where 20 nodes are reporting
the same event through first hop node 0 to the sink. The
arrow heads show the direction of minimum hop routing.
The radio range of nodes in this simulation is 10 meters. The
sink is located at (90, 50) coordinates in a 100
× 100 sensor
Faisal B. Hussain et al. 9
0
0.2
0.4
0.6
0.8
1
Packet delivery ratio
2 4 6 8 10 12 14 16 18
Interval (10 s)
MCCP (FERM)-50 event nodes
CCF-50 event nodes
MCCP (FERM)-100 event nodes
CCF-100 event nodes
Figure 5: Packet receive ratio of 20, 50, 70 event reporting nodes
using MCCP in FERM and CCF.
15
5
1
6
04
3
10
11
12
2
7
9
8
14
13
16
17
1819
20
Sink
Figure 6: Arrangement of 21 nodes in a 100 × 100 m field.
field. In Figure 7, we compare the per-node throughput of
MCCP in FERM with CCF [5] and SCM scheme. In Figure 7,
per-node throughput is observed at the sink during 100
seconds of event reporting.
SCM scheme does not employ any explicit fairness mech-
anism, therefore, per-node throughput at sink is variable.
CCF [5] provides considerably fair output but with lower
per-node throughput than MCCP. Moreover, in Figure 6,we
consider only single hop interference and the number of
0
0.5
1
1.5
2
2.5
3
3.5
4
4.5
5
Per node throughput (pkts/s)
1234567891011121314151617181920
Event nodes
MCCP-FERM
CCF
SCM
Figure 7: Per-node throughput of 20 event nodes using MCCP in
FERM, CCF, and SCM.
events reporting nodes is less. Fair and per-node throughputs
of CCF further deteriorate as the number of event nodes
increases or with increase in node density. Therefore, we
further compare CCF with MCCP in Figure 8 where we
show the average per-node throughput at the sink. In this
simulation, 50 event reporting nodes are randomly arranged
in an event region having a diameter of 40 m. Moreover, after
70 seconds of event reporting, 20 more nodes start reporting
the event from the same event region. In Figure 8,event
reporting with SCM scheme shows increase and decrease in
average per-node throughput since the AMID rate control
scheme operates irrespective of number of event reporting
nodes. Also, sending congestion signal to source nodes in
case of congestion is difficult resulting into further decrease
in throughput. CCF [5] provides low per-node throughput
since it considers only one hop interference and does not
employ any scheme to handle interference in high node
density. MCCP in SERM provides high per-node throughput
than in FERM since nodes report event without equally
sharing the bandwidth among all event reporting nodes.
5.3. Multiple events
In wireless sensor networks, more than one event can occur
at the same time. Figure 9 shows the per-node throughput of
four different events E
1
, E
2
, E
3
,andE
4
. The initial reporting
rate of events E
2
, E
3
,andE
4
is twice, thrice, and four times
that of event E
1
, respectively. In the simulation scenario,
nodes are arranged as shown in Figure 6 while the event
reporting nodes for event E
1
, E
2
, E
3
,andE
4
are shown
in Ta bl e 7 . Since CCF only considers node-based fairness,
therefore, it is unable to provide fair event reporting with
respect to multiple event demands. However, MCCP in
PERM uses initial event reporting rate for rate allocation,
10 EURASIP Journal on Wireless Communications and Networking
0
0.2
0.4
0.6
0.8
1
1.2
1.4
1.6
1.8
Average node throughput (pkts/s)
40 60 80 100 120 140 160 180
Time (s)
MCCP-SERM
MCCP-FERM
CCF
SCM
Figure 8: Average node throughput at the sink using MCCP in
SERM as well as FERM, CCF, and SCM during 170 seconds of event
reporting.
0
0.5
1
1.5
2
2.5
3
3.5
4
4.5
5
5.5
6
Per node throughput (pkts/s)
1 2 3 4 5 6 7 8 91011121314151617181920
Event nodes
MCCP-PERM
CCF
Figure 9: Per-node throughput of 20 nodes reporting four different
events using MCCP in PERM and CCF.
Table 7: Event reporting nodes for event E
1
, E
2
, E
3
,andE
4
.
Event Event reporting nodes
E
1
1,5,6,7,15
E
2
2,8,9,13,14
E
3
16,17,18,19,20
E
4
3,4,10,11,12
therefore, nodes according to the event demand get a share
of the bandwidth.
In Figure 10, we show the packet delivery ratio of the four
events E
1
, E
2
, E
3
,andE
4
using MCCP in PERM. Congestion
0
0.2
0.4
0.6
0.8
1
Packet delivery ratio
30 40 50 60 70 80 90 100 110 120 130
Time (s)
E
1
E
2
E
3
E
4
Figure 10: Packet delivery ratio of four events using MCCP in
PERM.
has almost same affectonalleventflowsasthepacket
delivery ratio decreases when congestion occurs. However,
MCCP effectively controls congestion and sustains a high
packet delivery ratio for all the events.
5.4. Length of data interval
In Figure 11, we show the number of packets received using
MCCP in SERM for different data interval lengths. The
length of schedule interval is 1 second and event nodes
are arranged as shown in Figure 6. Number of schedule
packets generated during each schedule interval is 20. It
is evident from Figure 11 that the shorter the length of
data interval, the random the behavior of MCCP, and the
longer the length of data interval, the longer it will take to
achieve optimal throughput. We calculate the overhead of
schedule packets in terms of total schedule packet generated
and total data packets delivered to sink. The overheads of
maintaining schedule packets while using 3, 4, 5, and 6
seconds of data intervals are 5.4%, 3.9%, 4%, and 3.75%,
respectively. Increasing the length of data interval above 6
seconds degrades the throughput of MCCP while decreasing
it below 3 seconds results in more random behavior and
increases schedule packet overhead. Therefore, MCCP uses
data interval length of 4 seconds in order to provide
maximum throughput with low overhead.
5.5. Energy consumption
In Figures 12 and 13, we show the residual energy of 100, 130,
and 150 nodes network deployed in a 100
× 100 m sensor
field; reporting using MCCP in SERM and FERM. All the
nodes are event reporting nodes. Initial energy of all nodes
is set to 0.1 Joules for this simulation. Despite the additional
scheduled packet transmission, MCCP decreases the energy
consumption since it handles congestions efficiently and also
Faisal B. Hussain et al. 11
0
200
400
600
800
1000
1200
Number of packets recieved
20 30 40 50 60 70 80 90 100 110 120
Time (s)
γ
= 6s
γ
= 5s
γ
= 4s
γ
= 3s
Figure 11: Number of packets recieved by 20 event nodes using
different data interval lengths.
5
6
7
8
9
10
11
12
13
14
Residual energy (Joules)
1234567891011
Interval (10 s)
MCCP-SERM
SCM
Figure 12: Residual energy of 130 event reporting nodes using
MCCP in SERM and SCM scheme.
because it does not increase the reporting rate of nodes more
than they can handle.
5.6. Scheduled versus jittered forwarding
We compare MCCP with our schedule-based forwarding
scheme and with a simple jittered-based forwarding scheme;
when both are applied at transport layer. In jittered for-
warding version routing, nodes send reporting rate to their
previous hop node instead of a schedule. For SERM in
Figure 14, we compare these schemes with respect to packet
delivery ratio. While for FERM in Figure 15,wecompare
these schemes with respect to per-node throughput. All
4
6
8
10
12
14
16
Residual energy (Joules)
024681012141618
Interval (10 s)
MCCP (FERM)-150 event nodes
CCF-150 event nodes
MCCP (FERM)-100 event nodes
CCF-100 event nodes
Figure 13: Residual energy of 100 and 150 event nodes using MCCP
in FERM and CCF.
0
0.2
0.4
0.6
0.8
1
Packet delivery ratio
20 30 40 50 60 70 80 90 100 110 120 130
Number of event reporting nodes
MCCP (SERM)-schedule based forwarding
MCCP (SERM)-jitter based forwarding
Figure 14: Packet delivery ratio of MCCP in SERM using schedule-
based and jitter-based forwarding.
simulations are run for 150 seconds of event reporting from
an event region of 40 m centered at (40,40) coordinates.
Figure 14 shows that as the number of nodes increases
in the event region, packet delivery ratio falls while using
MCCP with jittered forwarding. Likewise, using jittered
forwarding per-node throughput of 100 event nodes is
random in Figure 15.Thisisbecauseofpacketdropsdue
to high density, collisions, and busy medium. However, by
using schedule-based transmissions at the transport layer,
packet delivery ratio increases resulting in fair and increased
throughput.
12 EURASIP Journal on Wireless Communications and Networking
0
0.1
0.2
0.3
0.4
0.5
0.6
0.7
0.8
Per node throughput (pkts/s)
0 10203040506070809099
Event nodes
MCCP (FERM)-schedule based forwarding
MCCP (FERM)-jitter based forwarding
Figure 15: Per-node throughput of MCCP in FERM using
schedule-based and jitter-based forwarding.
6. CONCLUSION
The paper presents a multievent congestion control protocol
(MCCP) for wireless sensor networks. MCCP is capable
of mitigating congestion while providing maximum event
region information, per-node fair event region information,
and prioritized event information in case of multiple events.
Simulation results confirm that MCCP based on hop-by-
hop packet delivery time and buffer size increases the
system throughput by efficiently handling congestion in
the network. Also, using a scheduled-based scheme at the
transport layer for reporting events helps to avoid packet
drops in dense regions and increases the packet receive ratio
at the destination.
REFERENCES
[1] I. F. Akyildiz, W. Su, Y. Sankarasubramaniam, and E. Cayirci,
“Wireless sensor networks: a survey,” Computer Networks, vol.
38, no. 4, pp. 393–422, 2002.
[2] D. Culler, D. Estrin, and M. Srivastava, “Overview of sensor
networks,” Computer, vol. 37, no. 8, pp. 41–49, 2004.
[3] C Y. Wan, S. B. Eisenman, and A. T. Campbell, “CODA:
congestion detection and avoidance in sensor networks,” in
Proceedings of the 1st International Conference on Embedded
Networked Sensor Systems (SenSys ’03), pp. 266–279, Los
Angeles, Calif, USA, November 2003.
[4] T. Moscibroda, “The worst-case capacity of wireless sensor
networks,” in Proceedings of the 6th Internat ional Symposium
on Information Processing in Sensor Networks (IPSN ’07),pp.
1–10, Cambridge, Mass, USA, April 2007.
[5] C. T. Ee and R. Bajcsy, “Congestion control and fairness
for many-to-one routing in sensor networks,” in Proceedings
of the 2nd International Conference on Embedded Networked
Sensor Systems (SenSys ’04), pp. 148–161, Baltimore, Md, USA,
November 2004.
[6] C. Wang, K. Sohraby, and B. Li, “SenTCP: a hop-by-hop
congestion control protocol for wireless sensor networks,” in
Proceedings of the 24th Annual Joint Conference of the IEEE
Computer and Communications Societies (INFOCOM ’05),
Miami, Fla, USA, March 2005, poster paper.
[7] C. Wang, B. Li, K. Sohraby, M. Daneshmand, and Y. Hu,
“Upstream congestion control in wireless sensor networks
through cross-layer optimization,” IEEE Journal on Selected
Areas in Communications, vol. 25, no. 4, pp. 786–795, 2007.
[8] C. Wang, K. Sohraby, Y. Hu, B. Li, and W. Tang, “Issues of
transport control protocols for wireless sensor networks,” in
Proceedings of IEEE International Conference on Communica-
tions (ICC ’05), vol. 1, pp. 422–426, Hong Kong, May 2005.
[9] C. Wang, K. Sohraby, B. Li, M. Daneshmand, and Y. Hu, “A
survey of transport protocols for wireless sensor networks,”
IEEE Network, vol. 20, no. 3, pp. 34–40, 2006.
[10] C. Wang, K. Sohraby, V. Lawrence, B. Li, and Y. Hu, “Priority-
based congestion control in wireless sensor networks,” in
Proceedings of the IEEE International Conference on Se nsor
Networks, Ubiquitous, and Trustworthy Computing (SUTC
’06), vol. 1, pp. 22–31, Taichung, Taiwan, June 2006.
[11] B. Hull, K. Jamieson, and H. Balakrishnan, “Mitigating
congestion in wireless sensor networks,” in Proceedings of
the 2nd International Conference on Embedded Networked
Sensor Systems (SenSys ’04), pp. 134–147, Baltimore, Md, USA,
November 2004.
[12] O. B. Akan and I. F. Akyildiz, “Event-to-sink reliable transport
in wireless sensor networks,” IEEE/ACM Transactions on
Networking, vol. 13, no. 5, pp. 1003–1016, 2005.
[13]Y.Zhou,M.R.Lyu,J.Liu,andH.Wang,“PORT:a
price-oriented reliable transport protocol for wireless sensor
networks,” in Proceedings of the 16th IEEE International
Symposium on Software Reliability Engineering (ISSRE ’05),pp.
117–126, Chicago, Ill, USA, November 2005.
[14] S. Chen and N. Yang, “Congestion avoidance based on
lightweight buffer management in sensor networks,” IEEE
Transactions on Parallel and Distributed Systems, vol. 17, no.
9, pp. 934–946, 2006.
[15] S. Rangwala, R. Gummadi, R. Govindan, and K. Psounis,
“Interference-aware fair rate control in wireless sensor net-
works,” Computer Communication Review, vol. 36, no. 4, pp.
63–74, 2006.
[16] L. Shanshan, L. Xiangke, P. Shaoliang, Z. Peidong, and J. Jie,
“Credit based fairness control in wireless sensor network,”
in Proceedings of the 8th ACIS International Conference on
Software Engineering, Artificial Intelligence, Networking, and
Parallel/Distributed Computing (SNPD ’07), vol. 1, pp. 817–
822, Qingdao, China, July-August 2007.
[17] S. Chen and N. Yang, “Congestion avoidance based on
light-weight buffer management in sensor networks,” IEEE
Transactions on Parallel and Distributed Systems, vol. 17, no.
9, pp. 934–946, 2006.
[18] L. Galluccio, A. T. Campbell, and S. Palazzo, “CONCERT:
aggregation-based congestion control for sensor networks,”
in
Proceedings of the 3rd ACM International Conference on
Embedded Networked Sensor Systems (SenSys ’05), pp. 274–
275, San Diego, Calif, USA, November 2005.
[19] J. W. Gardner, V. K. Varadan, and O. O. Awadelkarim,
Microsensors, MEMS and Smart Devices,JohnWiley&Sons,
New York, NY, USA, 2001.
[20] J. L. Hill and D. E. Culler, “Mica: a wireless platform for deeply
embedded networks,” IEEE Micro, vol. 22, no. 6, pp. 12–24,
2002.
[21] “The network simulator–ns-2,” />