Báo cáo hóa học: " Research Article Throughput Analysis of Band-AMC Scheme in Broadband Wireless OFDMA System" pptx
Bạn đang xem bản rút gọn của tài liệu. Xem và tải ngay bản đầy đủ của tài liệu tại đây (795.8 KB, 8 trang )
Hindawi Publishing Corporation
EURASIP Journal on Wireless Communications and Networking
Volume 2009, Article ID 147231, 8 pages
doi:10.1155/2009/147231
Research Article
Throughput Analysis of Band-AMC Scheme in Broadband
Wireless OFDMA System
Sung K. Kim
1
and Chung G. Kang
2
1
Electronics and Telecommunication Research Institute, Korea 138 Gajeongno, Yuseong-Gu, Daejeon 305-700, South Korea
2
School of Electrical Engineering, Korea University, 5-1, Anam-dong, Sungbuk-Ku, Seoul 136-701, South Korea
Correspondence should be addressed to Chung G. Kang,
Received 1 August 2008; Revised 26 December 2008; Accepted 23 February 2009
Recommended by Yan Zhang
In broadband wireless Orthogonal Frequency Division Multiple Access (OFDMA) systems where a set of subcarriers are shared
among multiple users, the overall system throughput can be improved by a band-AMC mode that assigns each suband, a set
of contiguous subcarriers within a coherence bandwidth, to individual user with the better channel quality. As long as channel
qualities for the subbands of all users are known a priori, multiuser and multiband gains can be simultaneously achieved with
opportunistic scheduling. This paper presents an analytical means of evaluating the maximum system throughput for a band-
adaptive modulation and coding (AMC) mode under the various system parameters. In particular, the practical features of
resource management for OFDMA system are carefully modeled within the current analytical framework. Our numerical results
demonstrate that band-AMC mode outperforms the diversity mode only by providing the channel qualities for a subset of good
subbands, confirming the multiuser and multiband diversity gain that can be achieved by the band-AMC mode.
Copyright © 2009 S. K. Kim and C. G. Kang. This is an open access article distributed under the Creative Commons Attribution
License, which permits unrestricted use, distribution, and reproduction in any medium, provided the original work is properly
cited.
1. Introduction
Demands for high bandwidth multimedia information in
the mobile environment have spawned the development of
various mobile broadband wireless access (BWA) systems for
high-speed communication. Particular examples include the
mobile WiMAX, which is based on the IEEE 802.16e Mobile
Wireless MAN technologies, and 3GPP’s new standards for
3G long-term evolution (LTE). The IEEE 802.16e standard
aims to unify the underlying solutions [1], specifying two
flavors of OFDM systems: one simply identified as Orthog-
onal Frequency Division Multiplexing (OFDM), the other
Orthogonal Frequency Division Multiple Access (OFDMA).
OFDMA is considered to be one of the most spectrally
efficient multiple access alternatives for mobile BWA systems.
It has the ability to dynamically assign a subset of the
subcarriers to individual users, attuning the technology to
the particular mobility requirement. This scheme fully takes
advantage of multiuser diversity, in conjunction with the
frequency diversity inherent in the OFDM scheme. In fact,
the mobile BWA system must contend with fluctuations
across the frequency band, in addition to time variations.
In the multiuser scenarios upon a multicarrier system, a
subcarrier in deep fading to one user may be of good
quality to another user, which lends support to dynamic
subcarrier allocation on improving system throughput [2–
5]. The different signal quality (e.g., carrier-to-interference
ratio or CIR) seen at each subcarrier governs the capacity of
each subcarrier. Ideally, a different modulation and coding
level should be selected for each subcarrier in order to
maximize the capacity. This particular approach is referred
to as an adaptive modulation and coding (AMC) scheme.
For the fast selective AMC scheme, Channel Quality
Indication (CQI) must be reported immediately for all
subcarriers within the entire bandwidth, which allows for
selecting the appropriate modulation and coding level for
each subcarrier without incurring a channel mismatching
problem. It usually involves unrealistic feedback overhead,
especially under the fast fading channel. Fortunately, how-
ever, recent broadband measurements indicate that per-
subcarrier information is typically not necessary [2]. Namely,
the feedback coefficient is sufficient for a group of several
subcarriers in the fast selective AMC process, while the
coherence bandwidth of the channel is larger than that of
2 EURASIP Journal on Wireless Communications and Networking
subband. In general, further enhancement can be realized by
providing CQI reports a set of optimum subcarriers. This
particular approach is specified as a band-AMC mode in
IEEE 802.16 Task Group e standard. Due to the frequency-
selective characteristics of a time-varying nature in the
broadband channel, it is not straightforward to evaluate the
average throughput of the OFDMA system, without resort-
ing to the computer simulation. Furthermore, it becomes
more involved as many parameters are configured to opti-
mize system performance. For example, the number of bands
selected for reporting CQI information is one important
parameter that governs overall average system throughput.
The objective of this paper is to develop an analytical
means of evaluating the maximum system throughput
of band-AMC mode. In particular, practical features of
resource management for the OFDMA system are carefully
modeled within the proposed analytical framework. We
consider order statistics to model the statistical nature of
multiuser/multiband diversity in the OFDMA system. Order
statistics have been a unique research area for statisticians for
some time, with special application in statistical estimation.
Recently, a more general case of order statistics has captured
the attention of researchers in the area of signal processing
and wireless communication systems [6, 7].
The remainder of this paper is organized as follows. In
Section 2, the operational concept of band-AMC mode, is
described, formulating the scheduling problem under con-
sideration. In Section 3, the maximum average throughput
of the band-AMC system is derived, using the order statistics.
Then, Section 4 presents the numerical results to demon-
strate the advantage of using the band-AMC mode with the
sufficient number of CQI reports for the selection bands.
Furthermore, the maximum throughput bounds that depend
on the multi-user diversity and multiband effect are pro-
vided. Finally, concluding remarks are provided in Section 5.
2. System Description
2.1. Diversity Mode versus Band-AMC Mode. In the OFDMA
system, all available subcarriers are shared by multiple users
in each symbol, as opposed to the OFDM system where all
subcarriers must be assigned to a single user. In general, the
advantage of the OFDMA system is the multiuser diversity
gain that can be obtained by selecting only good subcarriers
for individual user, so as to fill the whole band with the
multiple users. In other words, a “water-pouring” type of
adaptive subcarrier and bit allocation algorithms can be
evoked for maximizing system capacity [8]. However, this
involves reporting the channel quality indicator (CQI) for
each subcarrier of every user. In practice, it may cost a
prohibitive amount of overhead, especially under the fast
fading channel condition in the mobile communication.
Instead, a subset of subcarriers can be randomly selected in
each symbol, which can warrant a frequency diversity effect
over a frequency-selective fading channel. Toward this end, a
subchannel is defined as a basic unit of resource allocation,
which consists of a finite number of subcarriers, for example,
48 subcarriers in the IEEE 802.16e standard.
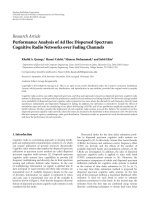
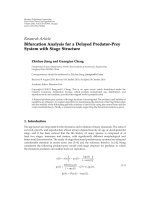
Data subcarrier index
Subchannel i Subchannel j ··· Subchannel k
···
···
···
···
(a) Diversity subchannels
Data subcarrier inde
x
Subchannel i
Subchannel j
···
···
···
Subchannel k
Symbol index
··· Band MBand 1
(b) Band-AMC subchannels
Figure 1: Construction of diversity and band-AMC subchannels.
Two di fferent types of subchannel allocation modes are
defined in the IEEE 802.16e OFDMA specifications: diversity
and band-AMC modes. As shown in Figure 1, the difference
between these two modes depends on how subcarriers are
selected to form a subchannel. In the diversity mode, the
sub-carriers belonging to a subchannel are randomly dis-
tributed over the entire bandwidth, facilitating the frequency
diversity effect over a frequency-selective fading channel in
the broadband OFDMA system. In this case, the channel
quality of each subchannel is determined by taking the
average SNR over all corresponding subcarriers. In the band-
AMC mode, on the other hand, a subchannel consists of
a set of contiguous subcarriers and furthermore, a whole
channel bandwidth can be divided into the multiple number
of subbands (also, referred to as a band for short in the
sequel). A finite number of contiguous subchannels form
a subband, which spreads within the coherence bandwidth,
thus requiring only a single value of CQI for each band
to specify the channel condition. Therefore, the band-AMC
mode does not incur too much feedback overhead cost,
especially when a channel condition does not change too
rapidly as in a fixed or low mobility environment [3]. It is
opposed to the diversity mode which is more appropriate to
mobile application under the fast fading channel condition.
2.2. Multiple-Access Interference and CIR Distribution. For
users with similar propagation environments, the mean
carrier-to-interference ratio can be represented as
C
I
=
βP
T
/
r
d
/r
0
n
i
/
= d
βP
T
/
r
i
/r
0
n
=
r
−n
d
i
/
= d
r
−n
i
,(1)
where the r
∗
is the distance separating the transmitter from
the receiver and the subscript d denotes the desired user and
i
/
= d corresponds to the interfering cochannel users, β is the
EURASIP Journal on Wireless Communications and Networking 3
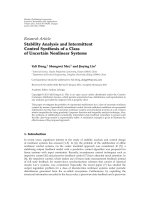
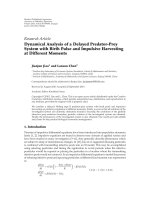
Base station
Subscriber stations
Packet
scheduler
Band CQI reports
Data queues
(C/I)
(C/I)
(C/I)
1
2
CQI ch.
(multi-user
/multi-band
allocation)
N
.
.
.
.
.
.
.
.
.
.
.
.
Band 1
Band 2
Band M
f
Figure 2: Band-AMC system model.
loss at distance r
0
,andn is a pathloss exponent that depends
on the propagation environment.
If channel measurements are taken at a number of
random locations, then the received amplitude typically
follows a Rayleigh distribution. Assuming that instantaneous
interference is constant, a carrier-to-interference ratio for
each subband is shown to be exponentially distributed in
a frequency nonselective channel. In particular, if γ
0
is the
mean value of the carrier-to-interference ratio at a specified
distance r
d
from the transmitter, then the distribution of
the observed carrier-to-interference ratio γ has the following
probability density function [9]:
f
γ
=
⎧
⎪
⎨
⎪
⎩
1
γ
0
e
−γ/γ
0
, γ ≥ 0,
0, otherwise.
(2)
2.3. Multi-user and Multi-band Scheduling Problem. Assume
that there are N active users in a band-AMC system
with M subbands. Figure 2 illustrates a system model of a
downlink band-AMC scheduler with multiple bands that
are shared among the different users. Based on CQI for an
individual subband, a packet scheduler in the base station
must determine which band to be assigned to each user along
with the corresponding MCS level. A reasonable amount of
resources must be reserved for CQI report, while ensuring
that too much overhead does not overwhelm the overall
system efficiency. Meanwhile, in the case that the number of
band-AMC users is not sufficiently large in each cell, multi-
user and multi-band diversity gain tends to be strictly lim-
ited, degrading the overall system throughput performance.
Therefore, an optimum portion of band-AMC region must
be configured in each frame. In sequel, however, we just focus
on the scheduling problem, assuming that some portion of
frame is reserved solely for the band-AMC mode users.
Note that each user experiences a varying channel quality
for each band. Let γ
i,j
be the carrier-to-interference ratio
(CIR) of the band j for the user i. We assume that each user
measures the CQI for all bands in terms of the CIR
{γ
i,j
}
and then selects a preferred subset of bands with the μ-best
CIR’s (μ
= 1, 2, , M) for the CQI feedback. The partial
CQI report reduces the feedback overhead cost while trading
off the throughput performance. Some users may select the
same band within the same time slot. Let Ω
j
denote a set
of users who have chosen the band j in their CQI reports
in the same frame. We assume that the packet scheduler is
designed to select a single user for each band so that the
overall bandwidth utilization can be maximized, that is,
i
∗
j
= arg max
i∈Ω
j
γ
i,j
for j = 1, ,M. (3)
This particular scheduler, frequently referred to as a max C/I-
scheduler, is one of the most typical opportunistic packet
schedulers in the broadband wireless mobile systems.
3. System-Level Performance Analysis
In this section, the average throughput performance of the
band-AMC system is evaluated. It is assumed that a full
buffer traffic model is used, that is, infinite traffic waiting
for each user. Depending on the channel quality, it is
assumed that each user belongs to one of L groups. The
channel quality of all users in the same group is identically
distributed. Let B
t
and B
c
represent the total bandwidth and
coherence bandwidth, respectively. Then, the total number
of independent subbands can be given approximately by
M
=B
t
/B
c
. Note that the optimal number of subbands
may be greater than or equal to
B
t
/B
c
. For example, it has
been demonstrated in [5] that the optimum contribution
to performance improvement is found for B
c
≈ 4 · B
s
,
where B
s
denotes the bandwidth of subband. Nevertheless,
M
can be still fixed to the minimum number of independent
subbands, that is, M
is just large enough to warrant the
independence of channel qualities between the adjacent
4 EURASIP Journal on Wireless Communications and Networking
subbands. Determining a proper M
is beyond the scope of
this paper.
Now let a vector γ
(l)
i
={γ
(l)
i,1
, γ
(l)
i,2
, , γ
(l)
i,M
} represent
the sampled values of a channel quality for user i in group
l. Note that M
is not always necessarily equal to M.
Therefore, we consider two different cases: M<M
and
M
= M
. For the case of M = M
, there is no correlation
between those samples, that is, the channel quality for each
subband is independent of each other. Denoting m
(l)
j
as
the expected value of CIR for band j in group l, then the
following probability density function (PDF) for CIR of the
corresponding band under the condition that M
= M
can
be obtained:
f
γ
(
l
)
i,j
γ
=
1
m
(
l
)
j
e
−γ/m
(
l
)
j
. (4)
For the diversity channel, meanwhile, CIR for each user i
in group l is given by taking average of CIRs for all subbands,
that is,
γ
(l)
i
= (1/M
)
M
j=1
γ
(l)
i,j
. In the case that γ
(l)
i,j
are
identically distributed over a whole bandwidth,
{γ
(l)
i
} turns
out to be the normalized M
-Erlang random variables.
The design of band-AMC system depends on the band-
width of each subband, channel characteristics, the number
of users served by band-AMC mode, the feedback overhead
to report the CQI of subbands, and so on. Consider the
situation that the bandwidth of subband, B
s
, chosen by band-
AMC system is subject to the nonflat fading characteristics.
This particular situation can be specified by B
t
/M ≈ g × B
c
for g>1, which corresponds to the case of M<M
. Then,
the observed channel quality for each subband cannot be
represented by (4). When the bandwidth B
s
is divided into
several adjacent segments, each with the bandwidth of B
c
,
it can be now approximated as Γ
(l)
i,j
≈ (1/g)
g
k
=1
γ
(l)
i,(j
−1)·g+k
,
j
= 1, 2, ,[M
/g]. Then, (4) is replaced with the following
PDF:
f
Γ
(
l
)
i,j
γ
=
g ·
f
γ
(l)
i,(j
−1)·g+1
(x) ∗ f
γ
(l)
i,(j
−1)·g+2
(x) ∗··· f
γ
(l)
i,j
·g
(x)
x=g·γ
,
(5)
where
∗ denotes the convolution operation: x(t) ∗ h(t) =
∞
0
x(τ)h(t − τ)dτ.
3.1. CQI Report for Band-AMC Mode. Suppose that every
band-AMC user feedbacks μ-best CQI reports to the base
station in every scheduling interval. To represent the chance
that each subband is selected for feedback, define a band
selection vector for user i as follows:
Λ
(
l
)
i
μ
=
λ
(
l
)
i,1
μ
, λ
(
l
)
i,2
μ
, , λ
(
l
)
i,M
μ
,(6)
where λ
(l)
i,j
(μ) is the probability that user i in group l
has a preference to the band j within μ chances, that is,
M
j
=1
λ
(l)
i,j
(μ) = μ. In the case that samples in the subband
are independent and identically distributed, it is obvious
that Λ
(l)
i
(μ) ={μ/M, μ/M, , μ/M}. However, consideration
must be taken, that the dependence assumption is retained
when the γ’s are no longer identically distributed, that is, for
the inid case.
Let F
(l)
i,(μ:M
−{ j})
(γ; F) denote the CDF of μth-order statis-
tics, exclusive of band j within the entire band pool, where M
represents a band set of the system, that is, M
={1, 2, , M}.
Hence, the probability that the user i in group l selects the
band j is given by
λ
(l)
i,j
μ
=
Pr
γ
(l)
i,j
>γ
(l)
i,(M
−μ:M−{ j})
=
∞
0
F
(l)
i,(M
−μ:M−{ j})
γ; F
f
γ
(
l
)
i,j
γ
dγ,
for 1
≤ μ ≤ M − 1.
(7)
The CDF of the kth-order statistic γ
(k)
is generalized to
F
(k:M)
γ; F
=
M
i=k
S
i
i
l=1
F
j
l
γ
M
l=i+1
1 − F
j
l
γ
,(8)
where the summation S
i
extends over all permutations
(j
1
, , j
n
)of1, , n for which j
1
< ··· <j
i
and j
i+1
<
··· <j
n
[10]. For the distribution of order statistics in
the inid case, however, the density of every possible order
must be found out separately on a case-by-case basis, which
makes (8) involve the complicated and tedious calculation,
especially as the number of bands increases. Fortunately,
an alternative method for computing F
(k:M)
(γ; F)hasbeen
provided by Cao and West [7]. It is acceptable to have results
and recurrence relations valid in the iid case, requiring only
simple modification to hold quite generally. For convenience
of notation, let 1
− F
i
(γ) denote the F
i
(γ). Starting with
F
1:m
γ
=
1 −
m
i=1
F
i
γ
,(9)
they prove the following relation:
F
k:m
γ
=
F
k−1:m
γ
−
H
k
γ
1 − F
1:m
γ
, (10)
where H
1
(γ) = 1, and
H
k
γ
=
1
k − 1
k−1
i=1
(−1)
i+1
L
i
H
k−i
for k = 2, , m (11)
with
L
k
=
m
i=1
F
i
γ
F
i
γ
k
. (12)
Now from (7)and(9)–(12), the band selection vector can be
directly determined. It is obvious that Λ
(l)
i
(μ) ={1, 1, ,1}
is obtained with μ = M, which corresponds to the case of full
CQI feedback.
3.2. Maximum System Throughput in Band-AMC Mode.
Let n
l
denote the total number of users in group l.The
EURASIP Journal on Wireless Communications and Networking 5
probability that band j is simultaneously selected by x
(l)
j
users
can be written as follows:
Pr
x
(
l
)
j
= x
=
n
l
C
x
·
λ
(
l
)
i,j
x
·
1 − λ
(
l
)
i,j
n
l
−x
, (13)
where
n
l
C
x
= n
l
!/x!(n
l
− x)!.
Similarly, a vector x
j
= [x
(1)
j
, x
(2)
j
, , x
(L)
j
]isdefined
to represent the distribution of order statistics in the
corresponding band j. By means of the max C/I-scheduling
scheme, the received signal quality γ
∗
j
is then expressed as
γ
∗
j
= max
γ
γ
(
1
)
1,j
, γ
(
1
)
2,j
, , γ
(
1
)
x
1,j
,j
, γ
(
2
)
1,j
, γ
(
2
)
2,j
, ,
γ
(
2
)
x
2,j
,j
, , γ
(
L
)
1,j
, γ
(
L
)
2,j
, , γ
(
L
)
x
L,j
,j
.
(14)
In general, the optimum signal quality in band j is
expected as the number of users selecting the corresponding
band increases. By order statistics, the conditional CDF of the
received CIR in band j given x
j
can be calculated as
Pr
γ
∗
j
<γ| x
j
=
Pr
γ
(1)
1,j
<γ
···
Pr
γ
(1)
x
1,j
,j
<γ
···
Pr
γ
(L)
1,j
<γ
···
Pr
γ
(L)
x
L,j
,j
<γ
=
L
l=1
Pr
γ
(
l
)
∗,j
<γ| x
(l)
j
,
(15)
where γ
(l)
∗,j
= max
γ
{γ
(l)
1,j
, γ
(l)
2,j
, , γ
(l)
x
i,j
,j
} and
Pr(γ
(
l
)
∗,j
<γ| x
(
l
)
j
) =
F
(
l
)
j
γ
x
(
l
)
j
. (16)
Therefore, the CDF of the received CIR in band j can be
expressed as
S
j
γ
=
Pr
γ
∗
j
<γ
=
∀x
j
Pr
x
j
=
x
(
1
)
j
, x
(
2
)
j
, , x
(L)
j
·
L
l=1
Pr
γ
(
l
)
∗,j
<γ| x
(l)
j
.
(17)
When the existing cellular systems are considered, in which
multi-path fading is dominant, the rate function of the
Shannon type with the log-based linear relationship between
rate and CIR may not be valid. In practice, a link-level
simulation is performed in order to determine the required
CIR for a given data rate, so as to meet the target frame
error rate (FER). Let A denote a set of MCS levels with the
corresponding data rates
{R
m
}, with the data rate for MCS
level m defined by R
m
. To meet the given level of FER, a range
of CIR is prescribed for each data rate R
m
.Morespecifically,
the CIR required for R
m
is prescribed as Γ
m
≤ γ
∗
j
≤ Γ
m+1
.For
the given target FER, the average system throughout of band
j is defined as follows:
U
j
=
m∈A
R
m
· Pr
Γ
m
≤ γ
∗
j
≤ Γ
m+1
=
m∈A
R
m
·
S
j
(
Γ
m+1
)
− S
j
(
Γ
m
)
.
(18)
Table 1: Basic OFDMA system parameters.
Parameters Value
Frequency 2.3 GHz
System bandwidth 8.75 MHz
FFT size 1024
Number of data subcarriers 768
Number of symbols per frame
Downlink: 27 symbols
Uplink: 15 symbols
Channel coding Convolutional turbo code
Frame duration 5 ms
Symbol duration 115.2 μs
Number of subcarriers per subchannel 48
Number of subcarriers per CQI channel 48
Considering overall bandwidth, therefore, the average
throughput of band-AMC system is provided by U
=
M
j
=1
U
j
.
4. Numerical Results
Extensive numerical solutions are studied for evaluating a
theoretical system throughput in this section. The multi-
users diversity effectonsystemlevelperformanceare
investigated by varying the number of user groups, for
example, L
= 1, 3. For L = 3, users are divided
into 3 groups with a mix of 0.2:0.3:0.5. Furthermore, the
number of total active users ranges from 10 to 70, that is,
N
= 10, , 70. We consider the OFDMA parameters for
the WiBro system, a mobile version of WiMAX, derived
from the IEEE 802.16d wireless MAN standard [1]. The
corresponding parameters are listed in Ta ble 1 . Furthermore,
an example of the transmission scheme for AMC under
investigation is summarized in Table 2 .InTa bl e 2,datarate
R
m
is for downlink transmission when the ratio of DL:UL is
given by 27:15. It also specifies the minimum required CIR
to achieve a target FER of 1%.
It is important to note that system throughput is
dependent on not only the mean channel quality but also
in the user distribution. In the current numerical analysis,
we consider the scenarios with the mean channel qualities
given by m
1
= (9.1dB), m
3
= (12 dB, 10 dB, 6 dB) for
L
= 1andL = 3, respectively. To impartially compare
the performance according to various users’ distributions,
the mean channel quality on the same overall cases needs
to be kept. Furthermore, it is assumed that M
= 12 while
M
= 12, 6, and 3, respectively.
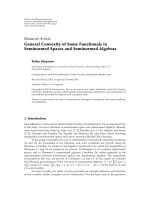
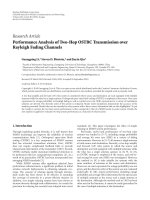
Figures 3 and 4 present a comparison of average through-
out for the band-AMC and diversity schemes by varying the
number of users with M
= 12 for L = 1andL = 3,
respectively. From these results, a multiuser diversity gain
is clearly observed, that is, the system throughput increases
with the number of users in the system. Furthermore, it is
shown that the band-AMC mode outperforms the diversity
mode, when each user provides a sufficient number of band
CQI reports. For the results in Figure 3, more than 20% of
throughput is improved by the band-AMC mode with a full
6 EURASIP Journal on Wireless Communications and Networking
Table 2: Transmission modes for AMC.
MCS level m Modulation Coding rate CIR for 1% FER (dB) Data rate
∗
R
m
(kbps)
1QPSK1/12−2.2 614.4
2 QPSK 1/6 0.1 1,228.8
3 QPSK 1/3 2.9 2,457.6
4 QPSK 1/2 6.0 3,686.4
5 QPSK 2/3 10.2 4,915.2
6 16QAM 1/2 10.9 7,372.8
7 16QAM 2/3 15.2 9,830.4
8 64QAM 2/3 20.2 14,745.6
9 64QAM 5/6 28.6 18,432
∗
Data Rate R
m
is for DL transmission when the ratio of DL:UL is given by 27:15.
0
1000
2000
3000
4000
5000
6000
7000
8000
9000
10000
11000
Throughput (Kbps)
010203040506070
The number of users
Diversity
Band-AMC (μ
= 6)
Band-AMC (μ
= 4)
Band-AMC (μ
= 2)
Band-AMC (μ
= 12)
Band-AMC (μ
= 5)
Band-AMC (μ
= 3)
Band-AMC (μ
= 1)
Figure 3: Average system throughput performance: L = 1.
CQI report, that is, μ = 12, over the diversity mode. For a
partial band CQI report of μ
≤ 3, however, the band AMC
mode performs worse than the diversity mode, suffering
from a significant performance loss as compared to that
with full band CQI feedback. For μ>3, the band-AMC
mode outperforms the diversity mode as long as there are
asufficient number of users, implying that its performance is
mainly governed by the multi-user diversity gain.
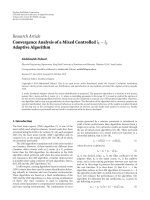
As for L
= 3, it is observed from Figure 4 that not much
multiuser gain can be achieved with the diversity mode. We
note that band-AMC mode is almost always superior to the
diversity mode, even with a very small number of band CQI
reports, as long as there are sufficient number of users in
the system. It is also found that the maximum multiuser
and multiband diversity gain has been achieved by the band-
AMC mode, corresponding to an increase in the average
throughput of 2.54 Mbps.
0
1000
2000
3000
4000
5000
6000
7000
8000
9000
10000
11000
Throughput (Kbps)
010203040506070
The number of users
Diversity
Band-AMC (μ
= 12)
Band-AMC (μ
= 6)
Band-AMC (μ
= 5)
Band-AMC (μ
= 4)
Band-AMC (μ
= 3)
Band-AMC (μ
= 2)
Band-AMC (μ
= 1)
Figure 4: Average system throughput performance: L = 3.
Let us now consider a CQI signaling overhead cost
associated the band-AMC mode. If the CQI report period
is 30 milliseconds, overhead for full band CQI feedback in
WiBro can be approximated by 0.0694N
·μ(%). For example,
feedback overhead in the uplink becomes 10.41% when N
=
30 and μ = 5. In Figures 3 and 4, note that a diminishing gain
is observed as the number of band CQI reports increases.
Taking the overhead associated with the CQI report for each
band into account, a reasonable number of CQI reports exists
to warrant the maximum system throughput, for example,
μ
= 5 and 6, with a sufficient number of band-AMC users.
Adopting the same test parameters as in Figure 4, the mean
channel quality of each band for each group is given by
Figure 5.
Figure 6 presents the probability that each subband is not
chosen by any user, that is, the probability of unfilled band,
computed for the cases of iid and inid,respectively.From
EURASIP Journal on Wireless Communications and Networking 7
−2
0
2
4
6
8
10
12
14
Mean channel quality (dB)
123456789101112
Band index
Group 1
Group 2
Group 3
Mean: 9.1dB
Figure 5: Example of mean channel quality: L = 3.
0
0.1
0.2
0.3
0.4
0.5
0.6
0.7
0.8
0.9
1
The probabity of unfilled band
0 102030405060
The number of users
No. CQI
= 1 (inid)
No. CQI
= 2 (inid)
No. CQI
= 3 (inid)
No. CQI
= 6 (inid)
No. CQI
= 2 (iid)
No. CQI
= 3 (iid)
No. CQI
= 6 (iid)
Figure 6: The probability of unfilled band: L = 3.
a practical viewpoint, depending on the amount of band
CQI reports for each user and the number of users, some
subbands may be not selected such that a part of bandwidth
is wasted. This particular point is obviously observed in
Figure 6. When N
= 10 and μ ≤ 6, more than 40% of the
entire bandwidth is not used. Furthermore, it is found that
there is not much difference between the iid case and inid
case.
Figure 7 presents a throughput performance as varying
the number of bands, that is, M
= 3, 6, and 12, when
L
= 1andμ = M. As expected, the band-AMC system with
12 bands demonstrates the best throughput performance.
Meanwhile, as the number of bands decreases, throughput
curves approach that of the diversity scheme. Since the multi-
band diversity effect mainly depends on the number of
5000
6000
7000
8000
9000
10000
Throughput (Kbps)
10 20 30 40 50
The number of users
Diversity
Band-AMC (M
= 12)
Band-AMC (M
= 6)
Band-AMC (M
= 3)
Figure 7: Average system throughput performance as varying the
number of bands available(L
= 1,M = μ).
independent subbands, note that no further improvement
will be found even if M is greater than M
.
5. Conclusions
In this paper, the maximum possible throughput of the
band-AMC mode in the OFDMA system has been numer-
ically evaluated using the order statistics for various system-
level parameters, including the number of band CQI reports,
the total number of available bands, and mean channel
qualities. A conventional system-level simulation involves
too much complexity associated with various physical
parameters and thus the proposed analytical approach will
be useful for dimensioning the system and configuring the
optimal set of parameters. Our numerical results confirm
the multiuser and multiband diversity gain that can be
achieved by the band-AMC mode. It has been shown that
the band-AMC mode outperforms the diversity mode only
by providing the channel qualities for a subset of good
subbands. Depending on the average CINR for each subband
and how fast the channel varies for individual subband,
for example, measured in terms of standard deviation of
CINR for each subband, the band-AMC and diversity modes
can be adaptively combined, so as to maximize the overall
system throughput. Toward that end, the current analytical
framework can be a useful basis for operation of the band-
AMC mode under the varying traffic and CQI report
constraints.
References
[1] IEEE Standard 802.16-2004, “IEEE Standard for local and
metropolitan area networks Part 16: Air Interface for Fixed
Broadband Wireless Access Systems”.
[2] B. Classon, P. Sartori, V. Nangia, X. Nangia, and K. Baum,
“Multi-dimensional adaptation and multi-user scheduling
8 EURASIP Journal on Wireless Communications and Networking
techniques for wireless OFDM systems,” in Proceedings of IEEE
International Conference on Communications (ICC ’03), vol. 3,
pp. 2251–2255, Anchorage, Alaska, USA, May 2003.
[3] P. Song and L.Cai, “Multi-user subcarrier allocation with min-
imum rate requests for downlink OFDM packet transmission,”
in Proceedings of the 59th IEEE Vehicular Technology Conference
(VTC ’04), vol. 4, pp. 1920–1924, Milan, Italy, May 2004.
[4] G. Song, Y. Li, L. J. Cimini Jr., and H. Zheng, “Joint
channel-aware and queue-aware data scheduling in multiple
shared wireless channels,” in Proceedings of IEEE Wireless
Communications and Networking Conference (WCNC ’04), vol.
3, pp. 1939–1944, Atlanta, Ga, USA, March 2004.
[5] S. Yoon, C. Suh, Y. Cho, and D. S. Park, “Orthogonal frequency
division multiple access with an aggregated sub-channel
structure and statistical channel quality measurement,” in
Proceedings of the 60th IEEE Vehicular Technology Conference
(VTC ’04), vol. 2, pp. 1023–1027, Los Angeles, Calif, USA,
September 2004.
[6] A. Harel and H. Cheng, “Applications of order statistics to
queueing and scheduling,” in Proceedings of the 34th IEEE
Conference on Decision and Control (CDC ’95), vol. 1, pp. 847–
852, New Orleans, La, USA, December 1995.
[7] G. Cao and M. West, “Computing distributions of order
statistics,” Communications in Statistics: Theory and Methods,
vol. 26, no. 3, pp. 755–764, 1997.
[8] K. M. Ok and C. G. Kang, “Complexity-reduced adaptive
subchannel, bit, and power allocation algorithm and its
throughput analysis for cellular OFDM system,” IEICE Trans-
actions on Communications, vol. E90, no. 2, pp. 269–276, 2007.
[9] W. C. Jakes, MicrowaveMobileCommunications, John Wiley &
Sons, New York, NY, USA, 1994.
[10] H. A. David and H. N. Nagaraja, Order Statistics,JohnWiley
& Sons, New York, NY, USA, 2003.