Báo cáo hóa học: " Research Article Cross-Layer Resource Scheduling for Video Traffic in the Downlink of OFDMA-Based Wireless 4G Networks" docx
Bạn đang xem bản rút gọn của tài liệu. Xem và tải ngay bản đầy đủ của tài liệu tại đây (1.07 MB, 10 trang )
Hindawi Publishing Corporation
EURASIP Journal on Wireless Communications and Networking
Volume 2009, Article ID 212783, 10 pages
doi:10.1155/2009/212783
Research Article
Cross-Layer Resource Scheduling for Video Traffic in
the Downlink of OFDMA-Based Wireless 4G Networks
FerozA.Bokhari,
1
Halim Yanikomeroglu,
1
William K. Wong,
2
and Mahmudur Rahman
1
1
Broadband Communications and Wireless Systems Centre, Department of System and Computer Eng ineering, Carleton University,
Ottawa, ON, Canada K1S 5B6
2
Terrestrial Wireless Systems Branch, Communication Research Centre of Canada, 3701 Carling Avenue, P.O. Box 11490 Station H,
Ottawa, ON, Canada K2H 8S2
Correspondence should be addressed to Mahmudur Rahman,
Received 27 June 2008; Accepted 30 December 2008
Recommended by Zhu Han
Designing scheduling algorithms at the medium access control (MAC) layer relies on a variety of parameters including quality
of service (QoS) requirements, resource allocation mechanisms, and link qualities from the corresponding layers. In this paper,
we present an efficient cross-layer scheduling scheme, namely, Adaptive Token Bank Fair Queuing (ATBFQ) algorithm, which is
designed for packet scheduling and resource allocation in the downlink of OFDMA-based wireless 4G networks. This algorithm
focuses on the mechanisms of efficiency and fairness in multiuser frequency-selective fading environments. We propose an adaptive
method for ATBFQ parameter selection which integrates packet scheduling with resource mapping. The performance of the
proposed scheme is compared to that of the round-robin (RR) and the score-based (SB) schedulers. It is observed from simulation
results that the proposed scheme with adaptive parameter selection provides enhanced performance in terms of queuing delay,
packet dropping rate, and cell-edge user performance, while the total sector throughput remains comparable. We further analyze
and compare achieved fairness of the schemes in terms of different fairness indices available in literature.
Copyright © 2009 Feroz A. Bokhari et al. This is an open access article distributed under the Creative Commons Attribution
License, which permits unrestricted use, distribution, and reproduction in any medium, provided the original work is properly
cited.
1. Introduction
The approaching fourth-generation (4G) wireless commu-
nication systems, such as the Third-Generation Partnership
Project’s Long Term Evolution (3GPP LTE) [1] and the IEEE
802.16 standards family (e.g., [2]), are projected to provide a
wide variety of new multimedia services, ranging from high
quality voice to other high-data-rate wireless applications.
Another notable 4G wireless effort is the WINNER project,
which aims to develop an innovative concept in radio access
in order to achieve high flexibility and scalability with
respect to data rates and radio environments [3]. Concepts
developed in the WINNER project are applicable to evolving
4G standards due to common system considerations such as
orthogonal frequency-division multiple access- (OFDMA-)
based air interface, and support of relays and multiple-
antenna configurations.
Unlike wireline networks, wireless resources are scarce.
The data-rate capacity that a radio-frequency channel can
support is limited by Shannon’s capacity law. Moreover, due
to the time-varying nature of wireless channel, radio resource
management, especially packet scheduling and resource
allocation, is crucial for wireless networks. Traditionally,
the research on packet scheduling has emphasized QoS
and fairness issues, and opportunistic scheduling algorithms
have focused on exploiting the time-varying nature of the
wireless channels in order to maximize throughput. This
segregation between packet scheduling and radio resource
allocation is inefficient. As fairness and throughput are
reciprocally related, an intelligent compromise is necessary
to obtain the required QoS while exploiting the time-
varying characteristics of the wireless channel. Therefore,
it is important to merge the packet scheduling and the
resource allocation to design a cross-layer scheduling scheme
[4].
A number of scheduling schemes in the literature analyze
physical- (PHY-) and MAC-related design issues by assuming
that all users are backlogged, that is, all users in the system
2 EURASIP Journal on Wireless Communications and Networking
have nonempty buffers. However, it is shown in [5] that
this assumption is not always correct, since the number of
packets in the buffers can vary significantly, and there is a
relatively high probability that the buffers are empty. For
example, in time-slotted networks, the packets in the queues
are aggregated into time slots. Consequently, empty queues
and partially filled time slots will affect the system per-
formance. Furthermore, these non-queue-aware scheduling
algorithms lack the capability to provide required fairness
among user terminals (UTs). Hence, it becomes necessary to
consider queue states in scheduling and resource allocation
[6].
In recent years, some schemes have considered inte-
grating packet scheduling and radio resource scheduling
into queue and channel aware scheduling algorithms. In
[7], a weighted fair queuing (WFQ) scheduling scheme is
proposed, where the largest share of the radio resources
is given to the users with the best instantaneous channel
conditions in a code division multiplexing (CDM-) based
network. Another example of a queue- and channel-aware
scheduling algorithm is the modified-largest weighted delay
first (M-LWDF) algorithm, where priorities are given to
the users with maximum queuing delays weighted by
their instantaneous and average rates [8]. The associated
decision metrics in these schemes are based on the com-
bination of the delay and instantaneous channel rates.
Finding an optimal metric based on these parameters is
difficult due to varying requirements for different service
classes.
In this paper, we present a scheduler which comprises
packet scheduling and resource mapping taking both queue
and channel states into account. In the first level of schedul-
ing (packet scheduling), users to be served are selected based
on the token bank fair queuing (TBFQ) algorithm, consid-
ering fairness and delay constraints among users. Although
TBFQ was originally proposed for single-carrier time-
division multiple access (TDMA) systems [9], it has been
modified in this study by introducing additional parameters
that adaptively interact with the second level of scheduling
(resource mapping). These parameters take into account the
network loading and the user channel conditions. Based
on these parameters, the second-level scheduler assigns
resources to the selected users in an adaptive manner that
exploits the frequency selectivity of the OFDMA air inter-
face. The modified combined scheduling scheme is called
ATBFQ.
The performance of ATBFQ is studied in the con-
text of the WINNER wide-area downlink scenario and is
compared to that of the SB scheduling algorithm (which
was the baseline scheduling scheme in WINNER) [10]
and the RR scheme by extensive simulations. The rest
of this paper is organized as follows. In Section 2, the
ATBFQ algorithm is described in detail, along with its
parameter selection. Methods of fairness assessment are
addressed in Section 3. The system model and the sim-
ulation parameters are presented in Section 4. Simulation
results are provided in Section 5, followed by conclusions in
Section 6.
2. ATBFQ Scheduling Algorithm
2.1. Original TBFQ Algorithm. The TBFQ algorithm was
initially developed for wireless packet scheduling in the
downlink of TDMA systems [9, 11], and was later modified
for wireless multimedia services using uplink as well. Its
concept was based on the leaky-bucket mechanism which
polices flows and conforms them to a certain trafficprofile.
Atraffic flow belonging to user i is characterized by the
following parameters:
λ
i
: packet arrival rate,
r
i
: token generation rate,
p
i
: token pool size,
E
i
: counter that keeps track of the number of tokens
borrowed from or given to the token bank by flow i.
Each L-byte packet consumes L tokens. For each flow i, E
i
is
a counter that keeps track of the number of tokens borrowed
from or given to the token bank. As tokens are generated at
rate r
i
, the tokens overflowing from the token pool (of size
p
i
bytes) are added to the token bank, and E
i
is incremented
by the same amount. When the token pool is depleted and
there are still packets to be served, tokens are withdrawn
from the bank by flow i,andE
i
is decreased by the same
amount. Thus, during periods when the incoming trafficrate
of flow i is less than its token generation rate, the token
pool always has enough tokens to serve arriving packets, and
E
i
increases and becomes positive and increasing. On the
other hand, during periods when the incoming trafficrate
of flow i is greater than its token generation rate, the token
pool is emptied at a faster rate than it can be refilled with
tokens. In this case, the connection may borrow tokens from
the bank. The priority of a connection in borrowing tokens
from the bank is determined by the priority index (P
i
), given
by
P
i
=
E
i
r
i
. (1)
By prioritizing in this manner, we ensure that flows
belonging to UTs that are suffering from severe interference,
and shadowing conditions in particular, will have a higher
priority index, since they will contribute to the bank more
often.
2.2. ATBFQ Algorithm. In this study, the TBFQ algorithm,
originally proposed for single carrier TDMA systems, is
improved by introducing adaptive parameter selection and
extended to suit the WINNER multicarrier OFDMA systems
[12]. The motivation behind this modification was to
incorporate the design and performance requirements of
the scheduler in 4G networks into the original scheme. In
such networks, the utilization of the resources and hence
the performance of the network can be enhanced by making
use of the multiuser diversity provided by the multiple
access scheme being used. Also, such networks support users
with high mobility. Therefore, in order to make use of the
EURASIP Journal on Wireless Communications and Networking 3
PHY
measurements
(SINR for every
UT for every
chunk)
SINR feedback
(frame j +1)
Scheduled chunks
(frame j)
Output
buffer
PHY
Service class 1
UT 1
UT 2
.
.
.
UT N
.
.
.
Scheduler
Service class n
UT 1
UT 2
.
.
.
UT N
Packets
(PFQ)
IP
layer
IP RLC + MAC
Chunks
Chunks
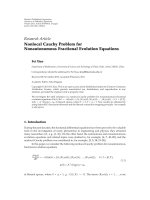
Figure 1: Overview of the proposed cross-layer scheduling opera-
tion.
channel feedback, faster scheduling (at a much smaller time
scale) is required. Another requirement is the ability to
maintain fairness and provide a minimum acceptable QoS
performance to all users.
The basic time-frequency resource unit in OFDMA is
denoted as a chunk. It consists of a rectangular time-
frequency area that comprises a number of subsequent
OFDM symbols and a number of adjacent subcarriers.
Packets from the trafficflowsareexclusivelymappedonto
these chunks based on QoS requirements obtained from the
higher radio link control (RLC) layer along with the channel
feedback received from the physical layer. The channel
feedback comprises signal-to-interference plus noise ratio
(SINR) which is measured in the downlink portion of the
frame j at the UTs, as shown in Figure 1. This feedback is then
provided to the BS in the uplink duration of the frame j +1
and can be utilized for scheduling purposes at the MAC layer
in the downlink of the next frame, j +2. The frame duration,
as mentioned in WINNER [13], is 0.6912 milliseconds. The
feedback is valid for two frame durations, which is less than
the coherence time for mobile speeds of up to 100 km/hr.
Like TBFQ, the ATBFQ scheduling principle is based
on the leaky-bucket mechanism. Each trafficflowi is
characterized by a packet arrival rate λ
i
,tokengeneration
rate r
i
, token pool size p
i
,andacounterE
i
to keep track of
the number of tokens borrowed from or given to the token
bank. Each L-byte packet consumes L tokens.Astokensare
generated at rate r
i
, the tokens overflowing from the token
pool are added to the token bank, and E
i
is incremented by
the same amount. When the token pool is depleted and there
are still packets to be served, tokens are withdrawn from the
bank by flow i,andE
i
is decremented by the same amount.
A debt limit d
i
is set as a threshold to limit the amount a
UT can borrow from the bank. It also acts as a measure
to prevent malicious UTs (transmitting at unusually high
transmission rates) from borrowing extensively. The packets
are then queued in subqueues in a per-flow queuing (PFQ)
manner such that each subqueue belongs to a particular flow,
as shown in Figure 1.
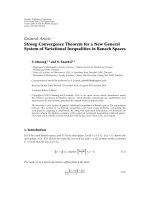
The operation of the ATBFQ scheduler is shown by the
flowchart shown in Figure 2. This can be summarized by the
following steps, which are executed each time the scheduler
is invoked at the beginning of the frame.
Step 1. At the scheduler, information is retrieved from the
higher layer about all active users using the getActiveUsers()
function. An active user is defined as a backlogged queue
which has packets waiting to be served.
Step 2. Based on this list of active users, a priority is
calculated according to the index given by (1). The highest-
BorrowPriority() function is called to calculate this for all
active users N
act
. This function then returns the user i with
the highest priority given by
i
∗
t
k
=
arg max
1≤i≤N
act
P
i
. (2)
Step 3. Using the borrowbudget() function, a certain budget
is calculated for the priority user i
∗
which depends on the
token counter E
∗
i
, and the debt limit d
∗
i
, and is given by
E
∗
i
−d
∗
i
. E
∗
i
keeps track of how much the user has borrowed
or given to the bank. The debt limit d
∗
i
keeps track of how
much a user can further borrow from the bank in order to
accommodate the burstiness of the traffic over the long term.
Step 4. If the calculated budget is less than the bank size,
resources are allocated to the user i using the maxSINR()
function. This is the second level of scheduling, and deals
with allocation of chunk resources to the selected user i. This
allocation is based on the maximum SINR principle, where
the chunk j with the best SINR is given to the selected user
[14] and can be expressed by
j
∗
t
k
= argmax
1≤j≤N
chunks
γ
ij
t
k
,(3)
where γ
ij
is the SINR of the selected user i in chunk j. This is
the most opportunistic of all scheduling algorithms for time-
slotted networks. This means that the adaptive modulation
and coding (AMC) policy maximally exploits the frequency
diversity of the time-frequency resource, where a chunk is
allocated to only one user and a user can have multiple
chunks in a scheduling instant.
Step 5. The resourceMap() function determines the amount
of bits that can be mapped to the chunk depending on the
AMC mode used.
Step 6. Each time a chunk resource is allocated, the update-
Counter() function is called. This function updates the bank,
the counter E
i
, and the allocated budget.
4 EURASIP Journal on Wireless Communications and Networking
Scheduler
\\ Every time the scheduler is invoked the following
functions are executed
active
users[] = getActiveUsers();
While (Bank> 0&& Chunks<totalChunks)
i
= highestBorrowPriority(active users[]);
budget
i
= borrowBudget(i);
While (budget
i
<Bank )
chunkID
= maxSINR (i,SINR );
numBits
= resourceMap(chunkID,i)
update SINR;
sendChunk(chunkID, i);
UpdateCounter(numBits, i);
if(budget<BPSK
0.5)
update active
users;
Break;
End if
End While
If (active
users == NULL)
Break;
End While
Check flow ID.
Does flow exist?
Enqueue the packet in the
proper sub-queue based on
the per-flow queuing
principle
Map the resources to
scheduled chunks with bit
level granularity
Initialize ATBFQ
parameters:
Debt limit
Burst credit
Creditable threshold
Scheduling
interrupt
Ye s
No
To o u t p u t b u ffer
Incoming
packet
Figure 2: Flowchart of scheduling operation.
The selected user i gets to transmit as long as (1) its queue
remains backlogged and (2) the allocated budget is less than
the total bank size and more than the number of bits that can
be supported with the lowest AMC mode (binary phase-shift
keying (BPSK) rate-1/2, considered in this study). If either
of these conditions is not satisfied, the user is classified as
nonactive. A new priority is calculated on the updated active
users, and Steps 1–6 are repeated. This procedure is repeated
until there are no chunk resources available or there are no
active users.
2.3. ATBFQ Parameter Selection. The performance of the
ATBFQ scheduler depends on its parameters that define the
debt limit, the burst credit (BC), and the token generation
rate. The token generation rate is critical to the extent to
which the burstiness of the UT traffic can be accommodated.
A UT in its burst mode transmits more data in a short
interval of time than its actual statistics, and hence, requires
more resources in order to maintain a certain QoS level. The
debtlimitissetto
−5 MB. The token generation rate should
be large enough to handle instantaneous bursty traffic. In
simulations, this generation rate has been considered three
times larger than the average packet arrival rate.
The burst credit for flow i (BC
i
) determines the amount
of bits selected user i
∗
can receive in a frame. While this
quantity was a fixed value in TBFQ, it is adaptive in ATBFQ.
In a cellular network, the user loading level in terms of active
users per sector is highly dynamic, due to the ON and OFF
characteristics of the bursty traffic. It is observed through
simulations that for low-loading cases, a higher value for BC
i
performs better, as shown in Ta bl e 1. On the other hand,
for high-loading conditions, a lower value for BC
i
is desired
as it exploits multiuser diversity, as shown in Ta bl e 2.Itis
further seen that for both low- and high-loading conditions,
BC
i
should be adapted per user basis in order to obtain
high spectral efficiency. For UT i, this adaptive value can be
formulated as
BC
i
=
η
i
(bits/sec /Hz) ×M(Hz · sec) ×N
chunks
N
act
,(4)
where η
i
is the past spectral efficiency, N
chunks
is the number
of available chunks, M is the amount of time-frequency
resources in a chunk, and N
act
is the number of active UTs
in that particular scheduling frame. η
i
is a moving average
which is updated each time by averaging over the past 100
transmissions of user i.
3. Fairness Study
Opportunistic scheduling algorithms aim to provide high
throughput for UTs having good channel conditions (closer
to the BS), and consequently, experience a degraded perfor-
mance. In such cases, the overall throughput of the system is
maximized but the fairness amongst UTs is greatly affected.
Therefore, it is essential to design a performance metric that
is an appropriate indicator of the fairness. One such index is
the Jain’s fairness index proposed in [15]. This fairness index
is bounded between zero and unity, and has been widely
used [16, 17]. If a system allocates resources to n contending
UTs such that the ith user receives an allocation x
i
, then this
fairness index f
I
(x)isgivenby
f
I
(x) =
[
n
i
=1
x
i
]
2
n
n
i=1
x
2
i
,(5)
where x
i
≥ 0. This index measures the equality of UT
allocation x.Ifx
i
s are equal for all UTs, then the fairness
index is 1 and the system is 100% fair, and vice versa. In this
EURASIP Journal on Wireless Communications and Networking 5
Table 1: Burst credit for ATBFQ for low loading (8 users).
Burst credit Queuing delay Packets dropped Throughput Spectral efficiency
(BC) (sec) (per frame) (Byte per frame) (bits/sec/Hz)
BC = 1000 0.025 4.36 815.4 2.37
BC
= 5000 0.017 0.76 1473.3 2.05
BC
= 10000 0.015 0.42 1546.6 1.98
Adaptive BC 0.012 0.30 1551.1 2.34
Table 2: Burst credit for ATBFQ for high loading (20 users).
Burst credit Queuing delay Packets dropped Throughput Spectral efficiency
(BC) (sec) (per frame) (Byte per frame) (bits/sec/Hz)
BC = 1000 0.044 3.19 2299.4 2.09
BC
= 5000 0.036 3.98 2094.0 1.88
BC
= 10000 0.033 4.00 2090.4 1.87
Adaptive BC 0.038 2.01 2497.1 2.29
paper, the allocation metric “x”isdefinedastheratioofUT
throughput and queue size, and is given by
x
i
=
TP
(t
1
,t
2
)
i
Q
(t
1
,t
2
)
i
,(6)
where TP
(t
1
,t
2
)
i
is the transmitted throughput in bits for UT i
during the time interval [t
1
, t
2
]andQ
(t
1
,t
2
)
i
is the total number
of packets arriving in the queue for UT i during (t
1
, t
2
). In
simulations, (t
1
, t
2
) is chosen to be equal to 16 frame time
durations.
In (6), the throughput is normalized to avoid ambiguity
since the throughput alone as a metric does not provide an
insight into the overall fairness.
Another method of fairness assessment, proposed in
WiMAX standard [18], is determined by the normalized
cumulative distributive function (CDF) of throughput per
UT. The normalized UT throughput with respect to the
average throughput,
T
i
for UT i, is expressed by
T
i
=
T
i
(1/n)
n
j
=1
T
j
,(7)
where T
i
is the instantaneous throughput of UT i in a
particular frame, and n is the total number of UTs. As stated
in [18], the CDF of this normalized throughput should lie
to the right of the coordinates (0.1, 0.1), (0.2, 0.2), and (0.5,
0.5).
The results using both of these fairness assessment
methods are discussed in detail in Section 5.
4. System Model and Simulation Parameters
ATBFQ is studied in the wide-area downlink scenario. To
reduce the simulation complexity, the bandwidth is reduced
to 15 MHz from the original 45 MHz. The chunk dimension
is given as 8 subcarriers by 12 OFDM symbols or 312.5 kHz
×
345.6 microseconds. The frame duration is defined as 691.2
microseconds, that is, there are a total of 96 chunks per
frame.
BS 1
BS 2
BS 3
BS 4
BS 5
BS 6
BS 7
Sec 1
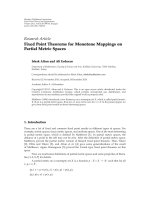
Figure 3: Network layout.
The network layout under investigation is shown in
Figure 3. Each cell in the network has three sectors. A
frequency reuse factor of 1 in each sector (all resources are
used in each sector) is assumed. The UTs are uniformly
placed in the central sector.
Time- and frequency-correlated Rayleigh channel sam-
ples obtained from power delay profile for the WINNER wide
area scenario are used to generate the channel fading. The
user speed is defined as 70 km/hr, and the intersite distance
is 1 km. The following exponential path-loss model has been
used [19]
PL
= 38.4+35.0log
10
(d)[dB], (8)
where PL is the path loss in dB, and d is the transmitter-
receiver separation in meters.
The average thermal noise power is calculated with
a noise figure of 7 dB. We have considered independent
lognormal random variables with a standard deviation of
6 EURASIP Journal on Wireless Communications and Networking
8 dB for shadowing. Sector transmit power is assumed to be
46 dBm, and chunks are assigned fixed equal powers.
The interference is modeled by considering the effect of
intercell interference and intracell interference on the sector
of interest in the central cell (denoted as sector 1 in BS 1). For
this purpose, the interference from the first tier is taken into
account. In this case, for a link of interest in sector 1 in BS 1,
the interference will comprise 18 (6 BS
× 3 sectors) intercell
and 2 intracell links.
The SINR obtained for chunk j of user i can be expressed
by
SINR
i,j
=
P
1,1
signal i,j
(P
inter i, j
+ P
intra i,j
)+P
noise i, j
,(9)
where P
1,1
signal i,j
denotes the desired signal power in sector
1inBS1,andP
noise,i
is the noise power. For the given
layout in Figure 3, intracell interference P
intra,i, j
, and intercell
interference P
inter,i,j
are given by the following expressions:
P
intra i,j
=
3
s=2
I
b=1,s
j
X
I
,
P
inter i, j
=
7
b=2
3
s=1
I
b,s
j
X
I
,
(10)
where I
b,s
j
is the interference power for chunk j from sector s
in BS b. X
I
has a binary value defined by
X
I
=
1, x ≤ AF,
0, x>AF,
(11)
where x is a uniform random variable defined over [0, 1], and
AF (activity factor) is defined as a probability for a particular
interfering link to be active. For example, AF of 1 denotes
a high level of interference where all the links are active
interferers (100% interference).
Adaptive modulation with block low-density parity-
check (B-LDPC) code is used. Thresholds for transmission
schemes are determined assuming a block length of 1704 bits
and 10% block error rate (BLER) as shown in Ta bl e 3 [13]. A
chunk using quadrature phase-shift queueing (QPSK) rate-
1/2 can carry 96 information bits. This is based on the
initial transmissions, that is, hybrid automatic repeat request
(HARQ) retransmissions are not considered. Real-time video
streaming traffic is used in this study. Two interrupted
renewal process (IRP) sources are superimposed to model
user’s video traffic in the downlink transmission as indicated
in [20]. The average packet rate of one UT is 1263.8 packets
per second. The resulting downlink data rate for each user is
1.92 Mbps.
The performance of the ATBFQ algorithm is compared
to that of the RR and the SB algorithms. The SB algorithm
was proposed in [10], and was modified to the WINNER
multicarrier OFDMA system for this work. It is a variation
of the proportional fair (PF) algorithm which is the most
widely adopted opportunistic scheduling algorithm [21].
The SB scheduler selects user i in slot k with the best score,
Table 3: Lookup table for AMC modes and corresponding chunk
throughput.
AMC mode SINR (dB) Chunk throughput (bits)
BPSK 1/2 0.2311 ≥ SINR > −1.7 48
BPSK 2/3 1.231
≥ SINR > 0.231 72
QPSK 1/2 3.245
≥ SINR > 1.231 96
QPSK 2/3 4.242
≥ SINR > 3.245 128
QPSK 3/4 6.686
≥ SINR > 4.242 144
16QAM 1/2 9.079
≥ SINR > 6.686 192
16QAM 2/3 10.33
≥ SINR > 9.079 256
16QAM 3/4 14.08
≥ SINR > 10.33 288
64QAM 2/3 15.6
≥ SINR > 14.08 384
64QAM 3/4 SINR > 15.6 432
where the score is calculated based on the current rank
of the user’s SINR among its past values in the current
window
{γ
i
(t
k
), γ
i
(t
k−1
), , γ
i
(t
k−W+1
)},whereγ
i
(t
k
) is the
SINR value of a user at time instant k, and W is the window
size. The corresponding score for the user i is given by
s
i
t
k
=
1+
W−1
l=1
1
{r
i
(t
k
)<r
i
(t
k−l
)}
+
W−1
l=1
1
{r
i
(t
k
)=r
i
(t
k−l
)}
X
l
, (12)
where X
l
are i.i.d. random variables on {0, 1} with P
r
(x =
0) = P
r
(x = 1) = 0.5.
Packets are scheduled on a frame-by-frame basis at the
start of every frame. Any packet that arrives at current frame
time will have to wait at least until the start of the next frame.
As video streaming has the most stringent delay requirement,
packets are dropped if they experience a delay in excess of 190
milliseconds. The simulation parameters are summarized in
Ta bl e 4; most of them are taken from the WINNER baseline
simulation assumptions [13].
5. Simulation Results
The performance results are classified into four categories:
(1) average user statistics, (2) performance of the cell-edge
users, (3) effect of varying user loading and interference
conditions, and (4) fairness analysis. Furthermore, the results
are compared to the SB and RR algorithms. The window
size plays an important role in the performance of the SB
algorithm [10]. The performance of ATBFQ has been studied
with different window sizes in the WINNER context [22, 23].
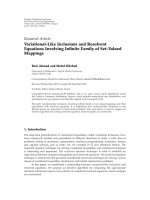
5.1. User Pe rformance. Figure 4 shows the CDF of the packets
dropped per frame for low and high loading, respectively.
These curves indicate the opportunistic nature of SB, since
it tends to favor the users with good channel conditions.
Consequently, a higher drop rate, even at low loading, is
observed for SB.
The CDF of average user throughput per sector (mea-
sured in bytes per frame) for 8 and 20 user loading
cases is shown in Figure 5. ATBFQ performs better for the
EURASIP Journal on Wireless Communications and Networking 7
Table 4: Summary of simulation parameters.
Parameter
Used value/model
Scenario
Wide area DL (frequency adaptive)
Channel model
WINNER C2 channel
Shadowing
Independent lognormal random variables (standard deviation 8 dB)
Sector Tx antenna
120
◦
directional with WINNER baseline antenna pattern
UT receive antenna
Omnidirectional
Intersite distance
1000 m
Signal bandwidth
15 MHz (i.e., 48 chunks which is 1/3rd of the baseline assumptions)
Mobility
70 km/hr
Sector Tx power
46 dBm
Scheduler
Adaptive Token Bank Fair Queuing, score based, and round-robin
Interference model
brute force method (central cell is considered with interference from the 1st-tier)
Antenna configuration
Single-in-single-out (SISO)
Coding
B-LDPCC
AMC modes
BPSK (rate 1/2 and 2/3), QPSK (rate 1/2, 2/3, and 3/4), 16QAM (rate 1/2, 2/3, and 3/4),
and 64QAM (rate 2/3 and 3/4)
AMC thresholds
With FEC block of 1728 bits and 10% BLER
Frame duration
0.6912 ms (scheduling interval)
Tr afficmodel
1.9 Mbps 2IRP model for MPEG video
Packet size
188 Bytes
Packet drop criterion
Delay
≥ 0.19 sec
Simulation time
60 sec
Simulation tools
MATLAB and OPNET
0
0.1
0.2
0.3
0.4
0.5
0.6
0.7
0.8
0.9
1
Probability (packets dropped <= abcissa)
2 4 6 8 10 12 14
Packets dropped per frame
SB
RR
ATBF Q
8users
20 users
Figure 4: CDF of packets dropped per user per frame.
lower loading case, whereas SB achieves marginally higher
throughput at higher loading. For the high loading case, it is
observed that the CDF curve for ATBFQ has a steeper slope
indicating better fairness, since users are served with similar
throughput. Note that this is not true for SB. As ATBFQ
attempts to maintain fairness, it tries to serve cell-edge users
with poor channel conditions as compared to those located
closer to the BS. Therefore, ATBFQ also utilizes more chunks.
0
0.1
0.2
0.3
0.4
0.5
0.6
0.7
0.8
0.9
1
Probability (throughput <= abcissa)
50 100 150 200 250 300
UT throughput (bytes/frame)
SB
RR
ATBF Q
8users
20 users
Figure 5: CDF of user throughput.
On the other hand, SB aims to maximize the throughput
while being fair in the opportunistic sense.
5.2. Cell-Edge User Performance. Figure 6 shows the packet
transmit ratio (defined as the transmitted packet per total
packets generated) versus distance from BS for 20 users per
sector. It can be observed that as the distance increases, the
packet transmit ratio for SB decreases, that is, the number of
8 EURASIP Journal on Wireless Communications and Networking
0.1
0.2
0.3
0.4
0.5
0.6
0.7
0.8
0.9
1
Ratio of packets transmitted
100 150 200 250 300 350 400 450 500 550 600
Distance from BS (m)
RR: 20 users
SB: 20 users
ATBF Q: 20 user s
Fitted curve RR
Fitted curve SB
Fitted curve ATBFQ
Figure 6: Ratio of packets dropped versus distance form BS.
1
1.5
2
2.5
3
3.5
4
Spectral efficiency (bps/Hz)
100 150 200 250 300 350 400 450 500 550 600
Distance from BS (m)
RR: 20 users
SB: 20 users
ATBF Q: 20 user
Fitted curve SB
Fitted curve ATBFQ
Fitted curve RR
Figure 7: Average user spectral efficiency versus distance form BS.
dropped packets increases. This can be further visualized by
the quadratic-fitted curves for both algorithms, which show
their respective trends with the varying distance. As SB tries
to maximize the throughput, the cell-edge users are affected,
and suffer packet losses. ATBFQ, on the other hand, is fair
in nature and shows enhanced performance for the cell-
edge users. If a cell-edge user is suffering from poor channel
conditions, ATBFQ gives it priority to transmit in the next
scheduling interval. By assigning priorities in such a manner,
ATBFQ considerably improves the spectral efficiency for the
cell-edge users, as shown in Figure 7.
5.3. Varying User Loading and Interference Conditions.
Performance indicators such as average dropped packets,
average UT throughput, and average UT queuing delay have
0
0.01
0.02
0.03
0.04
0.05
0.06
0.07
0.08
0.09
0.1
Queuing delay (s)
4 6 8 101214161820
Number of users
RR (AF
= 0.7)
ATBF Q ( AF
= 0.7)
SB (AF
= 0.7)
RR (AF
= 0.5)
SB (AF
= 0.5)
ATBF Q ( AF
= 0.5)
Figure 8: Average UT queuing delay versus number of UTs.
been considered in evaluating ATBFQ by comparison with
the reference SB and RR schemes.
Figures 8, 9,and10 show the performance results
for average UT queuing delay, average packets dropped
per frame, and the total sector throughput, respectively,
in varying loading conditions for ATBFQ, SB, and RR.
The curves are plotted for two different AFs of 0.5 and
0.7 to model moderate and high interference situations,
respectively. ATBFQ outperforms the reference SB and RR
algorithms in terms of the above-mentioned performance
parameters for all loading conditions when the AF is 0.5.
In this case, the UTs experience better channel conditions
resulting from low interference. Hence, fewer chunks are
utilized to transmit data as compared to the number of
chunks utilized for a higher AF. Consequently, RR performs
better than SB at lower loading levels.
For low-to-medium loading with an AF of 0.7, it
is observed again that ATBFQ outperforms the reference
schemes in terms of all observed parameters. This trend
changes as network loading increases to 20 UTs per sector.
In this case, SB outperforms ATBFQ and RR in terms of
average UT queuing delay, average packets dropped per
frame, and the total sector throughput, respectively. This is
due to the fact that SB is opportunistic in nature, whereas
ATBFQ is fairness aware. As the number of UTs increases, SB
takes advantage of the multiuser diversity to achieve higher
throughput.
5.4. Fairness Analysis. The CDF of the Jain’s fairness index
given by (5) is shown in Figure 11. These curves represent
network loading of 20 UTs per sector with an AF of 0.7. It
is observed that ATBFQ achieves better fairness compared to
SB and RR. Figure 12 shows the CDF plot of the normalized
throughput given by (7) for 20 UTs per sector with an AF
of 0.7. By normalizing the throughput, the performance of
the cell edge users represented by the tail of the throughput
CDF curve is enhanced. It is again observed that a higher
EURASIP Journal on Wireless Communications and Networking 9
1
2
3
4
5
6
Average packets dropped per frame
5101520
Number of users
RR (AF
= 0.5)
ATBF Q ( AF
= 0.5)
SB (AF
= 0.5)
RR (AF
= 0.7)
SB (AF
= 0.7)
ATBF Q ( AF
= 0.7)
Figure 9: Average UT packets dropped per frame versus number of
UTs.
6
8
10
12
14
16
18
20
22
24
26
28
Throughput (Mbps)
468101214161820
Number of users
RR (AF
= 0.7)
ATBF Q ( AF
= 0.7)
SB (AF
= 0.7)
Figure 10: Sector throughput.
normalized throughput is achieved for ATBFQ compared
to that in SB, and the curve lies to the right of the above-
mentioned coordinates.
6. Conclusion
In this paper, the performance of the ATBFQ scheduling
algorithm with adaptive parameter selection is investigated
in the context of the 4G WINNER wide-area downlink
scenario. It is a queue- and channel-aware scheduling
algorithm which attempts to maintain fairness among all
users. Performance of ATBFQ is presented with reference to
the SB and RR schedulers. Being an opportunistic scheduler
belonging to the proportional fair class, SB aims to maximize
throughput by making use of multiuser diversity while trying
0
0.1
0.2
0.3
0.4
0.5
0.6
0.7
0.8
0.9
1
Probability (fairness index <= abcissa)
00.10.20.30.40.50.60.70.80.91
Fairness index
RR SB ATBFQ
Figure 11: CDF of fairness index.
0.1
0.2
0.3
0.4
0.5
0.6
Probability (normalized
throughput <= abcissa)
00.10.20.30.40.50.60.70.80.91
Normalized throughput
RR
SB
ATBF Q
Figure 12: CDF of normalized throughput (zoomed in).
to maintain fairness. However, this comes at a certain cost,
since the cell edge users in this scheme, suffering from poor
channel conditions, are more severely affected. Also, due to
the bursty nature of the traffic, such users experience higher
queueing delays, resulting in a higher number of packet
dropping.
Contrary to SB, ATBFQ is a credit-based scheme which
aims to accommodate the burstiness of the users by assigning
them more resources in the short term, provided that long-
term fairness is maintained. For lower to medium loading,
ATBFQ provides higher throughput, lower queuing delay,
and a lower number of packets dropped as compared to SB
and RR. At high loading, ATBFQ still outperforms SB and
RR with regard to the queuing delay and packet dropping,
however, with a slight degradation in the sector throughput.
This is because ATBFQ attempts to satisfy users with poor
channel conditions by assigning more resources, even with a
lower chunk spectral efficiency. An overall improvement of
the performance of cell-edge users is observed in terms of
spectral efficiency and packet-dropping ratio for ATBFQ as
compared to SB and RR.
The observed throughput, queuing delay, and packet
dropping rate clearly indicate the superiority of the ATBFQ
10 EURASIP Journal on Wireless Communications and Networking
algorithm. This apparent improvement in the fairness per-
formance of the ATBFQ algorithm based on these perfor-
mance parameters is further validated by evaluating the
fairness indices available in the literature.
Acknowledgments
The authors would like to express their gratitude to Mr.
Jiangxin Hu for his technical support and Dr. Abdulka-
reem Adinoyi for providing his valuable comments on
the manuscript. They also thank OPNET Technologies,
Inc. for providing software license to carry out the sim-
ulations of this research. This work was a part of the
Wireless World Initiative New Radio (WINNER) project,
with the support of the Natural
Sciences and Engineering Research Council (NSERC) of
Canada. Preliminary results of this work have been presented
in IEEE VTC2008-Spring and IEEE VTC2008-Fall confer-
ences.
References
[1] Overall Description: Stage 2 (Release 8), “3GPP Std. 3GPP
E-UTRA and E-UTRAN Technical Specification TS 36.300
V8.4.0,” March 2008, />info/36300.htm.
[2] IEEE 802.16 Std. 802.16j/D5, “Part 16: Air Interface for Fixed
and Mobile Broadband Wireless Access Systems—Multihop
Relay Specification,” June 2008, />[3] “Project Presentation,” WINNER Deliverable D8.1, March
2004, />older.html.
[4]Q.Liu,X.Wang,andG.B.Giannakis,“Across-layer
scheduling algorithm with QoS support in wireless networks,”
IEEE Transactions on Vehicular Technology,vol.55,no.3,pp.
839–847, 2006.
[5] S. Borst, “User-level performance of channel-aware scheduling
algorithms in wireless data networks,” in Proceedings of the
22nd Annual Joint Conference of the IEEE Computer and
Communications Societies (INFOCOM ’03), vol. 1, pp. 321–
331, San Francisco, Calif, USA, March-April 2003.
[6] D.WuandR.Negi,“Effective capacity: a wireless link model
for support of quality of service,” IEEE Transactions on Wireless
Communications, vol. 2, no. 4, pp. 630–643, 2003.
[7] A. Stamoulis, N. D. Sidiropoulos, and G. B. Giannakis, “Time-
varying fair queueing scheduling for multicode CDMA based
on dynamic programming,” IEEE Transactions on Wireless
Communications, vol. 3, no. 2, pp. 512–523, 2004.
[8] M. Andrews, K. Kumaran, K. Ramanan, A. Stolyar, P. Whiting,
and R. Vijayakumar, “Providing quality of service over a
shared wireless link,” IEEE Communications Magazine, vol. 39,
no. 2, pp. 150–154, 2001.
[9] W. K. Wong and V. C. M. Leung, “Scheduling for integrated
services in next generation packet broadcast networks,” in Pro-
ceedings of the IEEE Wireless Communications and Networking
Conference (WCNC ’99), vol. 3, pp. 1278–1282, New Orleans,
La, USA, September 1999.
[10] T. Bonald, “A score-based opportunistic scheduler for fading
radio channels,” in Proceedings of the 5th European Wireless
Conference (EW ’04), Barcelona, Spain, February 2004.
[11] W. K. Wong, H. Y. Tang, and V. C. M. Leung, “Token bank fair
queuing: a new scheduling algorithm for wireless multimedia
services,” International Journal of Communication Systems, vol.
17, no. 6, pp. 591–614, 2004.
[12] “Final Report on Identified RI Key Technologies, Sys-
tem Concept, and their Assessment,” WINNER I Deliv-
erable D2.10, November 2005, />deliverables
older.html.
[13] “Test Scenarios and Calibration Cases Issue 2,”
WINNER II Deliverable D6.13.7, December 2006,
deliverables.html.
[14] R. Knopp and P. A. Humblet, “Information capacity and
power control in single-cell multiuser communications,” in
Proceedings of IEEE International Conference on Communica-
tions (ICC ’95) , vol. 1, pp. 331–335, Seattle, Wash, USA, June
1995.
[15] R. Jain, D. Chiu, and W. Hawe, “A quantitative measure
of fairness and discrimination for resource allocation in
shared computer systems,” Tech. Rep. DEC-TR-301, Digital
Equipment Corporation, Maynard, Mass, USA, September
1984.
[16] H. Sirisena, A. Haider, M. Hassan, and K. Fawlikowski,
“Transient fairness of optimized end-to-end window control,”
in Proceedings of IEEE Global Telecommunications Conference
(GLOBECOM ’03), vol. 7, pp. 3979–3983, San Francisco, Calif,
USA, December 2003.
[17] G. Berger-Sabbate, A. Duda, O. Gaudoin, M. Heusse, and
F. Rousseau, “Fairness and its impact on delay in 802.11
networks,” in Proceedings of IEEE Global Telecommunications
Conference (GLOBECOM ’04), vol. 5, pp. 2967–2973, Dallas,
Tex, USA, November-December 2004.
[18] IEEE 802.16 Std., “IEEE 802.16m Evaluation Methodology
Document,” September 2007, />[19] “Final report on link level and system level channel
models,” WINNER I Deliverable D5.4, November 2005,
/>older.html.
[20] “Traffic model for 802.16 TG3 MAC/PHY simulations,” IEEE
802.16 Work-in-progress document 802.16.3c-01/30r1, March
2001, />[21] E. F. Chaponniere, P. J. Black, J. M. Holtzman, and D. N. C. Tse,
“Transmitter directed code division multiple access system
using path diversity to equitably maximize throughput,” US
Patent no. 6449490, September 2002.
[22] “Inteference Avoidance Concepts,” WINNER II Deliverable
D4.7.2, June 2007, />html.
[23] F. A. Bokhari, W. K. Wong, and H. Yanikomeroglu, “Adaptive
token bank fair queuing scheduling in the downlink of 4G
wireless multicarrier networks,” in Proceedings of the 67th IEEE
Vehicular Technology Conference (VTC ’08), pp. 1995–2000,
Marina Bay, Singapore, May 2008.