Báo cáo hóa học: "Research Article Dynamic Model of Signal Fading due to Swaying Vegetation" ppt
Bạn đang xem bản rút gọn của tài liệu. Xem và tải ngay bản đầy đủ của tài liệu tại đây (1.35 MB, 11 trang )
Hindawi Publishing Corporation
EURASIP Journal on Wireless Communications and Networking
Volume 2009, Article ID 306876, 11 pages
doi:10.1155/2009/306876
Research Article
Dynamic Mo del of Signal Fading due to Swaying Vegetation
Michael Cheffena
1
and Torbj
¨
orn Ekman
2
1
University Graduate Center (UNIK), P.O. Box 70, 2027 Kjeller, Norway
2
Department of Electronics and Telecommunications, Norwegian University of Science and Technology, 7491 Trondheim, Norway
Correspondence should be addressed to Michael Cheffena, cheff
Received 31 July 2008; Revised 1 December 2008; Accepted 18 February 2009
Recommended by Michael A. Jensen
In this contribution, we use fading measurements at 2.45, 5.25, 29, and 60 GHz, and wind speed data, to study the dynamic effects
of vegetation on propagating radiowaves. A new simulation model for generating signal fading due to a swaying tree has been
developed by utilizing a multiple mass-spring system to represent a tree and a turbulent wind model. The model is validated
in terms of the cumulative distribution function (CDF), autocorrelation function (ACF), level crossing rate (LCR), and average
fade duration (AFD) using measurements. The agreements found between the measured and simulated first- and second-order
statistics of the received signals through vegetation are satisfactory. In addition, Ricean K-factors for different wind speeds are
estimated from measurements. Generally, the new model has similar dynamical and statistical characteristics as those observed in
measurements and can thus be used for synthesizing signal fading due to a swaying tree. The synthesized fading can be used for
simulating different capacity enhancing techniques such as adaptive coding and modulation and other fade mitigation techniques.
Copyright © 2009 M. Cheffena and T. Ekman. This is an open access article distributed under the Creative Commons Attribution
License, which permits unrestricted use, distribution, and reproduction in any medium, provided the original work is properly
cited.
1. Introduction
In a given environment, radiowaves are subjected to dif-
ferent propagation degradations. Among them, vegetation
movement due to wind can both attenuate and cause a
fading effect to the propagating signal. Operators cannot
guarantee a clear line-of-sight (LOS) to wireless customers as
vegetation in the surrounding area may grow or expand over
the years and obstruct the path. Fade mitigation techniques
(FMTs) such as adaptive coding and modulation can be
used to counteract the signal fading caused by swaying
vegetation. For example, during windy conditions (high
signal fading), power efficient modulation schemes such as
BPSK and QPSK (which are less sensitive to propagation
impairments compared to high-order modulation schemes)
can be used to increase the link availability, while spectral
efficient modulation schemes such as 16 QAM and 64 QAM
can be applied during calm wind conditions (less signal
fading) [1]. An extra coding information can also be added
to the channel so that errors can be detected and corrected
by the receiver. FMTs need to track the channel variations
and adjust their parameters (modulation order, coding rate,
etc.) to the current channel conditions. In order to design,
optimize, and test FMT, data collected from propagation
measurements are needed. However, such data may not be
available at the preferred frequency, wind speed conditions,
and so forth. Alternatively, time series generated from
simulation models can be used. In this case, the simulated
time series need to have similar dynamical and statistical
characteristics as those obtained from measurements [1].
The signal attenuation depends on a range of factors such
as tree type, whether trees are in leaf or without leaf, whether
trees are dry or wet, frequency, and path length through
foliage [2, 3]. For frequencies above 20 GHz, leaves and
needles have large dimensions compared to the wavelength,
and can significantly affect the propagation conditions.
The ITU-R P.833 [4] provides a model for predicting the
mean signal attenuation though vegetation. The temporal
variations of the relative phase of multipath components due
to movement of the tree result in fading of the received signal
as reported in, for example, [5–10]. The severity of the fading
depends on the rate of phase changes which further depends
on the movement of the tree components. Therefore, for
accurate prediction of the channel characteristics, the motion
of trees under the influence of wind should be taken into
account. This requires the knowledge of wind dynamics and
2 EURASIP Journal on Wireless Communications and Networking
the complex response of a tree to induced wind force. In our
previous work, a heuristic approach was used to model the
dynamic effects of vegetation [10]. In this paper, we develop
a theoretical model based on the motion of trees under the
influence of wind, and is validated in terms of first- and
second-order statistics using available measurements.
The paper begins in Section 2 by giving a brief descrip-
tion of the measurement setup for measuring signal fad-
ing after propagating through vegetation and for measur-
ing meteorological data (wind speed and precipitation).
Section 3 discusses the wind speed dynamics. The motion of
trees and their dynamic effects on propagating radiowaves as
well as the validation of the proposed simulation model are
dealt with in Section 4. Finally, conclusions are presented in
Section 5.
2. Measurement Setup
To characterize the influence of vegetation on radiowaves,
measurements were performed in [7]forabroadrange
of frequencies, including 2.45, 5.25, 29, and 60 GHz, in
various foliage and weather conditions. A sampling rate of
500 Hz was used to collect the radio frequency (RF) signals
using a spectrum analyzer, multimeter, and a computer with
General Purpose Interface Bus (GPIB) interface. In order to
understand the behavior of radiowaves propagating through
vegetation under different weather conditions, meteorolog-
ical measurements including wind speed and precipitation
were also performed in [7]. The wind speed was recorded
every 5 seconds, and the precipitation data every 10 seconds.
The measurements were taken at two different locations,
referred to as Site 1 and Site 2. The trees at Site 1 were
deciduous trees, and were considered both when the trees
were in full leaf and when they were without leaf. Site
2 was populated by several coniferous trees which made
awalloftrees.Tab le 1 gives a general site information.
A detailed description of the measurements can be found
in [7]. An example of received signal at 29 GHz after
propagating through dry leaved deciduous trees (Site 1) is
shown in Figure 1, and the corresponding measured wind
speed is shown in Figure 2. These figures indicate a strong
dependency of the signal variation transmitted through
vegetation on the wind speed. For a closer look, Figures 3
and 4 show examples of typical measured signals during low
(1 to 3 m/s) and high (
≥4.5 m/s) wind speed conditions for
leaved dry deciduous trees (Site 1) at 29 GHz. As expected, we
can observe that the signal variation increases with increasing
wind speed. Accurate modeling of the channel is needed
when designing mitigation techniques for the fast and deep
signal variations are like the ones shown in Figures 1 and 4.
In order to do this, a good knowledge of wind dynamics and
trees motions due to wind is required.
3. Wind Dynamics
Trees sway mostly due to wind. Understanding the dynamic
characteristics of wind is therefore essential when describing
the complex response of a tree to induced wind force
−80
−70
−60
−50
−40
−30
−20
Received signal (dBm)
0 500 1000 1500 2000 2500 3000
Time (s)
Figure 1: Measured signal fading after propagating through dry
leaved deciduous trees (Site 1) at 29 GHz. A sampling rate of 500 Hz
was used to collect the signal.
0
1
2
3
4
5
6
7
8
Wind speed (m/s)
0 500 1000 1500 2000 2500 3000
Time (s)
Figure 2: Measured wind speed for the corresponding signal fading
shown in Figure 1. The wind speed was measured every 5 seconds.
and their dynamic effects on propagating radiowaves. The
turbulent wind speed power spectrum can be represented by
a Von Karman power spectrum [11], and it can be simulated
by passing white noise through a shaping filter with transfer
function given by [12, 13]
H
F
(s) =
K
F
1+sT
F
5/6
,(1)
where K
F
and T
F
are the gain and time constant of the
shaping filter, respectively. A close approximation of the 5/6-
order filter in (1) by a rational transfer function is given
by [12]
H
F
(s) = K
F
(g
1
T
F
s +1)
T
F
s +1
g
2
T
F
s +1
,(2)
EURASIP Journal on Wireless Communications and Networking 3
Table 1: Site description [7].
Site Path length Foliage depth Description
Site 1 63.9 m
14.3 m 3 foliated maple trees
7.6 m 1 foliated flowering crab tree
Site 2 110 m 25 m Several spruce and one pine tree creating a wall
−33
−32
−31
−30
−29
−28
−27
−26
Received signal (dBm)
0 20 40 60 80 100 120
Time (s)
Figure 3: Typical measured signal at 29 GHz for leaved dry
deciduous trees (Site 1) during low-wind speed conditions (1 to
3 m/s). A sampling rate of 500 Hz was used to collect the signal.
−80
−70
−60
−50
−40
−30
−20
−10
Received signal (dBm)
0 20 40 60 80 100 120
Time (s)
Figure 4: Typical measured signal at 29 GHz for leaved dry decidu-
ous trees (Site 1) during high-wind speed conditions (
≥4.5 m/s). A
sampling rate of 500 Hz was used to collect the signal.
where g
1
= 0.4andg
2
= 0.25. T
f
and K
F
are defined as
T
F
=
L
r
w
m
,(3)
K
F
≈
2π
B(1/2, 1/3)
T
F
T
s
,(4)
n(t)
H
F
n
c
(t)
k
σ
σ
w
w
m
w(t)
White
noise
generator
Figure 5: Model for simulating wind speed. n(t) is a white Gaussian
noise with zero mean and unite variance, H
F
is the low-pass filter
defined in (2), n
c
(t)isacolorednoise,k
σ
is a model parameter (see
Ta bl e 2 ), w
m
is the mean wind speed, σ
w
= w
m
k
σ
,andw(t)isthe
resulting wind speed.
Table 2: k
σ
values for different terrain types at 10 meter height [14].
Type Coastal Lakes Open Built-up areas City centers
k
σ
0.123 0.145 0.189 0.285 0.434
where w
m
is the mean wind speed and L
r
is the turbulence
length scale that corresponds to the site roughness. The
turbulence length can be calculated from the height, h,above
the ground, expressed as L
r
= 6.5h [14]. T
s
is the sampling
period and B designates the beta function, and is given by
B(u, y)
=
1
0
z
u−1
(1 − z)
y−1
dz. (5)
Figure 5 shows the model for simulating wind speed.
In the model, a white Gaussian noise n(t)(wheret is the
time) with zero mean and unite variance is transformed
into colored noise n
c
(t) by smoothing it with the filter given
in (2). The static gain K
F
defined in (4) ensures that the
resulting colored noise n
c
(t) has a unit variance. The wind
speed w(t) is then obtained by multiplying n
c
(t) by the
standard deviation of the turbulent wind σ
w
and adding the
mean wind speed w
m
. k
σ
is a constant which depends on
the type of the terrain [14]; see Tab le 2 .Thiswindmodelis
used in Section 4.1 to describe the displacement of tree due
to induced wind force.
4. The Dynamic Effects of Vegetation
on Radiowaves
4.1. The Motion of Trees. Atreeisacomplexstructure
consisting of a trunk, branches, subbranches, and leaves.
The tree responds in a complex way to induced wind forces,
with each branch swaying and dynamically interacting with
other branches and the trunk. During windy conditions,
first-order branches sway over the swaying trunk, and
second-order branches sway over the swaying first-order
branches. Generally, smaller branches sway over swaying
4 EURASIP Journal on Wireless Communications and Networking
L
5
L
3
L
1
x
d
L
6
L
4
L
2
Tx Rx
Figure 6: Path length difference. L
1
+L
2
is the path length of the LOS
component, L
3
+ L
4
is the path length of the multipath component
at rest, L
5
+ L
6
is the path length of the multipath component when
displaced, x is the displacement, d is the distance from the LOS path
to the position of a tree component. Tx and Rx are the transmitting
and receiving antennas.
k
0
c
0
f
0
(t)
m
0
x
0
(t)
k
1
c
1
k
3
c
3
k
5
c
5
f
1
(t)
m
1
x
1
(t)
f
3
(t)
m
3
x
3
(t)
f
5
(t)
m
5
x
5
(t)
k
2
c
2
k
4
c
4
k
6
c
6
f
2
(t)
m
2
x
2
(t)
f
4
(t)
m
4
x
4
(t)
f
6
(t)
m
6
x
6
(t)
Main trunk Branches and sub-branches
Figure 7: Dynamic representation of a tree. m
i
, k
i
, c
i
, f
i
(t), and
x
i
(t) are the mass, spring constant, damping factor, time varying
wind force, and time varying displacement of tree component i,
respectively.
larger branches, and leaves vibrate over swaying smaller
branches. The overall effect minimizes the dynamic sway of
the tree by creating a broad range of frequencies and prevents
the tree from failure [15]. Radiowaves scattered from these
swaying tree components have a time varying phase changes
due to periodic changes of the path length which results in
fading of the received signal. Figure 6 illustrates the path
length difference due to displacement of a tree component
from rest, and is given by (see Appendix A)
ΔL
≈ x
d
L
1
+ L
2
L
1
L
2
,(6)
where L
1
+ L
2
is the path length of the LOS component. L
1
is the distance from the transmitter to a point parallel to a
position of a tree component, d is the distance from the point
to the position of a tree component, L
2
is the distance from
the point parallel to a position of a tree component to the
receiver, and x is the displacement.
A dynamic structure model of tree was reported in
[15], and is extended here to include dynamic wind force
and mathematical description of the motion of each tree
component; see Figure 7. In the model, tree components
(the trunk, branches, and subbranches) are attached with
each other using springs which resulted in a multiple mass-
spring system. This tree model is further used in Section 4.2
to model the signal fading due to swaying vegetation. For
simplicity, we use a tree model with a trunk and just three
branches and three subbranches, as seen in Figure 7. This
simple model is sufficient to recreate the rich dynamic
behavior of the fading from a real tree, as is demonstrated
in the simulations in Section 4.2. Using Newton’s second law
and the Hooke’s law, the equations of motion (displacement)
for the tree components in Figure 7 can be formulated using
second-order differential equations:
m
0
¨
x
0
(t) =−
˙
x
0
(t)
c
0
+ c
1
+ c
3
+ c
5
+
˙
x
1
(t)c
1
+
˙
x
3
(t)c
3
+
˙
x
5
(t)c
5
−x
0
(t)
k
0
+ k
1
+ k
3
+ k
5
+ x
1
(t)k
1
+ x
3
(t)k
3
+ x
5
(t)k
5
+ f
0
(t),
m
1
¨
x
1
(t) =−
˙
x
1
(t)
c
1
+ c
2
+
˙
x
2
(t)c
2
+
˙
x
0
(t)c
1
−x
1
(t)
k
1
+ k
2
+ x
2
(t)k
2
+ x
0
(t)k
1
+ f
1
(t),
m
2
¨
x
2
(t) = c
2
˙
x
1
(t) −
˙
x
2
(t)
+ k
2
x
1
(t) − x
2
(t)
+ f
2
(t),
m
3
¨
x
3
(t) =−
˙
x
3
(t)
c
3
+ c
4
+
˙
x
4
(t)c
4
+
˙
x
0
(t)c
3
−x
3
(t)
k
3
+ k
4
+ x
4
(t)k
4
+ x
0
(t)k
3
+ f
3
(t),
m
4
¨
x
4
(t) = c
4
˙
x
3
(t) −
˙
x
4
(t)
+ k
4
x
3
(t) − x
4
(t)
+ f
4
(t),
m
5
¨
x
5
(t) =−
˙
x
5
(t)
c
5
+ c
6
+
˙
x
6
(t)c
6
+
˙
x
0
(t)c
5
−x
5
(t)
k
5
+ k
6
+ x
6
(t)k
6
+ x
0
(t)k
5
+ f
5
(t),
m
6
¨
x
6
(t) = c
6
˙
x
5
(t) −
˙
x
6
(t)
+ k
6
x
5
(t) − x
6
(t)
+ f
6
(t),
(7)
where m
i
, k
i
,andc
i
are the mass, spring constant, and
damping factor of tree component i, respectively. The spring
constant k
i
describes the stiffness of the wood material.
While the damping factor c
i
describes the energy dissipation
due to swaying tree component (aerodynamic damping)
and dissipation from internal factors such as root/soil
movement and internal wood energy dissipation [15].
¨
x
i
(t),
˙
x
i
(t), and x
i
(t) are the acceleration, velocity, and position
(displacement) of tree component i,respectively. f
i
(t) is the
time varying induced wind force on tree component i, and is
given by [16]
f
i
(t) =
C
d
ρw
i
(t)
2
A
i
2
,(8)
where C
d
is the drag coefficient, ρ is the air density, A
i
is
the projected surface area of the tree component, and w
i
(t)
is the wind speed (can be simulated using the model shown
in Figure 5).
EURASIP Journal on Wireless Communications and Networking 5
The time varying displacement, x
i
(t), of each tree
component can then be obtained by solving (7) using state-
space modeling:
˙
y
= Ay + Bu,
(9)
x
= Cy + Du,
(10)
where y
=
x
0
(t) ··· x
6
(t)
˙
x
0
(t) ···
˙
x
6
(t)
T
is the state
vector, u
=
f
0
(t) ··· f
6
(t)
T
is the input vector, and x =
x
0
(t) ··· x
6
(t)
T
is the output vector. The matrices A, B,
C,andD are obtained from (7); see Appendix B. Note that
(9)and(10) are for continuous time and can be converted to
discrete time using, for example, bilinear transformation.
4.2. Signal Fading due to Swaying Tree. Former studies
on the measurements used here suggested that the signal
envelope can be represented using the extreme value or
lognormal distribution [7]. However, our study shows
that the Nakagami-Rice distribution can well represent the
measured signal envelop through vegetation. The Chi-Square
test has been performed to verify the fitness of Nakagami-
Rice and measured signal distribution. For all frequencies,
the hypothesis was accepted for 5% significance level.
Furthermore, the majority of reported measurement results
suggest Nakagami-Rice envelop distribution [8, 17–19].
Therefore, Nakagami-Rice envelop distribution is assumed
in the developed simulation model, with the K-factor given
by
K
=
P
d
P
f
, (11)
where P
d
and P
f
are the power in the direct and diffuse
components, respectively. From our measurements, we esti-
mated the Ricean K-factors under different wind conditions
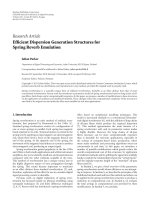
using the moment-method reported in [20]; see Figure 8.
The reduction of the K-factor suggests that the contribution
of the diffuse component increases with increasing wind
speed. We can also observe that the K-factor decreases with
increasing frequency (due to smaller wavelength).
The time series for the received power is obtained as
|h(t)
2
|,whereh(t) is the complex impulse response due to
the multipath in the vegetation. For a Ricean distributed
signal envelope, the impulse response h(t) can be expressed
as the sum of the direct and diffuse signal components as
shown in
h(t)
= a
d
exp( jθ)
Direct
+
N=7
i=1
a
f
exp
j
θ
i
−
2π
λ
ΔL
i
(t)
diffuse
,
(12)
−10
−5
0
5
10
15
20
25
30
K-factor (dB)
1.522.533.544.55
Average wind speed (m/s)
2.45 GHz
5.25 GHz
29 GHz
60 GHz
Figure 8: Ricean K-factors as function of average wind speed
estimated from measurements at 2.45, 5.25, 29, and 60 GHz after
propagating through dry leaved deciduous trees (Site 1).
where the first term in (12) is the contribution of the direct
signal component. a
d
=
P
d
(P
d
is as defined in (11)), and θ
are the amplitude and phase of the direct signal, respectively.
The second term in (12) is the contribution of the diffuse
component which is the sum of signals scattered from the
tree components. N
= 7 is the total number of scattering
tree components (the trunk, branches, and subbranches; see
Figure 7). a
f
=
P
f
/N is the amplitude of each scattered
signal (assumed to be equal for all scattered components),
where P
f
is as defined in (11), θ
i
is the phase uniformly
distributed within the range [0, 2π], λ is the wavelength,
and ΔL
i
(t) is the time varying path length difference due to
displacement of the ith tree component shown in Figure 7.
Note from (12) that the time varying path length difference,
ΔL
i
(t), results in time varying phase changes which in turn
gives a fading effect to the received signal. Following the same
approach as in (6), ΔL
i
(t)fori = 1, 2, ,6aregivenby
ΔL
0
(t) ≈ x
0
(t)
d
0
L
1
+ L
2
L
1
L
2
,
ΔL
1
(t) ≈
x
0
(t)+x
1
(t)
d
1
L
1
+ L
2
L
1
L
2
,
ΔL
2
(t) ≈
x
0
(t)+x
1
(t)+x
2
(t)
d
2
L
1
+ L
2
L
1
L
2
,
ΔL
3
(t) ≈
x
0
(t)+x
3
(t)
d
3
L
1
+ L
2
L
1
L
2
,
ΔL
4
(t) ≈
x
0
(t)+x
3
(t)+x
4
(t)
d
4
L
1
+ L
2
L
1
L
2
,
ΔL
5
(t) ≈
x
0
(t)+x
5
(t)
d
5
L
1
+ L
2
L
1
L
2
,
ΔL
6
(t) ≈
x
0
(t)+x
5
(t)+x
6
(t)
d
6
L
1
+ L
2
L
1
L
2
,
(13)
6 EURASIP Journal on Wireless Communications and Networking
where L
1
, L
2
,andd
i
areasdefinedin(6), and x
i
(t) is obtained
from the state-space model in (9)and(10).
Examples of simulated signal fading due to swaying
tree using the new model for low- and high-wind speed
conditions are shown in Figures 9 and 10,respectively.The
simulation parameters are given in Ta bl e 3. In general, A
i
values in the range 10 to 80 m
2
, m
i
values in the range
0.01 to 30 kg, k
i
values in the range 5 × 10
2
to 5 ×
10
4
N/m
2
, c
i
values in the range 0 to 35 can be used in the
model. These parameter ranges are obtained by performing
simulations using different tree parameters and comparing
the simulated first and second-order statistics to these of
measurements from Site 1 (since the new model is intended
for modeling signal fading due to a single tree). Then, the
parameter ranges are defined based on the agreements found
between the measured and simulated first- and second-
order statistics. Finally, realistic values within the defined
parameter ranges are assigned to each tree component;
see Ta bl e 3 (no curve fitting or numerical optimization is
used). For example, as shown above the parameter range
found for m
i
is between 0.01 to 30 kg, from this a realistic
value for m
0
(the trunk) should be close to the upper
limit of the parameter rage,that is, somewhere between 15
to 30 kg. In this case, 20 kg is randomly chosen from the
realistic value range for m
0
;seeTa bl e 3. The same selection
process based on realistic values within parameter ranges is
performed for the other tree parameters. Comparisons of the
cumulative distribution functions (CDFs), autocorrelation
functions (ACFs), level-crossing rates (LCRs), and average
fade durations (AFDs) of the measured and simulated
receivedsignalsatdifferent frequencies are shown in Figures
11–18. The LCRs and AFDs are normalized to the Root-
Mean-Square (RMS) level. The CDF describes the prob-
ability distribution of a random variable. While the ACF
is a measure of the degree to which two time samples of
the same random process are related and is expressed as
[21]
R
h
t
1
, t
2
= E
h
t
1
h
t
2
, (14)
where E is the expectation, h(t
1
)andh(t
2
)arerandom
variables obtained by observing h(t)attimet
1
and t
2
,respec-
tively. The LCR measures the rapidity of the signal fading. It
determines how often the fading crosses a given threshold in
the positive-going direction [22]. The AFD quantifies how
long the signal spends below a given threshold, that is, the
average time between negative and positive level-crossings
[22]. The CDF, ACF, LCR, and AFD determine the first- and
second-order statistics of the channel.
The effect of wind speed on the channel statistics can
be observed from Figures 11–14 which show comparisons
of measured (leaved dry deciduous trees (Site 1) at 29 GHz)
and simulated channel statistics during low- and high-
wind speed conditions. We can observe from Figure 11
that the probability the received signal is less than a given
threshold increases with increasing wind speed. Note also
from Figure 12 how fast the ACF decays during high wind
speed compared to low wind speed conditions. The increase
−34
−33
−32
−31
−30
−29
−28
−27
−26
Received signal (dBm)
0 20 40 60 80 100 120
Time (s)
Figure 9: Simulated signal fading using the new model at 29 GHz
during low wind speed conditions (w
m
= 2 m/s). All simulation
parameters are given in Tab le 3.
rate of signal changing activity during windy conditions
can be implied from the LCR curves in Figure 13.In
addition, the effect of high wind speed which results in
deep signal fading with short durations can be observed
from the AFD curves shown in Figure 14. The frequency
dependency of the channel is evident from Figure 15–
18 which show comparisons between measured (leaved
dry deciduous trees (Site 1) at 2.45, 5.25, and 60 GHz)
and simulated channel statistics during high wind speed
conditions (w
m
= 5 m/s). The probability that the received
signal is less than a given threshold increases with increasing
frequency; see Figure 15. We can also observe from Figure 16
that the autocorrelation function decays more rapidly for
high frequency compared to low-frequency signals. The
increasing rate of signal changing activity and the increasing
existence of deep signal fading with increasing frequency
can be observed from the LCR and AFD curves shown in
Figures 17 and 18, respectively. The frequency dependency
of the channel statistics is directly related to the signal
wavelength. As the frequency increases, the signal wavelength
decreases which results in increasing sensitivity to path
length differences caused by swaying tree components. In
general, the agreements found between the measured and
simulated received signals in terms of both first- and second-
order statistics are satisfactory; see Figures 11–18.Moreover,
the results shown in Figures 11–18 suggest that the swaying
of tree components with wind can highly impact the quality
and availability of a given link, and should be consid-
ered when designing and evaluating systems at different
frequencies.
5. Conclusion
In this paper, we use available measurements at 2.45, 5.25,
29, and 60 GHz, and wind speed data to study the dynamic
EURASIP Journal on Wireless Communications and Networking 7
Table 3: Simulation parameters.
Wind parameters Other parameters
w
m
= 2 m/s (low wind) C
d
= 0.35 [16] K-factor for 2.45 GHz = 6dB(atw
m
= 5m/s)
w
m
= 5 m/s (high wind) ρ = 1.226 kg/m
3
[16] K-factor for 5.25 GHz = 1dB(atw
m
= 5m/s)
k
σ
= 0.434 T
s
= 0.002 s K-factor for 29 GHz = 11 dB (at w
m
= 2m/s)
h
= 10 m K-factor for 29 GHz = −5dB(atw
m
= 5m/s)
K-factor for 60 GHz
= −6dB(atw
m
= 5m/s)
L
1
= 3000 m and L
2
= 100 m
Tre e p ar am et er s
d
0
= 1.0m A
0
= 66.2m
2
m
0
= 20 kg k
0
= 1.0 ×10
4
N/m c
0
= 20.0
d
1
= 3.0m A
1
= 21.0m
2
m
1
= 1.0kg k
1
= 1.0 ×10
3
N/m c
1
= 15.0
d
2
= 3.7m A
2
= 7.80 m
2
m
2
= 0.02 kg k
2
= 7.0 ×10
3
N/m c
2
= 2.00
d
3
= 2.5m A
3
= 22.9m
2
m
3
= 2.0kg k
3
= 6.0 ×10
2
N/m c
3
= 14.0
d
4
= 2.7m A
4
= 9.70 m
2
m
4
= 0.03 kg k
4
= 8.0 ×10
3
N/m c
4
= 1.80
d
5
= 2.8m A
5
= 23.5m
2
m
5
= 2.5kg k
5
= 1.1 ×10
3
N/m c
5
= 14.5
d
6
= 3.2m A
6
= 10.4m
2
m
6
= 0.04 kg k
6
= 5.0 ×10
3
N/m c
6
= 2.00
−80
−70
−60
−50
−40
−30
−20
Received signal (dBm)
0 20 40 60 80 100 120
Time (s)
Figure 10: Simulated signal fading using the new model at 29 GHz
during high wind speed conditions (w
m
= 5 m/s). All simulation
parameters are given in Tab le 3.
effects of vegetation on propagating radiowaves. A new
simulation model for generating signal fading due to a
swaying tree has been developed by utilizing a multiple
mass-spring system to represent a tree and a turbulent
wind model. The model is validated in terms of first- and
second-order statistics such as CDF, ACF, LCR, and AFD
using measurements. The agreements found between the
measured and simulated first- and second-order statistics
of the received signals through vegetation are satisfactory.
Furthermore, Ricean K-factors for different wind speeds are
estimated from measurements. In general, the new model
has similar dynamical and statistical characteristics as those
observed from measurement results and can be used for
simulating different capacity enhancing techniques such as
adaptive coding and modulation and other fade mitigation
techniques.
10
−5
10
−4
10
−3
10
−2
10
−1
10
0
Pr (received signal < abcissa)
−80 −70 −60 −50 −40 −30 −20 −10
Received signal (dBm)
Measured high
Simulated high
Measured low
Simulated low
Figure 11: CDFs of measured (dry leaved deciduous trees (Site 1))
and simulated (using the new model) signals at 29 GHz during low
(w
m
= 2 m/s) and high (w
m
= 5 m/s) wind speed conditions. All
simulation parameters are given in Tab le 3.
Appendices
A. Path Length Difference due to Swaying
Tree Component
Using a trigonometric analysis of the paths shown in
Figure 6, L
3
and L
4
can be expressed as
L
3
=
L
2
1
+ d
2
= L
1
1+
d
2
L
2
1
,
L
4
=
L
2
2
+ d
2
= L
2
1+
d
2
L
2
2
.
(A.1)
8 EURASIP Journal on Wireless Communications and Networking
0
0.2
0.4
0.6
0.8
1
Autocorrelation
−10 −50 5 10
Time (s)
Measured high wind
Simulated high wind
Measured low wind
Simulated low wind
Figure 12: ACFs of measured (dry leaved deciduous trees (Site 1))
and simulated (using the new model) signals at 29 GHz during low
(w
m
= 2 m/s) and high (w
m
= 5 m/s) wind speed conditions. All
simulation parameters are given in Tab le 3.
0
0.5
1
1.5
2
2.5
3
Level crossing rate (per second)
−50 −40 −30 −20 −10 0 10 20
Level normalised to RMS level
Measured high wind
Simulated high wind
Measured low wind
Simulated low wind
Figure 13: LCRs of measured (dry leaved deciduous trees (Site 1))
and simulated (using the new model) signals at 29 GHz during low
(w
m
= 2 m/s) and high (w
m
= 5 m/s) wind speed conditions. All
simulation parameters are given in Tab le 3.
Assuming L
1
d and L
2
d, Taylor approximation can be
applied to yield
L
3
≈ L
1
1+
d
2
2L
2
1
,
L
4
≈ L
2
1+
d
2
2L
2
2
.
(A.2)
10
−3
10
−2
10
−1
10
0
10
1
10
2
Average fade duration (per second)
−50 −40 −30 −20 −10 0 10 20
Level normalised to RMS level
Measured high
Simulated high
Measured low
Simulated low
Figure 14: AFDs of measured (dry leaved deciduous trees (Site 1))
and simulated (using the new model) signals at 29 GHz during low
(w
m
= 2 m/s) and high (w
m
= 5 m/s) wind speed conditions. All
simulation parameters are given in Tab le 3.
10
−5
10
−4
10
−3
10
−2
10
−1
10
0
Pr (received signal < abcissa)
−80 −70 −60 −50 −40 −30 −20
Received signal (dBm)
Measured 2.45 GHz
Simulated 2.45 GHz
Measured 5.25 GHz
Simulated 5.25 GHz
Measured 60 GHz
Simulated 60 GHz
Figure 15: CDFs of measured (dry leaved deciduous trees (Site
1)) and simulated (using the new model) signals at 2.45, 5.25,
and 60 GHz during high (w
m
= 5 m/s) wind speed conditions. All
simulation parameters are given in Tab le 3.
L
3
+ L
4
is the path length when a tree component is at rest,
and by using (A.2), we get
L
3
+ L
4
≈ L
1
+ L
2
+
d
2
2
L
1
+ L
2
L
1
L
2
. (A.3)
L
5
+L
6
is the path length when a tree component is displaced.
Again performing a trigonometric analysis of Figure 6 and
EURASIP Journal on Wireless Communications and Networking 9
0
0.2
0.4
0.6
0.8
1
Autocorrelation
−10 −50 5 10
Time (s)
Measured 2.45 GHz
Simulated 2.45 GHz
Measured 5.25 GHz
Simulated 5.25 GHz
Measured 60 GHz
Simulated 60 GHz
Figure 16: ACFs of measured (dry leaved deciduous trees (Site
1)) and simulated (using the new model) signals at 2.45, 5.25,
and 60 GHz during high (w
m
= 5 m/s) wind speed conditions. All
simulation parameters are given in Tab le 3.
0
0.5
1
1.5
2
2.5
3
3.5
4
Level crossing rate (per second)
−40 −30 −20 −10 0 10 20
Level normalised to RMS level
Measured 2.45 GHz
Simulated 2.45 GHz
Measured 5.25 GHz
Simulated 5.25 GHz
Measured 60 GHz
Simulated 60 GHz
Figure 17: LCRs of measured (dry leaved deciduous trees (Site
1)) and simulated (using the new model) signals at 2.45, 5.25,
and 60 GHz during high (w
m
= 5 m/s) wind speed conditions. All
simulation parameters are given in Tab le 3.
applying a Taylor approximation by assuming L
1
d + x
and L
2
d + x, L
5
+ L
6
can be expressed as
L
5
+ L
6
≈ L
1
+ L
2
+
(d + x)
2
2
L
1
+ L
2
L
1
L
2
. (A.4)
10
−3
10
−2
10
−1
10
0
10
1
10
2
Average fade duration (per second)
−30 −20 −10 0 10 20
Level normalised to RMS level
Measured 2.45 GHz
Simulated 2.45 GHz
Measured 5.25 GHz
Simulated 5.25 GHz
Measured 60 GHz
Simulated 60 GHz
Figure 18: AFDs of measured (dry leaved deciduous trees (Site
1)) and simulated (using the new model) signals at 2.45, 5.25,
and 60 GHz during high (w
m
= 5 m/s) wind speed conditions. All
simulation parameters are given in Tab le 3.
The difference in path length when a tree component is at
rest and when it is displaced is then given by
ΔL
=
L
5
+ L
6
−
L
3
+ L
4
≈
2dx + x
2
2
L
1
+ L
2
L
1
L
2
.
(A.5)
Assuming further x
d (which is valid for trees not located
very near the transmitter or the receiver), the path length
difference can then be expressed as
ΔL
≈ xd
L
1
+ L
2
L
1
L
2
. (A.6)
B. Matrices for the State-Space Model
The state, y, and input, u, vectors defined in (9)and(10)are
given by
y
=
x
0
(t) ··· x
6
(t)
˙
x
0
(t) ···
˙
x
6
(t)
T
,(B.1)
u
=
f
0
(t) ··· f
6
(t)
T
. (B.2)
By taking the first derivation of (B.1),
˙
y
=
˙
x
0
(t) ···
˙
x
6
(t)
¨
x
0
(t) ···
¨
x
6
(t)
T
,(B.3)
where the double derivations
¨
x
0
(t) ···
¨
x
6
(t)in(B.3)are
defined in (7). From (9),
˙
y is given by
˙
y
= Ay + Bu,(B.4)
10 EURASIP Journal on Wireless Communications and Networking
where y and u are as defined in (B.1)and(B.2). In order (B.4)
to be equal to (B.3), the matrices A and B have to be equal to
A
=
0
7×7
I
7×7
A
21
A
22
,(B.5)
where 0
7×7
and I
7×7
are 7 × 7 zero and identity matrices,
respectively. A
21
and A
22
in (B.5)aregivenby
A
21
=
⎛
⎜
⎜
⎜
⎜
⎜
⎜
⎜
⎜
⎜
⎜
⎜
⎜
⎜
⎜
⎜
⎜
⎜
⎜
⎜
⎜
⎜
⎜
⎜
⎝
−
k
0
+ k
1
+ k
3
+ k
5
m
0
k
1
m
0
0
k
3
m
0
0
k
5
m
0
0
k
1
m
1
−
k
1
+ k
2
m
1
k
2
m
1
0000
0
k
2
m
2
−
k
2
m
2
0000
k
3
m
3
00−
k
3
+ k
4
m
3
k
4
m
3
00
000
k
4
m
4
−
k
4
m
4
00
k
5
m
5
0000−
k
5
+ k
6
m
5
k
6
m
5
0 0000
k
6
m
6
−
k
6
m
6
⎞
⎟
⎟
⎟
⎟
⎟
⎟
⎟
⎟
⎟
⎟
⎟
⎟
⎟
⎟
⎟
⎟
⎟
⎟
⎟
⎟
⎟
⎟
⎟
⎠
,
(B.6)
A
22
=
⎛
⎜
⎜
⎜
⎜
⎜
⎜
⎜
⎜
⎜
⎜
⎜
⎜
⎜
⎜
⎜
⎜
⎜
⎜
⎜
⎜
⎜
⎜
⎝
−
c
0
+ c
1
+ c
3
+ c
5
m
0
c
1
m
0
0
c
3
m
0
0
c
5
m
0
0
c
1
m
1
−
c
1
+ c
2
m
1
c
2
m
1
0000
0
c
2
m
2
−
c
2
m
2
0000
c
3
m
3
00−
c
3
+ c
4
m
3
c
4
m
3
00
000
c
4
m
4
−
c
4
m
4
00
c
5
m
5
0000−
c
5
+ c
6
m
5
c
6
m
5
00000
c
6
m
6
−
c
6
m
6
⎞
⎟
⎟
⎟
⎟
⎟
⎟
⎟
⎟
⎟
⎟
⎟
⎟
⎟
⎟
⎟
⎟
⎟
⎟
⎟
⎟
⎟
⎟
⎠
,
(B.7)
B
=
0
7×7
B
21
,(B.8)
where B
21
in (B.8) is a diagonal matrix expressed as B
21
=
diag{1/m
0
···1/m
6
}.
The output vector x in (10)isdefinedas
x
=
x
0
(t) ··· x
6
(t)
T
. (B.9)
From (10), x is given by
x
= Cy + Du. (B.10)
For (B.10)tobeequalto(B.9), the matrices C and D have to
be equal to
C
=
I
7×7
0
7×7
,
D
=
0
7×7
.
(B.11)
Acknowledgments
This work is supported by the research council of Norway
(NFR). The authors would like to thank the Communi-
cations Research Centre Canada (CRC), especially Simon
Perras for providing measurement data. The authors would
like also to thank Morten Topland of UNIK for fruitful
discussions.
References
[1] M. Cheffena, Modeling and prediction of millimeter wavelength
channels, Ph.D. thesis, Norwegian University of Science and
Technology, Trondheim, Norway, October 2008.
[2] M. O. Al-Nuaimi and A. M. Hammoudeh, “Measurements
and predictions of attenuation and scatter of microwave
signals by trees,” IEE Proceedings: Microwaves, Antennas and
Propagation, vol. 141, no. 2, pp. 70–76, 1994.
[3] I. J. Dilworth and B. L’Ebraly, “Propagation effects due to
foliage and building scatter at millimetre wavelengths,” in
Proceedings of the 9th International Conference on Antennas and
Propagation, vol. 2, pp. 51–53, Eindhoven, The Netherlands,
April 1995.
[4] Recommendation ITU-R P.833-5, “Attenuation in vegetation,”
Tech. Rep. P.833-2, ITU, Geneva, Switzerland, 2005.
[5]A.M.Randle,Dynamic radio channel effects from L-band
foliage scatter, Ph.D. thesis, University of York, York, UK,
September 1999.
[6] K. H. Craig, Ed., “Propagation planning procedures for
LMDS,” AC215 CRABS, Deliverable D3P1b, January 1999,
/>[7] S. Perras and L. Bouchard, “Fading characteristics of RF
signals due to foliage in frequency bands from 2 to 60 GHz,”
in Proceedings of the 5th International Symposium on Wireless
Personal Multimedia Communications, vol. 1, pp. 267–271,
Honolulu, Hawaii, USA, October 2002.
[8] M. H. Hashim and S. Stavrou, “Dynamic impact character-
ization of vegetation movements on radiowave propagation
in controlled environment,” IEEE Antennas and Wireless
Propagation Letters, vol. 2, no. 1, pp. 316–318, 2003.
[9] T. Sofos and P. Constantinou, “Propagation model for vege-
tation effects in terrestrial and satellite mobile systems,” IEEE
Transactions on Antennas and Propagation,vol.52,no.7,pp.
1917–1920, 2004.
[10] M. Cheffena and T. Ekman, “Modeling the dynamic effects of
vegetation on radiowave propagation,” in Proceedings of the
IEEE International Conference on Communications (ICC ’08),
pp. 4466–4471, Beijing, China, May 2008.
[11] W. E. Leithead, S. de la Salle, and D. Reardon, “Role and
objectives of control for wind turbines,” IEE Proceedings C, vol.
138, no. 2, pp. 135–148, 1991.
[12] C. Nichita, D. Luca, B. Dakyo, and E. Ceanga, “Large band
simulation of the wind speed for real time wind turbine
simulators,” IEEE Transactions on Energy Conversion, vol. 17,
no. 4, pp. 523–529, 2002.
[13] E. B. Muhando, T. Senjyu, N. Urasaki, A. Yona, H. Kinjo, and
T. Funabashi, “Gain scheduling control of variable speed WTG
under widely varying turbulence loading,” Renewable Energy,
vol. 32, no. 14, pp. 2407–2423, 2007.
[14] “European Standard for Wind Loads,” Eurocode EN 1991-1-4,
WIND ACTION.
EURASIP Journal on Wireless Communications and Networking 11
[15] K. R. James, N. Haritos, and P. K. Ades, “Mechanical stability
of trees under dynamic loads,” American Journal of Botany, vol.
93, no. 10, pp. 1522–1530, 2006.
[16] H. Peltola, S. Kellom
¨
aki, H. V
¨
ais
¨
anen, and V P. Ikonen, “A
mechanistic model for assessing the risk of wind and snow
damage to single trees and stands of Scots pine, Norway
spruce, and birch,” Canadian Journal of Forest Research, vol.
29, no. 6, pp. 647–661, 1999.
[17] J. C. DalBello, G. L. Siqueira, and H. L. Bertoni, “Effects of
vegetation on urban cellular systems,” in Proceedings of IEEE
International Conference on Universal Personal Communica-
tions (ICUPC ’98), vol. 1, pp. 113–116, Florence, Italy, October
1998.
[18] A. Kajiwara, “LMDS radio channel obstructed by foliage,” in
Proceedings of IEEE International Conference on Communica-
tions (ICC ’00), vol. 3, pp. 1583–1587, New Orleans, La, USA,
June 2000.
[19] N. Naz and D. D. Falconer, “Temporal variations characteriza-
tion for fixed wireless at 29.5 GHz,” in Proceedings of the 51st
IEEE Vehicular Technology Conference (VTC ’00), vol. 3, pp.
2178–2182, Tokyo, Japan, May 2000.
[20] L. J. Greenstein, D. G. Michelson, and V. Erceg, “Moment-
method estimation of the Ricean K-factor,” IEEE Communi-
cations Letters, vol. 3, no. 6, pp. 175–176, 1999.
[21] B. Sklar, Digital Communications, Prentice-Hall, Englewood
Cliffs, NJ, USA, 2001.
[22] S. R. Saunders, Antennas and Propagation for Wireless Com-
munication Systems, John Wiley & Sons, New York, NY, USA,
2003.