Báo cáo hóa học: " Research Article Achievable Throughput-Based MAC Layer Handoff in IEEE 802.11 Wireless Local Area Networks" pptx
Bạn đang xem bản rút gọn của tài liệu. Xem và tải ngay bản đầy đủ của tài liệu tại đây (1.35 MB, 15 trang )
Hindawi Publishing Corporation
EURASIP Journal on Wireless Communications and Networking
Volume 2009, Article ID 467315, 15 pages
doi:10.1155/2009/467315
Research Article
Achievable Throughput-Based MAC Layer Handoff in
IEEE 802.11 Wireless Local Area Networks
SungHoon Seo,
1
JooSeok Song,
1
Haitao Wu,
2
and Yongguang Zhang
2
1
Department of Computer Science, Yonsei University, Seoul 120-749, South Korea
2
Wireless and Networking Group, Microsoft Research Asia, Beijing 100190, China
Correspondence should be addressed to SungHoon Seo,
Received 27 March 2009; Accepted 10 June 2009
Recommended by Naveen Chilamkurti
We propose a MAC layer handoff mechanism for IEEE 802.11 Wireless Local Area Networks (WLAN) to give benefit to bandwidth-
greedy applications at STAs. The proposed mechanism determines an optimal AP with the maximum achievable throughput
rather than the best signal condition by estimating the AP’s bandwidth with a new on-the-fly measurement method, Transient
Frame Capture (TFC), and predicting the actual throughput could be achieved at STAs. Since the TFC is employed based on the
promiscuous mode of WLAN NIC, STAs can avoid the service degradation through the current associated AP. In addition, the
proposed mechanism is a client-only solution which does not require any modification of network protocol on APs. To evaluate
the performance of the proposed mechanism, we develop an analytic model to estimate reliable and accurate bandwidth of the
AP and demonstrate through testbed measurement with various experimental study methods. We also validate the fairness of the
proposed mechanism through simulation studies.
Copyright © 2009 SungHoon Seo et al. This is an open access article distributed under the Creative Commons Attribution License,
which permits unrestricted use, distribution, and reproduction in any medium, provided the original work is properly cited.
1. Introduction
As wireless networking grows in popularity, various radio
access technologies have been developed to provide bet-
ter environment for user data service. Most of all, IEEE
802.11 Wireless Local Area Network (WLAN) is one of
the dominant wireless technologies to support high-speed
network access nowadays. The WLAN basically forms an
infrastructure with two network components, Access Point
(AP) and Station (STA). An AP is generally distributed at a
fixed location, and the WLAN infrastructure connects STAs
to a wired network via the AP within their communication
range. AP’s signal range is denoted by Basic Service Set (BSS)
or hotspot which generally provides coverage within a few
ten-meter radius.
In large scale wireless networks, multiple APs are densely
deployed, and their hotspot ranges are overlapped in the
vicinity of one another (e.g., campus, building, and airport
lounge) with different types of physical (PHY) standard
and channel frequency. Each PHY standard provides various
channel modulation rate (e.g., 1, 2, 5.5, 11 Mbps for 802.11b
and 6, 12, 24 Mbps for 802.11a); thus the performance may
differ in accordance with AP configuration setting. Also,
each AP can be configured with a different channel; thus
adjacent APs with orthogonal frequencies (e.g., 1, 6, and
11 in 802.11b) are recommended to avoid interchannel
interference which causes the disruption of signal quality and
channel utilization [1].
Due to the nature of 802.11, an STA can associate with
only an AP at a time through a channel assigned on the
AP; thus at the same time the STA cannot listen to any
signal from APs operated on the other channels. In order to
listen to signals from other channel APs, STAs should switch
their channel, but it may cause the blocking of on-going
communication through their current associated AP. Even if
STAs can listen to beacon frames from other APs operated
on the same channel, it is limited only when their listen
period and the APs’ beacon interval are exactly matched. This
is because the 802.11 STAs repeat to change their Network
Interface Card (NIC) mode in sleeping and listening to
beacon frame for Power Saving.
When the signal condition from the current associated
AP becomes poor to communicate, STAs should discover
other APs and continue the communication by performing
2 EURASIP Journal on Wireless Communications and Networking
aMAClayerhandoff.Forthediscovery,STAsperformactive
scanning by broadcasting a special management frame, that
is, Probe Request, to every channel supported by their NIC.
AnSTAtriggerstheactive scanning when the Received Signal
Strength Index (RSSI) of the current associated AP is below
the predefined threshold (usually about
−90 dBm), and the
STA builds the list of the AP available to itself. Then, the STA
performs handoff to an AP whose signal condition is better
than the current associated AP, mainly based on the RSSI as
in [2, 3]. However, using the RSSI as a criterion to perform
handoff is not good enough because the RSSI itself does not
mean the AP’s capability information.
Therefore we propose a MAC layer handoff mechanism
for IEEE 802.11 WLAN by using AP’s capability information
as a handoff criterion, especially an achievable throughput
from APs. To estimate the achievable throughput, we devise
a new method, namely, Transient Frame Capture (TFC). The
TFC works with the promiscuous mode of WLAN NIC so
that STAs can keep their connections through the current
associated AP without service degradation. The proposed
handoff mechanism allows STAs to determine an optimal AP
whose bandwidth satisfies the requirement of applications
at the STAs, thus gives the most benefit to the STAs when
performing the handoff. We develop an analytic model and
demonstrate through testbed measurements with various
experimental study methods to show the effects on reliability
and accuracy of the throughput estimation. Furthermore,
we perform simulation studies to validate the proposed
mechanism in regard to the fairness of APs. Especially, this
paper contributes in the following four aspects.
(1) We provide a client-only solution for the achievable
throughput-based handoff mechanism so that it
does not require any modifications or changes on
AP’s protocol and configuration. That is, it works
with any existing setup of already deployed WLAN
infrastructure.
(2) We devise a new method to estimate the actual
bandwidth capacity as well as the achievable through-
put from neighbor APs without service degradation
through the current associated AP.
(3) From a view point of AP deployment, the trafficload
on multiple APs should be fairly distributed. The
proposed handoff mechanism enables STAs to select
the most bandwidth-beneficial AP. This also gives an
advantage of balancing the load on the different types
of APs.
(4) Our implementation and experimental studies are
the first attempt to address AP’s throughput measure-
ment only from the STA side. Also, the measurement
estimates near the boundary of the actual throughput
in the 802.11 environments.
The rest of this paper is organized as follows. Section 2
introduces background on MAC layer handoff and band-
width estimation. In Section 3, we describe the proposed
handoff mechanism which is the basis of achievable through-
put. Section 4 provides details of TFC algorithm, and
Section 5 presents the analytic model to estimate the achiev-
able throughput. In Section 6, we show the evaluation of the
proposed mechanism through experiment and simulation
studies, and Section 7 concludes this paper.
2.RelatedWorkandMotivation
The IEEE 802.11 MAC layer handoff procedure is split into
trigger, discovery, AP selection, and commitment (Through-
out this paper, the MAC layer handoff is alternatively used
for the term “layer 2 handoff” or “L2 handoff”). The most
of previous researches [2–4] are based on the RSSI measured
from current associated AP as a criterion not only to trigger
handoff but also to select optimal AP. After an STA triggers
handoff, it discovers neighbor APs and channels available to
itself with active scanning to all channels supported by its
WLAN NIC which causes the major portion of the entire
handoff latency. Even if authors of [3, 5] proposed solutions
to reduce the latency, they have limitations of a difficulty to
modify already deployed AP software and ineffective cost to
equip additional scanning purpose NIC at the STA. The AP
selection procedure is also based on the RSSI so that STAs
perform handoff to an AP with the maximum RSSI. Wu et
al. [4] proposed an RSSI-based AP selection mechanism to
reduce the handoff latency and to avoid service degradation
of VoIP traffic. However, RSSI itself does not indicate the
AP’s capability (e.g., achievable bandwidth); thus the STA
may suffer the severe degradation of on-going service after
performing the handoff to a highly loaded AP.
Bandwidth estimation has been a hot research topic
and mainly addressed by using packet dispersion [6]. The
packet dispersion was originally designed to estimate end-
to-end bandwidth on wired network environment where
cross traffic exists along with the intermediate nodes in the
routing path. However, the packet dispersion over- or under-
estimates the bandwidth on the wireless network environ-
ment; thus a few research [7–12] has been investigated to
estimate accurate bandwidth for the wireless environment.
References [7, 8] provided solutions to estimate the sat-
urated and the potential bandwidth on AP by analyzing
the distribution of packet delay and beacon frames. In
[9], Li et al. attempted to use the packet dispersion in
the 802.11 WLAN by analyzing the channel access time.
Also, as a passive manner, [10–12] presented solutions to
estimate bandwidth on AP by analyzing channel occupation
probability. However, these methods mainly focused on the
bandwidth measurement itself by actively sending probes to
the AP or passively receiving beacons from the AP (one-way
measurement); thus they are not applicable methods as a
client-only solution which limits the protocol changes at APs.
Most recently, Kandula et al. [13] proposed a client-
only solution to maximize user throughput based on the
available bandwidth measurement by switching channel
between multiple APs. To increase the user throughput,
the solution virtually maintains multiple IP flows mapped
with WLAN NIC’s duplicated MAC addresses. However, it
cannot maintain a single flow (e.g., UDP-based application)
separately through multiple APs because the throughput gain
EURASIP Journal on Wireless Communications and Networking 3
depends on the number of flows. Moreover, STAs should
always maintain connections and monitor actual packets
through multiple APs to measure available bandwidth. It
means that the solution may degrade the entire channel uti-
lization since STAs should be fully connected to the multiple
APs whether they are used for communication or not.
2.1. Problem Statement—The Motivation. As mentioned
earlier, most of L2 handoff mechanisms addressed RSSI as
ahandoff criterion but the RSSI itself does not indicate the
actual capability of APs. If an STA has the knowledge of AP’s
capability information (i.e., achievable throughput after the
STA handoff to the AP), it can help the STA to determine
a better AP which provides higher throughput to the STA.
Even if IEEE 802.11e [14] provides a capability information,
the number of STA associated with the AP, this information is
not enough to estimate the AP’s current bandwidth occupied
by active STAs. New radio resource measurements for WLAN
are defined in IEEE 802.11k [15], and how meaningful data
can be collected through the measurements is discussed in
[16]. The 802.11k enables STAs to request measurements
(e.g., channel occupation rate) from other STAs (or APs), but
it requires the protocol modification of both STAs and APs.
Furthermore, measurement frames either on the operating
or nonoperating channel affect the on-going trafficthus
they may increase the signaling overhead which causes the
interruption of data services.
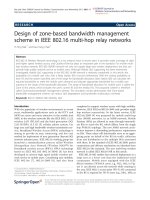
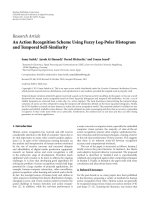
Figure 1 illustrates a scenario that an STA moves across
the overlapped hotspots, BSS1 and BSS2, with two APs,
where each hotspot is configured with a different channel
number (1 and 149). In the BSS1, the STA has associated with
current AP (cAP) which supports 802.11b. The STA’s RSSI
from the cAP is very high (
−45 dBm), but the bandwidth
loaded on the cAP is relatively higher because other n STAs
are activated through the cAP in the BSS1 (e.g., 4 STAs,
from STA 1 to STA 4, each of these individually occupies
about 1 Mbps bandwidth on the cAP). On the other hand, in
the BSS2, a neighbor AP (nAP) supports 802.11a. Relatively
lower RSSI of the nAP is acceptable for the STA to associate,
but the traffic load on the nAP is lower than that on the cAP
(<1 Mbps). If the STA associates with the nAP even in lower
RSSI, it is beneficial for the STA to achieve higher bandwidth
through the nAP.
In this sense, using the RSSI as a handoff criterion
in the conventional MAC layer handoff mechanism is not
good enough to give more benefit to bandwidth-greedy
applications (such as FTP, P2P file sharing, and e-mail)
which require bandwidth as high as possible. We therefore
take the achievable throughput from APs available to STAs
into account the main criterion of the proposed handoff
mechanism. By utilizing newly devised method, Transient
Frame Capture (TFC), STAs not only estimate bandwidth
capacity but also predict the achievable throughput from the
target AP (as denoted by nAP in Figure 1). Since the TFC is
performed in a very short time with fast channel switching,
STAs do not suffer from the service degradation through the
cAP even occurring retransmissions caused by frame loss and
delayed ACK transmission. Moreover, the TFC is passively
conducted under the promiscuous mode operation of NIC; it
thus affects no interference to other contending STAs within
the same channel BSS. With the result of the TFC, STAs
can perform handoff to an optimal AP which guarantees the
maximum achievable throughput to the STAs.
3. The Proposed MAC
Layer Handoff Mechanism
In this section we describe the details of the proposed MAC
layer handoff mechanism which addresses the achievable
throughput as a handoff criterion rather than the RSSI. A
newly devised TFC method enables STAs to estimate the
bandwidth capacity and to predict the achievable throughput
of neighbor APs. Since no guarantee STAs will be able
to achieve similar performance due to asymmetric fading,
we further investigate how wireless condition affects the
predicted achievable throughput according to the link quality
such as RSSI and Frame Error Rate (FER).
We summarize the procedure for our handoff mechanism
as follows.
(1) The proposed handoff is triggered.
(2) Build a BSS list for neighbor APs available to the STA.
We assume that this step can be actively performed by
channel scanning as in [4].
(3) Capture 802.11 frames on the BSS of neighbor APs
(appeared in the BSS list) by utilizing Transient
Frame Capture.
(4) Estimate the achievable throughput from each of the
APs by analyzing the captured frame information.
(5) Select an optimal AP with the maximum achievable
throughput and perform handoff to the AP.
3.1. AP Selection Algorithm. STAs should select a target
AP before they perform a handoff. We use an achievable
throughput as a metric to determine an optimal target AP
among neighbor APs. The AP selection for the proposed
handoff mechanism is conducted with an algorithm as
follows. Once an STA finds neighbor APs with a scan method
asintroducedin[4], it builds a BSS list for every neighbor
AP. Let U denoteasetofeveryneighborAPintheBSS
list, and it is given by U
={AP
1
,AP
2
, ,AP
N
} where the
STA finds N APs, thereby AP
i
∈ U(1 ≤ i ≤ N). Then the
STA performs the TFC and collects information about the
achievable throughput (a
i
) and RSSI (s
i
) on every AP in the
set U. The AP
i
is assumed to have the maximum achievable
throughput which is determined by
arg max
i
a
i
∈
i∀j : a
j
≤ a
i
,
(1)
and then the STA performs handoff to the AP
i
.
When there exists more than one AP with the same
maximum achievable throughput using (1), the AP selection
algorithm employe the RSSI as another metric. Let
U denote
a set of APs,
U ={AP
1
,AP
2
, ,AP
M
},whereM APs are
determined with the same achievable throughput, thereby
4 EURASIP Journal on Wireless Communications and Networking
STA b
STA a
STA 1
STA 2
STA n
cAP
nAP
BSS2
BSS1
STA
Movement
Overlapped
hotspot area
. . .
802.11b with CH# 1
loaded BW>4 Mbps
RSSI to STA = 45 dBm
-
802.11a with CH# 149
loaded BW<1 Mbps
RSSI to STA = 60 dBm
-
Figure 1: A scenario for MAC layer handoff within overlapped hotspot area.
AP
i
∈ U(1 ≤ i ≤ M ≤ N). As similar to (1), an optimal AP
is determined by arg max
i
s
i
, and the STA finally performs to
the AP
i
which has the maximum a
i
as well as s
i
.
4. Transient Frame Capture
We mentioned that the proposed handoff mechanism utilizes
the Transient Frame Capture (TFC) not only to estimate the
bandwidth capacity of neighbor APs but also to predict the
achievable throughput from the neighbor APs. Utilizing the
TFC has several advantages as follows. (1) To the best of our
knowledge, there exists no approach to passively measure
the AP’s bandwidth capacity and achievable throughput
without any AP protocol change, and thus it can be
easily applied to the any existing 802.11 NIC. (2) The
TFC works with switching the NIC’s operation status to a
promiscuous mode during very short period, and thus it
does not affect the current data service in use (The most
of commercial IEEE 802.11 WLAN NIC supports to use the
promiscuous operation by both kernel and user level API).
(3) Measured information by utilizing the TFC can be used
for estimating the achievable throughput from the neighbor
APs and properly reflects wireless network environment
which dynamically varies according to the link condition.
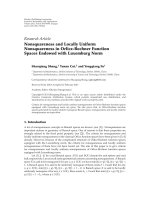
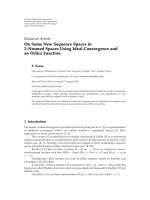
Figure 2 shows an example when an STA periodically
performs the TFC to nAPs belonging to the BSS list which
is collected by active scanning; for example, nAP1 and
nAP2 work on channel number X
and X
,respectively.
Each TFC procedure continues a certain time duration,
Capture Period (CP). To minimize the service degradation
of activated connection through cAP, the length of the CP
should be as short as possible, but it affects the reliability
of throughput estimation. The impact of the CP will be
discussed in Section 6.1.
The detail procedure of a TFC is described as follows.
Once an STA starts a TFC, it switches the channel of its NIC
to the target channel of the nAP (X
→ X
)andchanges
to the promiscuous mode to capture frames on the target
channel. During a CP, the STA captures all WLAN frames
and builds the nAP specific information based on a filtered
STA performs handoff to a nAP with maximum achievable throughput
1. Switch channel to X
2. Change NIC to promiscuous mode
3. Capture all frames on channel X
4. Frame filtering (w/nAP’s BSSID)
5. Change back to STA mode
6. Switch back to original channel X
One TFC procedure (for nAP 1)
Build BSS list for nAP
by active scanning
(nAP1: X, nAP2: X )
Associated with cAP
on channel number X
Capture
period
TFC start
TFC end
TFC
(nAP 2)
TFC
(nAP 1)
. . . .
Figure 2: Transient frame capture.
set of frames whose sender or receiver address field in MAC
header matches to the nAP’s BSS Identification (BSSID).
As soon as a CP expires, the TFC ends with changing the
STA’s mode back to the original (infrastructure mode) and
switching the channel back to the original for the cAP (X
→
X). Since the TFC is conducted by fast channel switching
within operating and nonoperating channels, STAs in range
of several neighbor APs can obtain individual information
of the APs even in a different channel. For neighbor APs
in a same channel, STAs can collect the information by
performing one TFC to the channel.
By utilizing the TFC, STAs can obtain several infor-
mation, such as (sub)type, length, and Traffic Indication
Map (TIM) fields from the MAC header of the captured
frames. These pieces of information play an important role
to infer the number of active STA which currently receives or
transmits frames via the nAP, not the number of associated
STA as in [14]. The number of active STA involved in
receiving downlink frame from AP can be easily inferred by
counting the receiver address field in downlink data frames.
EURASIP Journal on Wireless Communications and Networking 5
Table 1: Parameter values for the analysis of throughput estima-
tion.
Parameter Values Descriptions
ρ 20 μsec A slot time
SIFS 10 μsec Short Interframe Space
DIFS 50 μsec Distributed IFS
ACK
TIMEOUT 300 μsec ACK timeout
L
PHY
128 bits PHY header length
L
MAC
272 bits MAC header length
L
ACK
112 bits + L
PHY
ACK frame length
L variable Data length
However, a certain STA is activated but currently staying in
power saving mode. We thus additionally address the TIM
field in Beacon frames as to infer the number of receiving
STA. Since the TIM includes a set of association ID of the STA
whose downlink trafficisnowbuffered at the AP, counting 1
set bit denotes the number of active STA in receiving.
On the other hand, inferring the number of active STA
involved in transmitting uplink frame to AP differs from
that in receiving downlink frame because the STA cannot
capture every frame on the target channel (X
)becauseof
following reasons. The first reason is that APs and STAs may
drop frames if their internal buffer overflows. Fortunately, it
is ignorable since we only focus our throughput estimation
on the transmission rate of frames actually leaved from the
APs or STAs. The other reason is that an STA is not in
the propagation range of other STAs as known as hidden
terminal. As an example, in Figure 1, the propagation range
of nAP and STA a is reachable to the STA but that of STA
b is not. It means that, by utilizing the TFC, the STA can
capture only frames propagated from the nAP and the STA
a, whereas it is impossible to capture any frame transmitted
from the STA b. Therefore, we use the receiver address field
in ACK frames to infer the number of active STA involved in
transmitting uplink frame to the AP.
4.1. Implementation Issues. We implement a real-system
testbed and demonstrate the TFC to estimate the bandwidth
capacity and the achievable throughput from APs. The
key part of the testbed implementation is the basis of the
kernel level miniport driver for NIC in Realtek-8185 chipset
under Microsoft Windows Vista’s Network Driver Interface
Specification (NDIS) architecture.
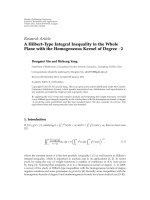
Figure 3(a) shows the overall architecture of the testbed
where TFC functionalities are implemented as a capture
module in the miniport driver. By calling the special function
(DeviceIo-Control) from user application, the capture mod-
ule starts the TFC procedure. While the TFC is performed,
every frame captured on the specific channel is stored in
Net Buffer List (NBL), and then the user application refers
the captured frame by reading the address of the NBL as
in Figure 3(b). Whenever the capture module performs a
TFC procedure, it starts a timer for the Capture Period (CP
timer) and saves the current context information such as the
channel number and the operation mode of the NIC. As soon
as the CP timer expires, the capture module restores to the
original context information and finishes the TFC procedure.
5. Achievable Throughput Estimation
This section provides an analytic model to estimate the
current bandwidth loaded on a target AP and to predict
the achievable throughput which is expected after the STA
associates with the AP. In addition, we also investigate
the achievable throughput taking into account the rate
discounted according to the wireless link condition, that is,
RSSI and FER. Symbols for the analysis are explained in
Ta bl e 1, and they will be used throughout this paper.
5.1. Bandw idth Capacity Estimat ion. Let n denote the num-
ber of active STA which is contending in an AP’s BSS, and
τ is the probability that an STA transmits in a given time
slot. For a certain time slot, P
i
, P
s
,andP
c
are the probability
that the channel is idle, the transmission is successful
because only one STA tries transmission, and the collision is
occurred when more than two STAs simultaneously transmit,
respectively, which are given by
P
i
= (1 − τ)
n
,
P
s
= n × τ(1 −τ)
n−1
,
P
c
= 1 − P
i
−P
s
.
(2)
Let L
PAYLOAD
and L
UPPER
denote the length of a frame
(payload) and upper layer protocol headers (i.e., IP and
UDP), where L
= L
PAYLOAD
− L
UPPER
. The average time
associated with one successful transmission, T
s
,andwith
collision, T
c
,aregivenby
T
s
= T
PAYLOAD
+ T
PHY
+ T
MAC
+ T
ACK
+ SIFS + DIFS,
T
c
= T
PAYLOAD
+ T
PHY
+ T
MAC
+ACK TIMEOUT + DIFS,
(3)
where T
PAYLOAD
, T
ACK
, T
PHY
,andT
MAC
are the average time
associated with the transmission of a payload, an ACK frame,
a PHY header, and a MAC header, respectively. These can be
easily obtained by dividing L
PAYLOAD
, L
ACK
, L
PHY
,andL
MAC
into the channel rate (CR) of the AP, respectively.
Based on (2)and(3), channel idle ratio (R
idle
)and
channel busy ratio (R
busy
) can be expressed by
R
idle
=
P
i
×ρ
P
i
×ρ + P
s
×T
s
+ P
c
×T
c
,
R
busy
= 1 − R
idle
.
(4)
On substituting L
×P
s
for P
i
×ρ in (4) we obtain the target
AP’s bandwidth, B, which is given by
B
=
L ×P
s
P
i
×ρ + P
s
×T
s
+ P
c
×T
c
.
(5)
By assuming that all data length is equal to L, R
busy
can be
derived from a function of n and τ. With the number of
DATA frame (N
DATA
) andACK frame (N
ACK
)measuredby
6 EURASIP Journal on Wireless Communications and Networking
Miniportdriver
Capture
module
User level
Kernel level
NDIS interface
802.11 NIC
User application
(a)
MPCaptureTimerCallback
Empty
Received
frame
Read frame from
buffer address
Save context information
Restore context information
Circular
queue
Start
CP timer
CP timer
expiry
MPDeviceIoControl
Start_Capture
Capture module in
miniportdriver
MPCaptureNBL
ReadFile
DeviceIoControl
(CH#, CP)
User application
(b)
Figure 3: (a) Overall architecture of testbed implementation. (b) Work flows between user application and the capture module in the
miniport driver.
the TFC, we can obtain the channel time associated with one
successful transmission, T
s
, for downlink and uplink traffic.
Thus, for a CP, the busy ratio is given by R
busy
= ((N
ACK
+
N
DATA
) ·T
s
+(N
DATA
−N
ACK
) ·T
c
)/CP where N
DATA
−N
ACK
denotes the number of unacked data which is retransmitted
during the channel collision, T
c
. In addition, n is also inferred
by the TFC as mentioned in Section 4. Based on the obtained
R
busy
and n,wecandefineτ as a nonlinear algebraic equation.
Generally, the nonlinear algebraic equation can be exactly
solvable through numerical method (e.g., Newton-Raphson
method). Therefore, the AP’s bandwidth (B)canbemade
perfectly obtainable by using the (5).
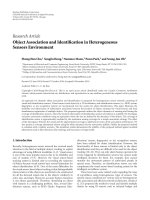
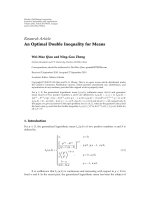
Figures 4(a)–4(f) are plots of B by using (5)asafunction
of R
busy
in [0, 1] for the L = 500 and 1000 Bytes. Each
analysis is computed by MATLAB programming when n is
1, 5, and 10, and CR is 1, 2, 5.5, and 11 Mbps. These results
show that, for n
= 1, the B has been increasing steadily as
the R
busy
increases, regardless of the L and the CR. On the
other hand, for n
= 5 and 10, the B has shown a linear
increase until it reaches a local maximum, which denotes a
saturated throughput, and decreases considerably as the R
busy
increases.
5.2. Achievable Throughput Prediction. As we have seen
in Section 5.1, STAs can estimate the bandwidth capacity
currently loaded on the target AP by utilizing the TFC.
However, the AP’s bandwidth capacity does not indicate
the throughput which is achievable after the STAs perform
handoff to and associate with the AP. Therefore, we present
how to predict the achievable throughput of APs based on
the TFC we are addressing.
By using (4)and(5), we newly define B(n)andR
n
busy
as
the current bandwidth loaded on an nAP and its busy ratio,
respectively, when the nAP has n active STAs. Then per-STA
bandwidth in the nAP is given by B
n
= B(n)/n as a function
of R
n
busy
. Suppose that the number of active STA may increase
to n + 1 when a new STA performs handoff and continues its
transmission through the nAP. Thus we can expect the per-
STA bandwidth in the nAP with n +1STAsasB
n+1
= B(n +
1)/(n+1). By assuming that every STA transmits (or receives)
its individual traffic in same data rate within the nAP’s range,
S(R
n
busy
) is the busy ratio for the maximum peak of B
n
,where
(d/dR
n
busy
)B
n
= 0. It means that the throughput of the nAP
with n-STA is saturated when R
n
busy
= S(R
n
busy
). Finally, an
STA’s achievable throughput, A, from an nAP (i.e., the nAP
with n +1STAs,butactuallyn STAs are associated with the
nAP) is given by
A
=
⎧
⎪
⎪
⎪
⎪
⎨
⎪
⎪
⎪
⎪
⎩
(
B
n+1
, B
n
]
B
n
≤
B
n+1
,
0,
B
n+1
B
n
>
B
n+1
∧
R
n
busy
≤ S
R
n+1
busy
,
[
0, B
n+1
)
B
n
>
B
n+1
∧
R
n
busy
>S
R
n+1
busy
,
(6)
where
B
n
is the maximum per-STA bandwidth from the
nAP with n-STA when R
n
busy
= S(R
n
busy
). According to R
busy
,
the A has different ranges as follows. For B
n
≤
B
n+1
, the
R
busy
increases when the n becomes n + 1 since individual
bandwidth occupied by each STA is same as B
n+1
. On the
other hand, for B
n
>
B
n+1
, it is hard to estimate R
n+1
busy
by
using the TFC. Thus we choose zero as the lower bound of
the A. When R
n
busy
>S(R
n+1
busy
), the A may be less than B
n+1
because the achievable throughput decreases as the busy ratio
increases, while the A may be less than or equal to
B
n+1
for
R
n
busy
≤ S(R
n+1
busy
). Figure 5 depicts the analysis result for the
achievable throughput prediction when n
= 3.
5.3. Rate Discount of Achievable Throughput. As an STA
moves away from an AP, the signal from the AP reaches
the STA with reduced power so that the lower RSSI is
EURASIP Journal on Wireless Communications and Networking 7
10
−2
10
−1
10
0
10
1
Bandwidth (Mbps)
00.51
R
busy
(a) L = 500 B and n = 1
10
−2
10
−1
10
0
10
1
Bandwidth (Mbps)
00.51
R
busy
(b) L = 500 B and n = 5
10
−2
10
−1
10
0
10
1
Bandwidth (Mbps)
00.51
R
busy
(c) L = 500 B and n = 10
10
−2
10
−1
10
0
10
1
Bandwidth (Mbps)
00.51
R
busy
CR = 1Mbps
CR
= 2Mbps
CR
= 5.5Mbps
CR
= 11Mbps
(d) L = 1000 B and n = 1
10
−2
10
−1
10
0
10
1
Bandwidth (Mbps)
00.51
R
busy
CR = 1Mbps
CR
= 2Mbps
CR
= 5.5Mbps
CR
= 11Mbps
(e) L = 1000 B and n = 5
10
−2
10
−1
10
0
10
1
Bandwidth (Mbps)
00.51
R
busy
CR = 1Mbps
CR
= 2Mbps
CR
= 5.5Mbps
CR
= 11Mbps
(f) L = 1000 B and n = 10
Figure 4: Numerical analysis results of bandwidth estimation.
measured at the STA. Even if an AP transmits a certain rate
of data frames to an STA, the STA is likely to miss several
frames because of frame loss or bit error occurrence in a
poor wireless link condition. Typically, the lower RSSI is
measured, and the STA suffers from the higher Bit Error Rate
(BER), causing the degradation of the achievable throughput
obtained from the AP. Therefore, the achievable throughput
should be discounted according to the BER, and we call
it rate discount. However, to the best of our knowledge,
there exists no method to obtain the BER directly from the
802.11 NIC [17]. We thus present three alternative methods
to obtain the discounted rate without the basis of the BER
measurement.
5.3.1. Frame Retransmission versus RSSI. In 802.11, data
frame loss or error initiates retransmission of the frame
to provide reliable communications. As RSSI between STA
and AP decreases, the number of frame retransmission
may increase. Figure 6 shows the experiment result of
frame retransmission ratio (ReTX) for CR in 1, 5.5, and
11 Mbps and average RSSI with respect to the distance
between an STA and an 802.11b AP, from 10 m to 70m at
intervals of 7 meters. We generate 100 Kbps downlink traffic
with 500 B length UDP datagram. The ReTX is calculated
as # of retransmitted frame/# of received frame where the
retransmitted frame is distinguished by Retry bit in 802.11
header. The result shows that the frame retransmission
rarely occurs until 60 m (CR
= 1), 50 m (CR = 5.5),
and 40 m (CR
= 11). After that, the frame retransmission
ratio significantly increases, while the average RSSI gradually
decreases as the distance increases. It means that we cannot
determine the RSSI where the retransmission begins to
increase regardless of the AP’s channel rate. Even if the
number of retransmitted frame is a good decision criterion
for WLAN handoff [18], it is not applicable to obtain the
discounted rate in our handoff mechanism since the STA
cannot measure the number of frame retransmission without
associating with the AP.
8 EURASIP Journal on Wireless Communications and Networking
0
0.2
0.4
0.6
0.8
1
1.2
1.4
1.6
Bandwidth (Mbps)
00.10.20.30.40.50.60.70.80.91
Channel busy ratio (R
busy
)
B
n
B
n+1
D(B
n+1
)
S(R
n+1
busy
)
B
n+1
D(
B
n+1
)
B
n
≤
B
n+1
B
n
>
B
n+1
R
n
busy
≤ S(R
n+1
busy
)
R
n
busy
>S(R
n+1
busy
)
(B
n+1
, B
n
]
(D(B
n+1
), B
n
]
[0, B
n+1
)
[0, D(B
n+1
))
[0,
B
n+1
]
[0, D(
B
n+1
)]
Figure 5: Numerical analysis of achievable throughput estimation
/w and /wo rate discount for n
= 3 and FER = 0.1.
−90
−80
−70
−60
−50
−40
Average RSSI (dBm)
10 20 30 40 50 60 70
Distance between STA and AP (m)
Average RSSI
ReTX (CR
= 1M)
ReTX (CR
= 5.5M)
ReTX (CR
= 11M)
0
0.2
0.4
0.6
0.8
1
Frame retransmission ratio
Figure 6: RSSI and frame retransmission ratio.
5.3.2. Throughput versus RSSI. When an AP transmits data
frames to an STA at a constant rate, the receiving rate at the
STA should be also constant. However, the receiving rate is
determined by FER (regard it as related to BER); it thus varies
according to signal conditions. BER is determined by Signal
to Interference and Noise Ratio (SINR) where the signal is
denoted by RSSI, but the noise cannot be obtained from the
received signal. Since we are not intended to calculate exact
rate value, the RSSI is still useful to deduce the discounted
rate.
Figure 7 illustrates the experiment result of throughput
and RSSI degradation as the distance between an STA and an
AP increases where the AP is located at the start of an 80 m
corridor whose width and height are 2 and 3 m, respectively.
We plot the STA’s throughput and RSSI for CR
= 1, 2, 5.5,
and 11 Mbps for 802.11b on channel 13 and CR
= 6, 12, and
24 Mbps for 802.11a on channel 44 as the STA moves away
from the AP and toward the end of the corridor at intervals
of 2 meters until it reaches 80 m. During each experiment, a
PC is directly connected to the AP in an Ethernet link and
0
2
4
6
8
10
Throughput (Kbps)
−95
−85
−75
−65
−55
−45
Average RSSI (dBm)
0 1020304050607080
Distance (m)
1M
2M
5.5 M
11 M
6M
12 M
24 M
(a) R = 10 K
0
200
400
600
800
1000
Throughput (Kbps)
−95
−85
−75
−65
−55
−45
Average RSSI (dBm)
0 1020304050607080
Distance (m)
RSSI (11b)
RSSI (11a)
(b) R = 1000 K
Figure 7: Throughput and RSSI versus distance.
generates traffic destined to the STA with a fixed rate (R)in
10 and 1000 Kbps. We use 1 KB length UDP datagram for the
traffic generation.
The result shows that, for all R, the STA achieves less
throughput as the distance increases. Furthermore, as R
increases, the discounted rate is also increases regardless of
CR. Remarkably, we can observe that the location where
the throughput is dramatically decreased is similar as 68,
60, 44, and 28 m for CR
= 1, 2, 5.5, and 11 Mbps
(802.11b), and 70 m for CR
= 6, 12, and 24 Mbps (802.11a).
From these results, we believe that the discounted rate
strongly depends on the RSSI and CR. Therefore, when the
predicted achievable throughput of different APs is same, the
comparison of the APs’ RSSI is a useful metric to determine
abetterAP.
5.3.3. FER Measurement with Probe Frame. Usually the
number of errors in a sequence of bits is modeled by
a binomial distribution; thus FER can be expressed as
FER
= 1 − (1 −BER)
L
DATA
+L
ACK
where L
DATA
is a DATA
frame length [19]. Noting that the STA cannot send DATA
frame to the not-yet-associated AP, we measure the FER
by sending/receiving Probe Request/Response management
frames instead of DATA/ACK frames. Since 802.11’s
contention mechanism for both management and DATA
frames is same before being sent, the FER measurement
with probe frames is acceptable. Let L
P
denote the length
of a pair of Probe Request and Response frame. (The
IEEE 802.11 standard specifies that the Probe Request
frame is broadcasted, but for the FER measurement, we
EURASIP Journal on Wireless Communications and Networking 9
cAP
10.1.2.100
STA 10.1.2.1
s5
10.1.1.5
10.1.1.1
s1
10.1.1.2
s2
s4
10.1.1.4
s3
10.1.1.3
nAP
10.1.1.100
Windows PCs (XP)
Gigabit Ethernet
AP 802.11b
channel #1
Windows laptop
(Vista) 802.11b NIC
Windows laptops
(XP) 802.11b NIC
AP 802.11b
channel #11
Wireless
network
monitor
(NetMon)
10.1.1.10
n1
10.1.2.10
n0
10.1.1.20
n2
10.1.1.30
n3
10.1.1.40
n4
10.1.1.50
n5
Figure 8: Experiment environment for throughput measurement with TFC.
used a unicast address as the destination address field
of the Probe Request frame.) Then the probability of
successful transmission for a pair of Probe Request and
Response frames without error is given by (1
− BER)
L
P
,
and it can be easily obtained by regarding the FER as
1
−(# of received Probe Response/#ofsentProbeRequest).
In addition, transmission may fail due to collision when
the channel is congested. The probability of collisions
occurred by other active STA can be expressed by
(1
− P
s
− P
i
)
n−1
= (P
c
)
n−1
as introduced in [20]to
increase the bandwidth accuracy. Hence, the rate discounted
per-STA bandwidth achievable from the nAP with n-STA,
D(B
n
), is given by
D
(
B
n
)
= B
n
×
(
P
c
)
n−1
×
(
1
−BER
)
L
P
. (7)
As an example, in Figure 5, we plot the range of A with
rate discount by applying (7)forFER
= 0.1 (black-solid
error bar) when n
= 3. Obviously, the range of A with rate
discount differs from that of A without rate discount (gray-
dashed error bar). The lower bound for B
n
≤
B
n+1
and
the upper bound for (B
n
>
B
n+1
) ∧ (R
n
busy
>S(R
n+1
busy
)) are
diminished in D(B
n+1
) since the throughput is affected by
BER. On the other hand, for (B
n
>
B
n+1
)∧(R
n
busy
≤ S(R
n+1
busy
)),
the upper bound is reduced to D(
B
n+1
).
6. Experimental Studies
This section provides the experiment of the proposed MAC
layer handoff mechanism and the TFC. Figure 8 shows our
experiment environment as follows. An STA works with a
Windows Vista powered laptop equipping Netgear JWAG511
WLAN NIC and is associated with an 802.11b AP (cAP)
on channel number 1. On the other hand, there exists
a neighbor 802.11b AP (nAP) on channel number 11 which is
orthogonal to that of the cAP. The nAP is a target to measure
the achievable throughput by utilizing the TFC while the STA
is connected via the cAP. The cAP and the nAP is deployed by
using Belkin wireless b/g router and D-Link DWL-8200AP,
respectively. The only modification is applied at the STA by
installing implemented miniport driver.
In order to generate the cross traffic on the APs, we
use Windows XP powered 6 PCs labeled from n0ton5
and 5 laptops labeled from s1tos5asinFigure 8. While
the n0 is connected directly to the cAP and generates the
traffic destined to the STA, other PCs (n1
∼ n5) are directly
connected to the nAP and generate the traffic destined to the
corresponding laptops (s1
∼ s5). Additionally, we locate a PC
with a tool provided by [21], namely, NetMon, on near by the
nAP. The NetMon is to capture every frame transmitted from
the nAP, thus works independently of others. To simplify, we
assume that every PC generates their traffic with fixed-length
UDP datagram, and the direction of the traffic is downlink.
For the experiment of the traffic in uplink direction, we could
obtain similar results as the downlink traffic experiment.
6.1. Impact of Capture Period (CP). In regards to the
throughput measurement, finding an optimal CP plays an
important role to make the TFC procedure do not disrupt
the active session via the associated cAP. We thus do an
experiment to find the optimal CP which minimizes the
data loss of the current active session. The n0 sends the
traffic of 1000-Byte length UDP datagram generated with
20 milliseconds interval (
= 400 Kbps), and we check the
sequence number of each datagram. (We implement a new
traffic generation application that the sequence number is
appeared in the data part of each UDP datagram.) As a result,
we observe that no data loss is examined when CP
≤ 200
10 EURASIP Journal on Wireless Communications and Networking
0
1000
2000
3000
4000
5000
Bandwidth (Kbps)
500 B 1000 B
Channel rate
= 1M
500 B 1000 B
Channel rate = 2M
500 B 1000 B
Channel rate = 5.5 M
500 B 1000B
Channel rate = 11 M
(a) CP = 200
0
1000
2000
3000
4000
5000
Bandwidth (Kbps)
500 B 1000B
Channel rate
= 1M
500 B 1000 B
Channel rate = 2M
500 B 1000 B
Channel rate = 5.5 M
500 B 1000 B
Channel rate = 11 M
R (50K)
R (500K)
R (2500K)
R (5000K)
TFC
Avg-TFC
TX
nAP
(b) CP = 300
Figure 9: Case 1: comparison between estimated bandwidth with the TFC and AP’s actual transmission rate (TX
nAP
)forn = 5.
milliseconds, while for CP = 300 milliseconds, the result
averaged over 10 experiments shows that 1.8 datagrams are
lost during a TFC procedure. However, if the CP
≥ 400
milliseconds, the number of datagram loss is significantly
increased in average 3.4 and 5.7 for CP
= 400 and 500
milliseconds, respectively.
We confirmed that the datagram is lost since the STA
cannot receive frames sent from the cAP while the STA is
in the promiscuous mode for the TFC procedure. When the
cAP does not receive ACK for a sent frame, it sends the frame
again until exceeding the retransmission limit in RetryLimit
where the RetryLimit is usually set by 7, but it is dependent
to the NIC manufacturer. After the number of retransmission
exceeds the RetryLimit, the cAP drops the frame and tries to
send the other frame in its buffer. In the rest of experiments,
we thus use two CPs of 200 and 300 milliseconds to improve
the reliability of data transmissions via the cAP during the
TFC proceeds.
It is worth noting that the selection of CP duration is
a huge problem since the heuristic value of the CP may
not fit other network setups. We thus address a method to
avoid the service degradation of data connection through
the associated cAP. Whenever an STA performs a TFC to the
other channel for nAPs, it employs power saving technique as
follows.: Before the STA switches its channel to a target AP’s
channel, it sends a null frame to the cAP, which is to enter
into the power saving mode. During a CP for the TFC, the
cAP buffers data destined to the STA and informs it via TIM
at beacon frame by next listen interval. As soon as the STA
switches back to the original channel on the cAP, it sends PS-
POLL frame to the cAP and then receives the buffered data
from the cAP.
6.2. Evaluation. We evaluate the performance of the TFC
on (1) reliable and (2) accurate estimation of AP’s band-
width capacity by studying experiments in various traffic
environments. Also, we show that the prediction of the
achievable throughput, which is the basis of the estimated
bandwidth capacity, well matches the actual throughput
from the AP even applying (3) rate discount based on the
FER measurement.
Each of these evaluation cases are performed under
individual experiment scenario. During each experiment
scenario, we apply different n’s; thus, according to the n, n
PCs send UDP datagram in L
= 500 and 1000 B destined
to the corresponding n laptops with the rate in 10, 100, 500,
and 1000 Kbps to generate cross traffic on the nAP. Also, we
vary the nAP’s CR in 1, 2, 5.5, and 11 Mbps and the CP
for the TFC in 200 and 300 milliseconds for various traffic
environments.
6.2.1. Case 1—Reliable Bandwidth Estimation. Figures 9(a)
and 9(b) are plots of the estimated bandwidth loaded on the
nAP (TFC) as a function of cross traffic when five other STAs
EURASIP Journal on Wireless Communications and Networking 11
0
0.5
1
1.5
2
2.5
3
Bandwidth (Mbps)
10 100 500 1000
Tr affic generation rate (R)(Kbps)
(a) CP = 200, L = 500
0
0.5
1
1.5
2
2.5
3
Bandwidth (Mbps)
10 100 500 1000
Tr affic generation rate (R)(Kbps)
(b) CP = 200, L = 1000
0
0.5
1
1.5
2
2.5
3
Bandwidth (Mbps)
10 100 500 1000
Tr affic generation rate (R)(Kbps)
R (30K)
R (300K)
R (1500K)
R (3000K)
CR
= 1M
CR
= 2M
CR
= 5.5M
CR
= 11M
(c) CP = 300, L = 500
0
0.5
1
1.5
2
2.5
3
Bandwidth (Mbps)
10 100 500 1000
Tr affic generation rate (R)(Kbps)
R (30K)
R (300K)
R (1500K)
R (3000K)
CR
= 1M
CR
= 2M
CR
= 5.5M
CR
= 11M
(d) CP = 300, L = 1000
Figure 10: Case 2: estimated bandwidth in average with the TFC for n = 3.
receive downlink traffic from the nAP (n = 5) and CR = 1,
2, 5.5, and 11 Mbps for CP
= 200 and 300 milliseconds,
respectively. We generate 10, 100, 500, and 1000 Kbps of cross
trafficfromeachoffivePCs(n1
∼ n5). For the nAP, this
cross traffic is denoted as reference bandwidth in R(50 K),
R(500 K), R(2500 K), and R(5000 K), respectively. For each
traffic scenario, the nAP’s bandwidth is estimated by utilizing
the TFC at the STA. The estimated bandwidth averaged over
5 TFC trials (Avg-TFC) with standard error is compared
with the reference bandwidth. We also compare the esti-
mated bandwidth (TFC) with the nAP’s actual transmission
rate (TX
nAP
) obtained by an independent NetMon (see
Figure 8).
As a result, we can obtain that the reference bandwidth
differs from the TX
nAP
. When CR is lower than the reference
bandwidth (i.e., R(2500 K) and R(5000 K) for CR
≤ 2 Mbps),
the actual bandwidth on the nAP is lower than the reference
bandwidth since the nAP cannot transmit all trafficflowed
from PCs (n1
∼ n5) to laptops (s1 ∼ s5) with the
configured channel rate. It means that comparing the
estimated bandwidth with the TX
nAP
is more reliable. Most
of the result indicates that the estimated bandwidth with the
TFC is well matched to the TX
nAP
rather than the reference
bandwidth. Moreover, the standard error of 5 TFC trials is
distributed within the reliable range of the actual bandwidth
loaded on the nAP.
12 EURASIP Journal on Wireless Communications and Networking
0
0.1
0.2
0.3
0.4
0.5
0.6
0.7
0.8
0.9
Achievable throughput (Mbps)
0.25 0.50.75 0.98
Channel busy ratio (R
busy
)
Actual B
n+1
D(B
n+1
)
Range A
Mean A
(a) FER = 0.1
0
0.1
0.2
0.3
0.4
0.5
0.6
0.7
0.8
0.9
Achievable throughput (Mbps)
0.25 0.50.75 0.98
Channel busy ratio (R
busy
)
Actual B
n+1
D(B
n+1
)
Range A
Mean A
(b) FER = 0.25
0
0.1
0.2
0.3
0.4
0.5
0.6
0.7
0.8
0.9
Achievable throughput (Mbps)
0.25 0.50.75 0.98
Channel busy ratio (R
busy
)
Actual B
n+1
D(B
n+1
)
Range A
Mean A
(c) FER = 0.5
Figure 11: Case 3: achievable throughput estimation for n = 3&CR= 5.5Mbps.
Remarkably, in the case of R(500 K) for CR = 11 Mbps
and L
= 500 B, the TFC measurement underestimates
the bandwidth on the nAP. Because the nAP receives five
types 1Mbps traffic with short L from PCs (n1
∼ n5), it
heavily increases the nAP’s transmission rate, and the STA
cannot capture all the frame transmitted from the nAP. This
problem can be solved if the STA uses large enough CP for
utilizing the TFC procedure, but the large CP may degrade
the service through the current associated cAP as mentioned
in Section 6.1.
As an additional observation, the TX
nAP
is higher than
the reference bandwidth when the CR
= 11 Mbps and L =
1000 B for both CP = 200 and 300 milliseconds. This is
caused by the nAP’s retransmission of data frames when the
nAP does not receive corresponding ACK frame before the
ACK
TIMEOUT expires.
6.2.2. Case 2—Accuracy of Bandwidth Estimation. Figures
10(a), 10(b), 10(c),and10(d) are plots of the estimated
bandwidth in average of 5 TFC trials as a function of traffic
generation rate (R) when CR
= 1, 2, 5.5, and 11 Mbps for
(CP
= 200, L = 500), (CP = 200, L = 1000), (CP = 300,
L
= 500), and (CP = 300, L = 1000), respectively. In
this experiment, three PCs (n1, n2, and n3) generate UDP
datagram with the R of 10, 100, 500, and 1000 Kbps for cross
traffic on the nAP (n
= 3); thus the reference bandwidth
to be compared with the estimated bandwidth is R(30 K),
R(300 K), R(1500 K), and R(3000 K), respectively. Most of
the result shows that the estimated bandwidth increases as
higher traffic is loaded on the nAP. However, several results
of the estimated bandwidth for R
= 500 Kbps are higher
than thos for R
= 1000 Kbps when CR ≤ 2Mbps and
L
= 500, because the CR is lower than the traffic generation
rate. The other reason why these results happen is that the
UDP datagram length of the cross trafficaffects the nAP’s
processing overhead where the shorter L makes data frames
on the nAP be generated with the more frequent interval.
Thus the accurate bandwidth estimation should take into
account the current channel rate set on both the nAP and
the STA. The rest of the results show that the bandwidth
estimation with the TFC matches in higher accuracy when
the CR is greater than the reference bandwidth.
6.2.3. Case 3—Achievable Throughput Prediction with Rate
Discount. In Cases 1 and 2, we evaluated how well measured
actual nAP’s bandwidth capacity by utilizing the TFC. In
Case 3, we investigate the prediction of the achievable
throughput based on the nAP’s bandwidth estimated by
the TFC. Figures 11(a), 11(b),and11(c) are plots of the
achievable throughput predicted by (6) as a function of
R
busy
for FER = 0.1, 0.25, and 0.5, respectively, when the
CR
= 5.5 Mbps on the nAP. In this experiment, we perform
the TFC for n
= 3 on the nAP; thus it is to predict the
achievable throughput (range A) from the nAP for n
= 4
which is expected after the STA associates with the nAP. To
simplify the experiment, we generate cross trafficinfixed
length (L
= 1000 B) and adjust R
busy
in 0.25, 0.5, 0.75, and
0.98 by varying the individual traffic generation rate in PCs.
We first measure the nAP’s bandwidth capacity (B
n
) with the
TFC when three PCs (n1
∼ n3) generate traffic destined to
EURASIP Journal on Wireless Communications and Networking 13
(50,50)
(50,150)
(0,0) (300,0)
(300,300)(0,300)
(150,50)
(250,50)
(150,150)
(250,150)
(50,250)
(150,250)
(250,250)
Simulation region
802.11a AP (54 Mbps)
802.11b AP (11 Mbps)
(300 ×300 m
2
)
Figure 12: Simulation environment.
200
400
600
800
Throughput per a STA (Kbps)
50 100 150 200 250 300 350 400 450
Number of STA (N)
SSF
LLF
BBF
Figure 13: Average throughput per an STA.
the corresponding three laptops (s1 ∼ s3). Then we make an
STA associate with the nAP for the nAP in n
= 4andmeasure
the actual throughput (actual B
n+1
) obtained from the nAP
when n0 sends UDP traffic to the STA through the nAP.
For the same R
busy
, the achievable throughput decreases
as FER increases since it is affected by the quality of channel
condition. Remarkably, comparing the rate discounted per-
STA bandwidth obtained by (7)(D(B
n+1
)) with the actual
B
n+1
leads to a similar bound. Also, every actual B
n+1
is
appeared within the range of A. Especially, for R
busy
≤ 0.5, we
can observe that the actual B
n+1
is closely distributed around
the mean A. In contrast, for R
busy
> 0.5, the actual B
n+1
is
also appeared within the range of A, but it is distributed in
much more closer to the upper bound of the A.
Table 2: Simulation parameters.
Parameter Value
Simulation region 300 ×300 m
2
The number of AP 9
AP’s channel rate 11 and 54 Mbps (Fixed)
AP’s transmission range 100 m radius
The number of STA (N)50
∼ 450
Required bandwidth by a STA 500
∼ 1000 Kbps
6.3. Fairness. The proposed handoff mechanism also fairly
balances the traffic loaded on multiple APs in regard to
their bandwidth capacity. With a simple simulation in C
programming, we evaluate the fairness of traffic load dis-
tributed on the APs by comparing our proposed mechanism,
namely Best Bandwidth Fit (BBF), with two conventional
AP selection mechanisms [22], Strongest Signal First (SSF)
and Least Load First (LLF). The SSF and the LLF triggers
STAs to perform handoff to an AP with the strongest signal
strength and the lowest traffic load, respectively. In the BBF,
on the other hand, STAs perform handoff to an AP with the
most bandwidth capacity obtained by TFC so that it takes
into account both the achievable throughput and the signal
strength from the AP.
We use simulation parameters as in Tab le 2 . As shown
in Figure 12, within the simulation region, we deploy 9
APs in the fixed location with different channel rates (five
802.11a and four 802.11b APs) and set all their channels
which do not interfere one another. By setting that the AP’s
propagation range is 100 m, every STA can sense the carrier
from at least one AP up to four overlapped APs. We vary
the number of STAs (N) from 50 to 450 where each STA
locates in random location within the simulation region and
requires constant bandwidth chosen from 500 to 1000 Kbps
(average 750 Kbps). Each simulation is performed 10 times
and obtained the result in average.
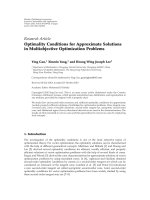
6.3.1. Throughput per an STA. Figure 13 shows the average
achieved throughput per an STA for SSF, LLF, and BBF mech-
anisms as N increases. When N>150, SSF and LLF dramat-
ically decrease the throughput per an STA since they force
the STAs to select an AP according to only the signal strength
and the amount of loaded traffic. On the other hand, BBF
mechanism does not fluctuate the throughput per an STA
since it fairly distributes the bandwidth capacity on the APs.
6.3.2. AP’s Bandwidth Utilizati on. Figure 14 depicts the
average bandwidth utilization on APs as a function of N.
When N>150 which denotes that 802.11b APs are saturated,
STAs in LLF mechanism are likely to select 802.11b APs
since the loaded traffic on the 802.11b APs (
≤11 Mbps) is
less than that on the 802.11a APs (
≤54 Mbps) so that the
utilization remains in about 60%. On the other hand, the
average utilization of APs in SSF and BBF mechanism shows
a linear growth. It means that APs in different PHY types
fully utilize their bandwidth capacity as the number of STA
increases.
14 EURASIP Journal on Wireless Communications and Networking
0
25
50
75
100
AP utilization (%)
50 100 150 200 250 300 350 400 450
Number of STA (N)
SSF
LLF
BBF
Figure 14: Average bandwidth loaded on an AP.
0
0.2
0.4
0.6
0.8
1
Coefficient of variation
50 100 150 200 250 300 350 400 450
Number of STA (N)
SSF
LLF
BBF
Figure 15: CV of AP’s trafficload.
6.3.3. Coefficient of Variation. In order to show the fairness
of traffic distribution on APs, we obtained the coefficient of
variation (CV) in regard to the traffic loaded on the APs.
The CV is calculated by CV
= σ/μ where σ and μ are the
standard deviation and the mean of the loaded trafficforall
APs. Figure 15 is a plot of the CV as a function of the number
of STA. As N increases, the CV of every mechanism is
gradually reduced. The reducing slope of LLF mechanism is
slight while those of SSF and BBF mechanisms are drastically
reduced. After the 802.11b APs are saturated (N>150), the
CV of BBF mechanism is less than that of SSF mechanism. It
is obvious that BBF mechanism can more fairly distribute the
traffic load on densely deployed APs than other mechanisms.
7. Conclusion
In this paper, we proposed a MAC layer handoff mechanism
for IEEE 802.11 WLAN to determine an optimal AP
with the maximum achievable throughput rather than the
highest RSSI. The proposed handoff mechanism performs
Transient Frame Capture (TFC) to estimate the neighbor
AP’s bandwidth capacity and achievable throughput without
service degradation of the active connection through the
current associated AP. Based on the numerical analysis and
experimental studies, we showed that the estimation result
of analytical model reasonably well matches the empirical
one in terms of reliable and accurate bandwidth capacity as
well as rate discounted achievable throughput from neighbor
APs. The proposed handoff mechanism also achieves a better
fairness by balancing the traffic load on the densely deployed
APs. Moreover, our mechanism requires no changes in AP
protocols; thus it is easily applicable to any IEEE 802.11
WLAN NIC-based STA.
As a future work, we will study a further model for
throughput estimation taking into account the dynamic
length of L which was assumed as a fixed length in this paper.
In addition, we assumed that APs use fixed channel rate, but
the APs are often set with automatic fallback algorithm to
dynamically adjust the rate against the distance between STAs
and the APs. Thus the heterogeneity of channel rate in APs
should be considered to design the estimation model.
Acknowledgments
This work was in part supported by a grant from Microsoft
Research Asia. This work was also partially supported by the
Korea Science and Engineering Foundation (KOSEF) grant
funded by the Korea government (MEST) (2009-0076476).
References
[1] “IEEE Std 802.11. Wireless LAN Medium Access Control
(MAC) and Physical Layer (PHY) Specifications,” 1997.
[2] V. Mhatre and K. Papagiannaki, “Using smart triggers for
improved user performance in 802.11 wireless networks,”
in Proceedings of the 4th International Conference on Mobile
Systems, Applications and Services (MobiSys ’06), pp. 246–259,
Uppsala, Sweden, June 2006.
[3] I. Ramani and S. Savage, “SyncScan: practical fast handoff
for 802.11 infrastructure networks,” in Proceedings of the
24th Annual Joint Conference of the IEEE Computer and
Communications Societies (INFOCOM ’05), vol. 1, pp. 675–
684, Miami, Fla, USA, March 2005.
[4] H. Wu, K. Tan, Y. Zhang, and Q. Zhang, “Proactive scan:
fast handoff with smart triggers for 802.11 wireless LAN,”
in Proceedings of the 26th IEEE International Conference on
Computer Communications (INFOCOM ’07), pp. 749–757,
Anchorage, Alaska, USA, May 2007.
[5] V. Brik, A. Mishra, and S. Banerjee, “Eliminating handoff
latencies in 802.11 WLANs using multiple radios: applica-
tions, experience, and evaluation,” in Proceedings of the ACM
SIGCOMM Internet Measurement Conference (IMC ’05),pp.
299–304, 2005.
[6] C. Dovrolis, P. Ramanathan, and D. Moore, “Packet-
dispersion techniques and a capacity-estimation methodol-
ogy,” IEEE/ACM Transactions on Networking,vol.12,no.6,pp.
963–977, 2004.
[7] K. Lakshminarayanan, V. N. Padmanabhan, and J. Padhye,
“Bandwidth estimation in broadband access networks,” in
Proceedings of the ACM SIGCOMM Internet Measurement
Conference (IMC ’04), pp. 314–321, 2004.
[8] S. Vasudevan, K. Papagiannaki, C. Diot, J. Kurose, and D.
Towsley, “Facilitating access point selection in IEEE 802.11
EURASIP Journal on Wireless Communications and Networking 15
wireless networks,” in Proceedings of the ACM SIGCOMM
Internet Measurement Conference (IMC ’05), p. 26, 2005.
[9] M. Li, M. Claypool, and R. Kinicki, “Packet dispersion in
IEEE 802.11 wireless networks,” in Proceedings of Conference
on Local Computer Networks (LCN ’06), pp. 721–729, 2006.
[10] A. Bazzi, M. Diolaiti, C. Gambetti, and G. Pasolini, “WLAN
call admission control strategies for voice traffic over inte-
grated 3G/WLAN networks,” in Proceedings of the 3rd
IEEE Consumer Communications and Networking Conference
(CCNC ’06), vol. 2, pp. 1234–1238, 2006.
[11] D. Pong and T. Moors, “Call admission control for IEEE
802.11 contention access mechanism,” in Proceedings of IEEE
Global Telecommunications Conference (GLOBECOM ’03), vol.
1, pp. 174–178, San Francisco, Calif, USA, December 2003.
[12] Z. Kong, D. H. K. Tsang, and B. Bensaou, “Measurement
assisted model-based call admission control for IEEE 802.11e
WLAN contention-based channel access,” in Proceedings of the
13th IEEE Workshop on Local and Metropolitan Area Networks
(LANMAN ’04), pp. 55–60, April 2004.
[13] S. Kandula, K. C J. Lin, T. Badirkhanli, and D. Katabi,
“FatVAP: aggregating AP backhaul capacity to maximize
throughput,” in Proceedings of the 5th USENIX Symposium on
Networked Systems Design and Implementation (NSDI ’08),pp.
89–104, San Francisco, Calif, USA, April 2008.
[14] “IEEE Std 802.11e. Wireless LAN Medium Access Control
(MAC) and Physical Layer (PHY) Specifications, Amendment
8: Medium Access Control (MAC) Quality of Service Enhance-
ments,” 2005.
[15] “IEEE Std 802.11k. Wireless LAN Medium Access Control
(MAC) and Physical Layer (PHY) Specifications, Amendment
1: Radio Resource Measurement of Wireless LANs,” 2008.
[16] S. Mangold and L. Berlemann, “IEEE 802.11k: Improving
confidence in radio resource measurements,” in Proceedings of
the 16th IEEE International Symposium on Personal, Indoor and
Mobile Radio Communications (PIMRC ’05), vol. 2, pp. 1009–
1013, Berlin, Germany, September 2005.
[17] A. F. Conceicao, J. Li, D. A. Florencio, and F. Kon, “Is
IEEE 802.11 ready for VoIP?” in Proceedings of the 8th IEEE
Workshop on Multimedia Signal Processing (MMSP ’06),pp.
108–113, October 2007.
[18] K. Tsukamoto, T. Yamaguchi, S. Kashihara, and Y. Oie,
“Experimental evaluation of decision criteria for WLAN
handover: signal strength and frame retransmission,” IEICE
Transactions on Communications, vol. E90-B, no. 12, pp. 3579–
3590, 2007.
[19] Y. Y. Kim and S Q. Li, “Modeling multipath fading channel
dynamics for packet data performance analysis,” Wireless
Networks, vol. 6, no. 6, pp. 481–492, 2000.
[20]D J.Deng,C H.Ke,H H.Chen,andY M.Huang,“Con-
tention window optimization for IEEE 802.11 DCF access
control,” IEEE Transactions on Wireless Communications, vol.
7, no. 12, pp. 5129–5135, 2008.
[21] Microsoft, “Network Monitor 3.1,” />netmon.
[22] Y. Bejerano, S J. Han, and L. Li, “Fairness and load balancing
in wireless LANs using association control,” IEEE/ACM Trans-
actions on Networking, vol. 15, no. 3, pp. 560–573, 2007.