Waste Water Treatment and Reutilization 2011 Part 5 pot
Bạn đang xem bản rút gọn của tài liệu. Xem và tải ngay bản đầy đủ của tài liệu tại đây (1.17 MB, 27 trang )
Anaerobic Ammonium Oxidation in Waste Water - An Isotope Hydrological Perspective
97
along the flowpath is unlikely because it requires unsaturated conditions and because
of the neutral pH of the water (negligible un-ionized NH
3
).
2. NO
3
-
concentrations decline along the flowpath and into the municipal aquifer. This
precludes nitrification for the observed loss of NH
4
+
for which an increase in NO
3
-
concentrations should be observed. The measured redox conditions are too low to
support aerobic nitrification of NH
4
+
.
3. δ
15
N
NO
3
is consistently 5‰ to 10‰ enriched over that of δ
15
N
NH
4
for water carrying both
species, demonstrating that NH
4
+
loss is not by nitrification. Oxidation of NH
4
+
to NO
3
-
would produce NO
3
-
with depleted δ
15
N values.
4. Strong correlations between δ
15
N
NH
4
and δ
15
N
NO
3
demonstrate reactive loss of both
species, consistent with anammox reaction. Enrichment of δ
15
N
NO
3
correlates with
enrichments in δ
15
N
NH
4
, further supporting reactive loss of NO
3
-
.
5. N
2
overpressuring above atmospheric equilibrium is observed to increase with
increasing δ
15
N
NH
4
values along the flowpath from the FC source area. Increased N
2
in
conjunction with enrichment in δ
15
N
NH
4
can occur only through anaerobic oxidation of
NH
4
+
to N
2
by the anammox reaction.
4.2 Tracer experiments
Tracer experiments with
15
N-labeled nitrogen species are commonly used for elucidating
nitrogen fate in both sediments and groundwater environments. Consumption of
15
NH
4
+
and concomitant production of
15
N-labeled N
2
provided the first clear experimental
evidence for anammox activity in a fluidized bed reactor (van de Graaf et al., 1995). So far,
few labelling experiments have provided evidence of anammox in anoxic basin and in the
suboxic zone of sea and lakes (Dalsgaard et al., 2003; Kuypers et al., 2003; Schubert et al.,
2006; Hamersley et al., 2009), but there is no analogue application in groundwater systems
yet.
15
N-labelling also provides a very sensitive technique for the determination of anammox
rates. And a simultaneous determination of anammox and denitrification, gives in sights to
the relative importance of the two N removal pathways (Thamdrup & Dalsgaard, 2002;
Risgaard- Peterson et al., 2003). In addition, potential isotopic fractionation associated with
anammox bacteria activity also indicates the presence of anammox reaction. From the
simultaneous attenuation of NH
4
+
and NO
3
-
, and a progress enrichment of δ
15
N-NH
4
+
and
δ
15
N-NO
3
-
, Clark et al., (2008) suggested that anammox may play a role in ground water. As
a follow-up study, a series of
15
N labelling incubation experiments have been established to
investigate anammox activity and reaction rates at several ground water sites.
4.2.1
15
N labelling experiments
For
15
N-labelling experiments, the method was slightly modified from the previous
publication (Dalsgaard et al., 2003). Ground water or sediment and groundwater in an
industrial contaminated site Elmira and a turkey manure polluted site Zorra were collected
directly to 12-mL exetainers (Labco, UK). In terms of the mixture of sediment and ground
water incubation, around 4.5mL sediment and 7.5mL of groundwater were collected. In
order to minimize oxygenation, exetainer was submerged into a big container completely
filled with ground water and neither headspace nor bubbles in the vial. From each site,
triplicates were sampled for
15
N labelling experiments.
15
N labelling experiments were
conducted immediately after return to the laboratory (less than 2 hours). In brief, 3mL of
water was withdrawn by a syringe to make a headspace for helium (He) flushing. Each
Waste Water - Treatment and Reutilization
98
exetainer was flushed with He for at least 15min to remove background N
2
and dissolved O
2
and N
2
.
15
N enriched compounds were added with syringe to a final concentration of
100µmol in 10ml of sample as
15
NH
4
Cl and Na
15
NO
3
(all >99%
15
N, Sigma-Aldrich). Even
though the final concentration of enriched
15
N was variable in previous studies, ranging
from 40 µmol to 10mmol L
-1
(Dalsgaard et al, 2003; Thamdrup et al., 2006), the present
addition was in higher range because that the concentration of
14
N species in study samples
were very high and sometime can reach to 20mmol L
-1
. An additional trial was carried out
without any tracer addition as control to confirm that the whole incubation system functions
well.
15
N-labelling experiments were incubated in a dark incubation chamber at 15°C,
which is very close to the in situ temperature.
14
N
15
N:
14
N
14
N and
15
N
15
N:
14
N
14
N were
determined by gas chromatography-isotope ratio mass spectrometry and expressed as
δ
14
N
15
N values (
14 15
14 15 14 14
14 15 14 14
()sample
NN [ 1]1000
()standard
NN:NN
NN:NN
δ
=−×
; air was used as the standard)
(GG Hatch isotope laboratory, University of Ottawa). In terms of anammox contribution to
total N
2
production, assuming that the
15
NH
4
+
pool turns over at the same rate as the
ambient
14
NH
4
+
pool, the total anammox N
2
production can be calculated from the
production of
29
N
2
and the proportionate
15
N labelling in the whole NH
4
+
pool (Thamdrup
& Dalsgaard, 2002; Thamdrup et al., 2006). The rates of anammox were extrapolated from
linear regression of
14
N
15
N as a function of time in the incubation with
15
NH
4
+
and the rates
of denitrification were determined from the slope of linear regression of
15
N
15
N over time in
the incubation with
15
NO
3
-
.
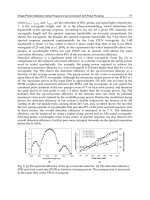
4.2.2 Results and discussion
At both of sampling sites except a pristine background well (Pu86 having not been impacted
by NH
4
+
from the compost plume), the formation of
14
N1
5
N was observed in the incubation
trials with
15
NH
4
+
(Fig 7 a and c). However, the formation of
14
N
15
N was very slow, and the
concentration was lower than the detection limit after 72 hours incubation and the
enrichment signal δ
15
N/
14
N was only 22.1 ± 4.2‰. The incubation experiments were
extended to 3 months. The highest δ
15
N/
14
N increased to 14,278.03‰ at the end of
incubation. At Elmira site,
14
N
15
N accumulated linearly and stably with time without a lag
phase, which indicates that anammox was the active process and no intermediates were
involved in the reaction (Galán et al., 2009). Furthermore, the production of only
14
N
15
N
rather
15
N
15
N was a clear evidence for the stoichiometry of N
2
production through
anammox (van de Graaf et al., 1995; Jetten et al., 2001). At Zorra site,
the formation of
14
N
15
N
reached the maximum at 1500hours incubation and started to decline. This is maybe due to
the lack of another N donor NO
3
-
which concentration was low at Zorra site. In control
incubations without added tracer there was no production of
15
N-enriched N
2
, indicating the
eligibility of the incubation system. At Elmira sites, the average
14
N
15
N formation rate was
0.014±0.003µmol L
-1
h
-1
, and the rate at Zorra site was 0.02±0.0021 µmol L
-1
h
-1
. The rate of
14
N
15
N production essentially corresponded to the anammox rate (van de Graaf et al., 1995;
Thamdrup & Dalsgaard 2002; Dalsgaard et al., 2003). So, according to the equation from
Thamdrup & Dalsgaard (2002), the calculated anammox reaction was 0.04±0.008 µmol L
-1
h
-1
at Elmira and 0.021±0.0022 µmol L
-1
h
-1
at Zorra. Compared to Dalsgaard et al., (2003)
reported reaction rates 42 to 61mmol N m
-2
d
-1
in anoxic water column of Golfo Dulce, the
reaction rate in ground water was much lower. However, many lower rates have been
found in the oxygen-deficient water such as in eastern South Pacific (≤0.7nmol L
-1
h
-1
;
Anaerobic Ammonium Oxidation in Waste Water - An Isotope Hydrological Perspective
99
Thamdrup et al., 2006) and in the Black Sea (~0.007µmol d
-1
; Kuypers et al., 2003). Our
results were very close the reported reaction rates in freshwater lakes, ranging from 6 to 504
nmol N
2
L
-1
d
-1
(Hamersley et al., 2009).
The pronounced accumulation of
15
N
15
N in the incubation of
15
NO
3
-
indicated that active
and strong denitrification process (Fig 7b and d). The production of
15
N
15
N was the major
product at Zorra sites with an order magnitude higher than the mass of
14
N
15
N. In the
incubation of
15
NH
4
+
, using the calculated anammox produced N
2
as a numerator and the
total produced N
2
(
14
N
14
N+
14
N
15
N+ insignificant
15
N
15
N) as a denominator, at Elmira sites
32.7% of N
2
gas was attributed to anammox; 21.4% for Zorra sites.
15
NO
3
-
tracer labelling
experiment showed that anammox accounted for 44.79% of N
2
production at Elmira sites
and 29.03% at Zorra sites. The two techniques demonstrated a fair agreement at both of
study sites. To date, the reported relative contribution of anammox to N
2
production was
variable with a wild range from below detection to 67% (Thamdrup & Dalsgaard 2002;
Dalsgaard et al., 2005). The contribution of anammox activity to N cycle was fairly
corresponding to the percentage of anammox bacteria biomass (bacteria biomass data will
be shown following). In conclusion,
15
N labelling experiments directly and clearly proved
that the presence and activity of anammox in ground water.
Fig. 7. Formation of
14
N
15
N (open square) and
15
N
15
N (solid square) in 3mL of headspace of
incubation vials with samples from Elmira site(a and b) and Zorra site(c and d) after
addition of
15
NH
4
+
and
15
NO
3
-
.
Waste Water - Treatment and Reutilization
100
4.3 Microbiological analyses
Molecular methods have been extensively utilized to identify the presence of anammox
bacteria in environmental and wastewater samples. Fluorescence in situ hybridization
(FISH) targeting the 16S rRNA gene has been used extensively, and described in detail by
Schmid et al. (2005). Anammox bacteria have also been identified using PCR, using a variety
of primers, often based on FISH probes, targeting the group as a whole or specific members
(Schmid et al. 2005; Penton & Tiedje, 2006). Quantitative PCR (q-PCR) has been used for
direct quantification of all known anammox-like bacteria in water columns (Hamersley et al.
2009), in wastewater enrichment cultures (Tsushima et al., 2007) and in terrestrial
ecosystems (Humbert et al., 2010).
4.3.1 Microbiological methods
For the present study, between 240 mL and 1 L of groundwater was collected and filtered via
piezometer for DNA extraction; filtrate was collected on a 0.22μm filter surface (Millipore).
Filters were stored at –70
o
C until DNA extraction. Nucleic acids were extracted from the filter
surface using a phenol chloroform extraction technique, described previously by Neufeld et
al., (2007). General bacterial 16S rRNA gene primers for denaturing gradient gel
electrophoresis (DGGE; GC-341f and 518r; Muyzer et al., 1993) and anammox-specific 16S
rRNA gene primers (An7f and An1388r; Penton et al
., 2006) were used for PCR along with a
series of reaction conditions (Moore et al, submitted). PCR products were cloned using a
TOPO-TA cloning kit (Invitrogen) according to the manufacturer’s instructions. DNA
sequencing was performed at the Biochemistry DNA sequencing facility at the University of
Washington (ABI 3700 sequencer), at The Center for Applied Genomics in Toronto (ABI
3730XL sequencer), and at the sequencing facility at the University of Waterloo (Applied
Biosystems 3130xl Genetic Analyzer). DNA chromatograms were manually edited for base
mis-calls and were visually inspected and trimmed to ensure only quality reads were
included. Redundant sequences were removed using Jalview. Alignment and building
phylogenetic trees were done with MEGA4.0 (Tamura et al., 2007). Sequences were aligned
with known anammox reference sequences obtained from Genbank (DQ459989, AM285341,
AF375994, DQ317601, DQ301513, AF375995, AF254882, AY257181, and AY254883) and a
Planctomycete outgroup (EU703486). Phylogenetic trees were built using the neighbor joining
method and the maximum composite likelihood model. Total bacterial community pie charts
were constructed using phylum assignments provided by the Ribosomal Database Project and
NCBI Blast. Anammox specific qPCR used An7f and An1388r (Penton et al., 2006) and general
bacterial qPCR used 341f and 518r (Muyzer et al., 1993).
Fluorescently labelled oligonucleotide probes: EUB 338 (specific for all bacteria cells),
Amx368 (specific for all anammox species) and Kst- 0157-a-A-18 (specific for an anammox
species “
Kuenenia Stuttgartiensis”) all labelled with different fluorescent color were used to
ground water and sediment samples in order to determine the abundance of the specific
anammox bacteria cells in samples. Several protocols have been used and a suitable protocol
for this type of environmental samples was modified. In order to give a quantitative point
view of total cell versus anammox, cell counting was established. Total cell counting was
carried by DAPI (4',6-diamidino-2-phenylindole) staining, which is a special fluorescent
stain that binds strongly to the DNA’s of only all bacterial cells (Tekin, in preparation).
4.3.2 Results and discussion
Planctomycete abundance in the total bacterial community increased with depth at Zorra
according to clone library data, and planctomycetes reached 5.2 and 20.8% of the total
Anaerobic Ammonium Oxidation in Waste Water - An Isotope Hydrological Perspective
101
bacterial community at depths greater than 5 m below ground surface. Large Illumina
libraries (~100 000) sequences indicated that anammox organisms made up ~10% of the
bacterial community at Zorra. Quantitative PCR using anammox specific primers (An7f
An1388r; Penton et al. 2006) confirmed that the abundance of anammox organisms increased
with the observed increase in planctomycete abundance at Zorra site. The number of
anammox 16S rRNA gene copies at Elmira was lower on average than that of Zorra. A
pristine background well (having not been impacted by NH
4
+
from the compost plume)
showed two orders of magnitude fewer anammox gene copies per nanogram of genomic
DNA than at impacted area. Clone libraries targeting the 16S rRNA genes of anammox
bacteria were used to examine the communities of anammox performing organisms at field
sites. All Anammox organisms were present at the two contaminated groundwater sites
however the community compositions differ (Fig 8). At Zorra site,
Can. Brocadia dominated
anammox community, where the vast majority of anammox sequence also grouped with
known
Can. Brocadia reference sequence, and a few clones grouped with known Can.
Scalinadua. FISH images also showed the presence of anammox bacteria in both of two
ground water sites (Data not shown).
Fig. 8. (a) Phylogenetic tree of environmental anammox sequences aligned with known
anammox reference sequences. Numbers in brackets represent the number of clones
identifying with each cluster. (b) Distribution of anammox related 16S rRNA gene
sequences found at each field site, by genus. (Modified from Moore et al., in preparation).
Anammox organisms are very hard to culture due to extremely slow growth rates, so there
is a high reliance on molecular techniques for finding and identifying these organisms in
mixed communities. PCR of environmental DNA extracts with general bacterial primers to
generate clone libraries has been shown to underestimate the proportion of anammox
organisms in the environment due to mismatches with “universal” primers (Jetten et al.,
2009; Penton et al., 2006; Schmid et al., 2007). Anammox organism abundance may be
greater than estimated by molecular methods due to known mismatches of anammox
organisms with several “anammox,” “planctomycete” or “universal bacterial” primer sets.
Anammox organisms have at least 10 mismatches with 27f and 2 mismatches with 1492r,
Waste Water - Treatment and Reutilization
102
primers used to create general bacterial 16S rRNA gene libraries for Zorra where the
abundance of planctomycetes was estimated to be between 5.2 and 20.8% of the total
bacterial population at 7.5 m. In summary, the results of microbiological investigation
provided further evidence for anammox presence in ground water and additional insight of
anammox bacteria community in ground water environments.
5. Anammox and denitrification in waste water
From a geochemical perspective, anammox and denitrification have the same implication,
i.e., they both lead to a loss of fixed nitrogen, albeit with a somewhat different
stoichiometry. The biogeochemical relationship between anammox bacteria and denitrifies
appears quite complex. They always coexist in the same environment where they can be
competitor to each other and also can play as a booster too.
In some environments with low NH
4
+
, anammox depends on ammonification, which may
connect with denitrifies’ function on N-containing organics. In addition, the electron
acceptor of anammox NO
2
-
also highly relies on the production of denitrification. Therefore,
the combination of anammox and denitrification is introduced in most of application in
waste water treatment as above stated. Under the assumption that NO
2
-
consumption by
anammox can be described by Michaelis-Menten kinetics (Dalsgaard et al., 2003), the
apparent half-saturation concentrations, Km for NO
2
-
during anammox in natural
environments has been constrained to <3 µM (Trimmer et al., 2003). Since maximum NO
2
-
concentrations in natural environments are only few µmol per liter, tighter competition for
NO
2
-
may affect the balance between anammox and denitrification (Kuyper et al., 2006). The
competition ability relies on the availability of organic matter and the physiology of
bacteria. Anammox bacteria is regarded as autotrophic, so the activity of anammox bacteria
may not be directly associated with organic matter. In contrast, organic matter provides
both of energy and substrates to denitrification which sometime limits denitrification
activity, especially in waste water treatment (Ruscalleda et al., 2008), but denitrifies grow
faster than anammox bacteria which make the organisms easily outgrown in the
competition. Similarly, NH
4
+
sometime derives from ammonification as mentioned above
which more complicate the relationship of the two processes.
With more studies, more and more scientists argue that it is possible that anammox account
for a substantial 30-50% of N
2
production in the ocean or oxygen minimum zone.
Theoretically, 29% of N
2
production during the complete mineralization of Redfieldian
organic matter through denitrification and anammox, is produced through anammox
(Dalsgaard et al., 2003; Devol, 2003). Kuyper et al., (2006) supposed the number can exceed
48%. However, Gruber (2008) think this conclusion can not be easily extrapolated, since the
dependence of anammox on denitrification, but he also pointed out that there is ample room
for surprises since how little we know about the process and the associated organisms.
6. Conclusions and outlook
Over 40 years have passed since the anaerobic oxidation of ammonium with nitrite
reduction was first proposed. However, our understanding of anammox is till far from
complete. Anammox research is still in a very early state. All over the world, research
groups are working on diverse aspects of the molecular biology, biochemistry,
ultrastructure, physiology and metabolism and ecology of anammox process. As well as
Anaerobic Ammonium Oxidation in Waste Water - An Isotope Hydrological Perspective
103
assessing the impact of the activity on the environment and their application in waste water
treatment. A lot of interesting facts have been revealed and certainly more will come in
future. Identifying the genomes of anammox bacteria will help to cultivate these bacteria in
pure cultures what wasn’t achieved until now. Pure cultures could optimize the application
of anammox in wastewater treatment plants and facilitate the research on the anammox
bacteria. Several important questions remain to be answered are: how important the
anammox process is in freshwater ecosystems, especially contaminated aquifer? How do
anammox organisms interact with other nitrogen involved bacteria? From an isotope
hydrological perspective, the relevant fractionation factors have yet to be established. Also,
the limited applications on waste water treatment indicate that a further understanding of
anammox is needed.
7. Acknowledgements
We are grateful for the significant contributions from J. Neufeld, T. Moore, E, Tekin, D.
Fortin and to G.G Hatch isotope laboratory and geochemistry laboratories at University of
Ottawa and University of Waterloo. This work was supported by NSERC awarded to Dr. I.
Clark.
8. References
Abma, W.R.; Driessen, W. Haarhuis, R. & van Loosdrecht, M.C.M. (2010). Upgrading of
swage treatment plant by sustainable and cost-effective separate treatment of
industrial wastewater. Water Sci. Technol. 61., 1715-1722.
Aravena, R. & Robertson, W.D. (1998). Use of multiple isotope tracers to evaluate
denitrification in ground water: Study of nitrate from a large-flux septic system
plume. Ground Water. 36., 975-982.
Arrigo, K.R. (2005). Marine microorganisms and global nutrient cycles.
Nature, 437., 15., 349-
355.
Barcelona, M.J. & Naymik, T.G. (1984). Dynamics of a fertilizer contaminant plume in
groundwater.
Environ. Sci. Technol. 18., 4.,257-261.
Böttcher, J.; Strebel, O. Voerkelius, S. & Schmidt, H L. (1990). Using isotope fractionation of
nitrate nitrogen and nitrate oxygen for evaluation of denitrification in a sandy
aquifer.
Journal of Hydrology. 114, 413–424.
Broda, E. (1977). Two kinds of lithotrophs missing in nature.
Z. Allg. Mikrobiogie. 17., 491-
493.
Buss, S.R.; Herbert A.W., Morgan, P. Thornton, S.F. & Smith, J.W.N. (2004). A review of
ammonium attenuation in soil and groundwater. Quarterly Journal of Engineering
Geology and Hydrogeology 37, 347–359.
Byrne, N.; Strous, M. Crépeau, V. Kartal, B. Birrien, J.L. Schmid, M. Lesongeur, F. Schouten,
S. Jaeschke, A. Jetten, M.S.M. Prieur, D. & Godfroy, A. (2008). Presence and activity
of anaerobic ammonium- oxidizing bacteria at deep-sea hydrothermal vents.
ISME
Journal. 3., 117-123.
Casciotti, K.L.; Sigman, D.M. Galanter Hastings, M. Böhlke, J.K. & Hilkert, A. (2002).
Measurement of the oxygen isotopic composition of nitrate in marine and fresh
waters using the denitrifier method.
Analytical Chemistry. 74, 4905–4912.
Waste Water - Treatment and Reutilization
104
Ceazan, M. L.; Thurman, E.M. & Smith, R. L. (1989). Retardation of ammonium and
potassium transport through a contaminated sand and gravel aquifer. The role of
cation exchange.
Environmental Science & Technology. 23., 1402-1408.
Clark, I. ; Timlin, R. Bourbonnais, A. Jones, K. Lafleur, D. & Wickens, K. (2008). Origin and
fate of industrial ammonium in anoxic ground water
15
N evidence for anaerobic
oxidation (anammox).
Ground Water Monit. Remediat. 28., 3., 73-82.
Dalsgaard, T.; Canfield D, E. Petersen, J. Thamdrup, B. & Acuña-González, J. (2003).
Anammox is a significant pathway of N
2
production by the anammox reaction in
the anoxic water column of Golfo Dulce, Costa Rica.
Nature. 422., 606-08.
Dalsgaard, T.; Thamdrup, B. & Canfield, D.E. (2005) Anaerobic ammonium oxidation
(anammox) in the marine environment.
Res Microbiol. 156: 457–464.
Delwiche, C.C. & Steyn, P.L. (1970). Nitrogen isotope fractionation in soils and microbial
reactions.
Environmental Science & Technology. 4., 45–67.
Devol, A. H. (2003). Solution to a marine mystery.
Nature, 422., 575-576.
Engström, P.; Dalsgaard, T. Hulth, S. & Aller, R.C. (2005). Anaerobic ammonium oxidation
by nitrite (anammox): Implications for N2 production in coastal marine sediments.
Geochim Cosmochim Acta
. 69., 2057–2065.
Erksine, A.D. (2000). Transport of ammonium in aquifers: retardation and degradation.
Quart. J.Engin. Geol.Hydrogeol. 33., 161-170.
Galán, A.; Molina, V. Thamdrup, B. Woebken, D. Lavik, G. Kuypers, M.M.M. & Ulloa, O.
(2009). Anammox bacteria and the anaerobic oxidation of ammonium in the oxygen
minimum zone off northern Chile.
Deep-Sea Research (II). 56., 1021-1031.
Gruber, N. (2008). The marine nitrogen cycle: overview and challenges. In:
Nitrogen in the
marine environment, 2
nd
edition. Capone, D.G. (Ed.). Elsevier Publisher, London, UK.
Hamersley, M. R.; Moebken, D. Boeherer, B. Schultze, M. Lavik, G. & Kuypers, M. M.M.
(2009). Water column anammox and denitrification in a temperate permanently
stratified lake (Lake Rassnitzer, Germany).
Systematic and Applied Microbiology. 32.,
571-582.
Hippen, A.; Rosenwinkel, K H. Baumgarten, G. & Seyfried, C.F. (1997). Aerobic de-
ammonification: a new experience in the treatment of wastewaters.
Water Sci.
Technol
. 35., 111–120.
Humbert, S.; Tarnawski, S. Fromin, N. Mallet, M-P. Aragno, M. & Zopfi, J. (2010). Molecular
detection of anammox bacteria in terrestrial ecosystems: distribution and diversity.
The ISME Journal 4, 450–454.
Hübner, H. (1986). Isotope effects of nitrogen in the soil and biosphere. In:
Handbook of
Environmental Isotope Geochemistry
, Vol. 2, The Terrestrial Environment. B, Fritz, P. &
Ch- Fontes, J.( Ed.), 361–425. Elsevier, Amsterdam, Netherlands.
Jetten, M.S.M.; Cirpus, I. Kartal, B. van Niftrik, L. van de Pas-Schoonen, K.T. Sliekers, O.
Haaijer, S. van der Star, W. Schmid, M. van de Vossenberg, J. Schmidt, I. Harhangi,
H. van Loosdrecht, M. Kuenen, J.G. Op den Camp, H.& Strous, M. (2005). 1994-
2004: 10 years of research on anaerobic oxidation of ammonium
. Biochemical Society
Transaction. 33., 1., 119-123.
Jetten, M.S.M.; Horn, S.J. & van Loosdrecht, M.C.M. (1997) Towards a more sustainable
municipal wastewater treatment system.
Water Sci. Technol. 35., 171-180.
Anaerobic Ammonium Oxidation in Waste Water - An Isotope Hydrological Perspective
105
Jetten, M.; Wagner, M. Fuerst, J. van Loosdrecht, M. Kuenen, J.G. & Strous, M. (2001).
Microbiology and application of the anaerobic ammonium oxidation (anammox)
process.
Current Opinion in Biotechnology. 12., 283–288.
Jetten, M.S.M.; van Niftrik, L. Strous, M. Kartal, B. Keltjens, J.T. & Op den Camp, H.J.M.
(2009). Biochemistry and molecular biology of anammox bacteria. Crit. Rev.
Biochem.
Mol. Biol. 44(2-3)., 65-84.
Kartal, B.; Kuenen, J.G. & van Loosdrecht, M.C.M. (2010). Sewage treatment with anammox.
Science. 328., 702-703.
Kartal, B.; Kuypers, M.M.M. Lavik, G. Schalk, J. Op den Camp, H.J.M. Jetten, M.S.M. &
Strous, M. (2007). Anammox bacteria disguised as denitrifiers: nitrate reduction to
dinitrogen gas via nitrite and ammonium.
Environ Microbiol. 9., 635–642.
Kayuzhnyi, S.; Gladchenko, M. Mulder, A. & Versprille, B. (2006). DEAMOX-New biological
nitrogen removal process based on anaerobic ammonia oxidation coupled to
sulphide-driven conversion of nitrate into nitrite.
Wat. Res. 40., 3637-3645.
Kendall, C. (1998). Tracing nitrogen sources and cycling in catchments, In
: Isotope Tracers in
Catchment Hydrology
, Kendall C. & McDonnell, J.J. (Ed.), 526–531. Elsevier,
Amsterdam, Netherlands.
Kuai, L.P. & Verstraete, W. (1998). Ammonium removal by the oxygen-limited antotrophic
nitrification-denitrification system.
Appl. Environ. Microbiol. 64., 4500-4506.
Kuenen, J. G. (2008). Anammox bacteria: from discovery to application
. Nature. 6., 320-326.
Kuypers, M.M.M.; Sliekers, A.O. Lavik, G. Schmid, M. Jørgensen, B.B. Kuenen, J.G.
Sinninghe Damsté, J.S. Strous, M. & Jetten, M.S.M. (2003). Anaerobic ammonium
oxidation by anammox bacteria in the Black Sea,
Nature. 422., 608-11.
Kuypers, M.M
.M.; Lavik, G. Woebken, D. Schmid, M. Fuchs, B.M. Amann, R. Barker
Jøregensen, B. & Jetten, M.S.M. (2005).
Massive nitrogen loss from the Benguela
upwelling system through anaerobic ammonium oxidation.
Proc. Natl Acad. Sci.
USA.102., 6478–6483.
Kuyper, M.M.M.; Lavik, G. & Thamdrup, B. (2006). Anaerobic ammonium oxidation in
marine environment, In:
Past and present water column anoxia. Neretin, L.N. (Ed.),
NATO Science series. Springer. Dordrecth, The Netherlands.
Ladiges, G.; Thierbach, Beier R.D., & Focken, M. (2006). Versuche zur zweistufigen
Deammonifikation im Hamburger Kla¨rwerksverbund. [Attempts to two-stage
deammonification in the wastewatertreatment union of Hamburg]. 6. Aachener
Tagung mit Informationsforum: Stickstoffru¨ ckbelastung -Stand der Technik 2006-,
Aachen (Ger), ATEMIS GmbH.p. Fachbeitrag 13 (13p).
Lieu, P.K.; Hatozaki, R. Homan, H. & Furukawa, K. (2005). Singlestage nitrogen removal
using Anammox and partial nitritation (SNAP) for treatment of synthetic landfill
leachate. Jpn. J.
Water Treat. Biol. 41 (2)., 103.
Meyer, R.L.; Risgaard-Petersen, N. & Allen, D.E. (2005). Correlation between anammox
activity and microscale distribution of nitrite in a subtropical mangrove sediment.
Appl. Environ. Microbiol. 71., 10., 6142-6149.
Moore, T.; Xing, Y.P. Tekin, E. Lazenby, B. Schiff, S. Robertson, W. Timlin, R. Lanza, S. M.
Ryan, C. Aravena, R. Fortin, D. Clark, I. & Neufeld, J.D. Characterization of
groundwater-associated communities of anaerobic ammonium-oxidizing bacteria.
(Submittedd to Applied and Environmental Microbiology).
Mulder, A. (1992). Anoxic ammonia oxidation. Patent number: 5078884. USA.
Waste Water - Treatment and Reutilization
106
Mulder, A.; van de Graff, A. A. Robertson, L.A. & Kuenen, J. G. (1995). Anaerobic
ammonium oxidation discovered in a denitrifying fluidized bed reactor.
FEMS
Microbiol. Ecol
. 16., 177-184.
Muyzer, G.; Dewaal, E.C. & Uitterlinden, A.G. (1993). Profiling of complex microbial-
populations by denaturing gradient gel-electrophoresis analysis of polymerase
chain reaction-amplified genes-coding for 16s ribosomal-RNA. Appl. Environ.
Microbiol. 59(3): 695-700.
Neufeld, J.D.; Schafer, H. Cox, M.J. Boden, R. McDonald, I.R. & Murrell, J.C. (2007). Stable-
isotope probing implicates
Methylophaga spp and novel Gammaproteobacteria in
marine methanol and methylamine metabolism.
ISME Journal. 1., 480-491.
Op den Camp, H.J.M.; Kartal, B. Guvent, D. van Niftrik, L.A.M.P. Haaijer, S.C.M. van der
Star, W.R.L. van de Pas-Schoonen, K.T. Cabezas, A. Ying, Z. Schmid, M.C. Kuypers,
M.M.M. van de Vossenberg, J. Harhangi, H.R. Picioreanu, C. van Loosdrecht,
M.C.M. Kuenen, J.G. Strous, M. & Jetten, M.S.M. (2006). Global impact and
application of the anaerobic ammonium-oxidation (anammox) bacteria.
Biochemical
Society Transactions
. 34., 174-178.
Penton, C.R.; Devol, A.H. & Tiedje, J.M. (2006). Molecular evidence for the broad
distribution of anaerobic ammonium-oxidizing bacteria in freshwater and marine
sediments.
Appl. Environ. Microbiol. 72., 6829-6832.
Richard, F.A. (1965). Anoxic basins and fjords. In:
Chemical oceanography, vol 1. Riley, J.P.&
Skirrow, G. (Ed.), Academic Press, London, 611-645.
Risgaard-Petersen, N.; Meyer, R.L. Schmid, M. Jetten, M.S.M. Enrich-Prast, A. Rysgaard, S.
& Revsbech, N.P. (2004). Anaerobic ammonium oxidation in an estuarine sediment.
Aquat Microb Ecol. 36., 293–304.
Risgaard-Peterson, N.; Nielsen, P. L. Rysgaard, S. Dalsgaard, T. & Meyer, R. L. (2003).
Application of the isotopic paring technique in sediments where anammox and
denitrification coexist.
Limnology and Oceanography: method. 1., 63-73.
Ritter, W.F.& Chirnside, A.E.M. (1995). Impact of dead bird disposal pits on groundwater
quality on the delmarva peninsula.
Bioresour. Technol. 53., 105-111.
Ruscalleda, M.; López, H. Ganiqué, R. Puig, S. Balaguer, M.D. & Colprim, J. (2008).
Heterotrophic denitrification on granular anammox SBR treating urban landfill
leachate.
Water Sci. technol. 58., 1749-1755.
Rysgaard, S. & Glud, R.N. (2004). Anaerobic N
2
production in Arctic sea ice. Limnol.
Oceanogr. 49., 1., 86-94.
Schmid, M.C.; Maas, B. Dapena, A. van de Pas-Schoonen, K. van de Vossenberg, J. Kartal, B.
van Niftrik, L. Schmidt, I. Cirpus, I. Kuenen, J.G. Wagner, M. Sinninghe Damst
é, J.
S. Kuypers, M.M.M. Revsbech, N.P. Mendez, R. Jetten, M.S.M. & Strous, M.
(2005). Biomarkers for the in situ detection of anaerobic ammonium oxidizing
(anammox) bacteria.
Appl. Environ. Microbiol. 71., 1677–1684.
Schmid, M.C.; Risgaard-Petersen, N. van de Vossenberg, J. Kuypers, M.M.M. Lavik, G.
Petersen, J. Hulth, S. Thamdrup, B. Canfield, D. Dalsgaard, T. Rysgaard, S. Sejr,
M.K. Strous, M. den Camp, H.J.M.O. & Jetten, M.S.M.( 2007). Anaerobic
ammonium-oxidizing bacteria in marine environments: widespread occurrence but
low diversity.
Environ. Microbiol. 9., 1476-1484.
Anaerobic Ammonium Oxidation in Waste Water - An Isotope Hydrological Perspective
107
Schubert, C. J.; Durish-Kaiser, E. Wehrli, B. Thamdrup, B. Lam, P.& Kuypers, M.M.M.
(2006). Anaerobic ammonium oxidation in a tropical freshwater system (Lake
Tanganyika).
Environmental Microbiology. 8., 1857-1863.
Sigman, D.M.; Casciotti, K.L. Andreani, M. Barford, C. Galanter, M. & Böhlke, J.K. (2001). A
bacterial method for the nitrogen isotopic analysis of nitrate in marine and fresh
waters.
Analytical Chemistry. 73., 4145–4153.
Sinninghe Damst
é, J.S.; Rijpstra, W.I.C. Schouten, S. Fuerst, J.A. Jetten, M.S.M. & Strous, M.
(2004). The occurrence of hopanoids in planctomycetes: Implications for the
sedimentary biomarker record.
Org Geochem. 35., 561–566.
Strous, M.; Fuerst, J. A. Kramer, E.H.M. Logemann, S. Muyzer, G. van de Pas-Schoonen, K.
T. Webb, R. Kuenen, J.G. & Jetten, M.S.M. (1999). Missing lithotroph identified as
new planctomycete.
Nature. 400., 446-449.
Strous, M.; Heijnen, J.J. Kuenen, J.G. & Jetten, M.S.M. (1998). The sequencing batch reactor as
a powerful tool for the study of slowly growing anaerobic ammonium-oxidizing
microorganisms.
Appl. Microbiol. Biotechnol. 50., 589-596.
Strous, M.; Pelletier, E. Mangenot, S. Rattei, T. Lehner, A. Taylor, M.W. Horn, M. Daims, H.
Bartol-Mavel, D. Wincker, P. Barbe, V. Fonknechten, N. Vallenet, D. Segurens, B.
Schenowitz -Truong, C. M
édigue, C. Collingro, A. Snel, B. Dutilh, B.E. et al., (2006).
Deciphering the evolution and metabolism of an anammox bacterium from a
community genome.
Nature. 440., 790–794.
Strous, M.; van Gerven, E. Kuenen, J.G. & Jetten, M.S.M. (1997a). Effects of aerobic and
microaerobic conditions on anaerobic ammonium-oxidizing (anammox) sludge.
Appl. Environ. Microbiol. 63., 2446-2448.
Strous, M.; van Gerven, E. Ping, Z. Kuenen, J.G. & Jetten, M.S.M. (1997b). Ammonium
removal from concentrated waste streams with the Anaerobic Ammonium
Oxidation (Anammox) process in different reactor configurations.
Water Res. 31.,
1955-1962.
Tekin, E. (2010) Anammox in contaminated ground water. Thesis (in preparation).
University of Ottawa.
Tamura, K., Dudley, J., Nei, M., and Kumar, S. (2007). MEGA4: Molecular evolutionary
genetics analysis (MEGA) software version 4.0.
Mol. Biol. Evol. 24., 1596-1599.
Thamdrup, B. & Dalsgaard, T. (2002). Production of N
2
through anaerobic ammonium
oxidation coupled to nitrate reduction in marine sediments.
Applied and
Environmental microbiology. 68., 1312-1318.
Thamdrup, B.; Dalsgaard, T. Jensen, M.M. Ulloa, O. Farías, L. & Escribano, R. (2006).
Anaerobic ammonium oxidation in the oxygen-deficient water off northern Chile.
Limnol. Oceanogr. 51., 2145-2156.
Third, K. A.; Slickers, A.O. Kuenen, J.G. & Jetten, M.S.M. (2001). The CANON system
(completely autotrophic nitrogen-removal over nitrite) under ammonium
limitation interaction and competition between three groups of bacteria.
System.
Appl. Microbe. 24., 588-596.
Trimmer, M.; Nicholls, J.C. & Deflandre, B. (2003). Anaerobic ammonium oxidation
measured in sediments along the Thames estuary, United Kingdom.
Appl. Environ.
Microb.69., 6447-6454.
Tsushima, I,; Kindaichi, T. & Okabe, S. (2007). Quantification of anaerobic ammonium-
oxidizing bacteria in enrichment cultures by real-time PCR.
Water Res. 41.,785–794
Waste Water - Treatment and Reutilization
108
Umezawa, Y.; Hosono, T.; Onodera, S. Siringan, F. Buapeng, S. Delinom, R. Yoshimizu, C.
Tayasu, I. Nagata, T. & Taniguchi, M. (2008). Sources of nitrate and ammonium
contamination in groundwater under developing Asian megacities.
Sci. Total
Environ
. 404., 361-376.
van de Graaf, A. A.; de Bruijn, P. Robertson, L.A. & Kuenen, J.G. (1997). Metabolic pathway
of anaerobic ammonium oxidation on the basis of N-15 studies in a fluidized bed
reactor.
Microbology-UK. 143., 2415-2421.
van de Graaf, A. A.; Mulder, A. de Bruijn, P. Jetten, M.S.M. Robertson, L.A. & Kuenen, J.G.
(1995). Anaerobic oxidation of ammonium is a biologically mediated process.
Appl.
Environ. Microbial
. 61., 1246-1451.
Van der Star, W.R.I.; Abma, W.R. Blommers, D., Mulder, J.W. Tokutomi, T. Strous, M.
Picioreanu, C. & van Loosdrecht, M.C.M. (2007). Startup of reaction for anoxic
ammonium oxidation: Experiences from the first full-scale Anammox reactor in
Rotterdam.
Wat. Res. 41., 4149-4163.
Van Loosdrecht, M.C.M. (2008). Innovative nitrogen removal. In:
Biological Wastewater
Treatment Principles, Modelling and Design
. Henze, M. et al., (Eds.). IWA Publishing,
London, UK.
Van Dongen, U.; Jetten, M.S.M. & van Loosdrecht, M.C.M. (2001). The SHARON-Anammox
process for treatment of ammonium rich wastewater.
Water Sci.Technol. 44., 1.,153-
160.
Wada, E.; Kadonaga, T. & Matsuo, S. (1975).
15
N abundance in nitrogen of naturally
occurring substances and global assessment of denitrification from isotopic view
point.
Geochemical Journal. 9., 139–148.
Wett, B. (2006). Solved upscaling problems for implementing deammonification of rejection
water.
Water Sci. Technol. 53., 12., 121–128.
Wyffels, S.; Boeckx, P. Pynaert, K. Zhang, D. van Cleemput, O. Chen, G. & Verstraete, W.
(2004). Nitrogen removal from sludge reject water by a two-stage oxygen-limited
autotrophic nitrification denitrification process.
Water Sci. Technol. 49., (5–6)., 57–64.
6
Measurement Techniques for
Wastewater Filtration Systems
Robert H. Morris
1
and Paul Knowles
2
1
Nottingham Trent University,
2
Aston University
UK
1. Introduction
Filter-based microbiological wastewater treatment systems (such as subsurface flow
constructed wetlands, trickling filters and recirculating sand filters) require a thorough
understanding of system hydraulics for their correct design and efficient operation. As part of
the treatment process, the filter media will gradually become clogged through a combination
of solids filtration and retention, biomass production and chemical precipitation. Eventually
the media may become so clogged that hydraulic malfunctions ensue, such as untreated
wastewater bypassing the system. To achieve good asset lifetime a balance must be struck
between these essential treatment mechanisms and the hydraulic deterioration that they cause.
For many wastewater filtration systems the exact mechanism of clogging is not obvious, and
few specialised techniques have been developed which allow the cause and extent of
clogging to be measured in typical systems. The resultant lack of understanding regarding
clogging hinders the ability of operators to maintain good hydraulic performance. In this
chapter, for the first time, we compare three different families of standard hydraulic
measurement techniques and discuss the information that they can provide: hydraulic
conductivity measurements; clog matter characterisation and hydrodynamic visualisation.
Each method is assessed on its applicability to typical wastewater filtration systems using
horizontal subsurface flow constructed wetlands as a case study.
Furthermore, several new techniques will be considered which have been specifically
developed to allow in situ determination of hydraulic health for subsurface flow constructed
wetland wastewater filtration systems. These include in situ constant and falling head
permeameter techniques and embeddable magnetic resonance probes.
Discussion is given to the ways in which different methods can be combined to gather
detailed information about the hydraulics of wastewater filtration systems before exploring
methods for condensing heterogeneous hydraulic conductivity survey results (that vary by
several orders of magnitude) into a single representative value to describe the overall
hydraulic health of the system.
2. Mechanisms of clogging
A typical subsurface flow wetland comprises a layered structure as seen in figure 1. Such a
system usually comprises a gravel matrix in which Phragmites australis (the common reed)
Waste Water - Treatment and Reutilization
110
is grown. These systems are used as an environmentally friendly method for wastewater
sanitisation before eventual discharge into a watercourse. The wastewater flows under
gravity through the gravel (below the surface), where it encounters optimum conditions for
purification: solids are removed by the gravel substrate and the root network of the reeds,
which also provide a surface on which to trap particulates and promote biofilms. Removal
of organic material, pathogens and nutrients is predominantly due to biofilms. Many
chemical compounds are absorbed or precipitated depending on the physicochemical
conditions of the wastewater constructed wetland (Brix, 1994). Over time this causes the
pore spaces between gravel grains to become occluded. A small amount of clogging will
occur due to biofilm growth which helps to improve the overall efficiency and functionality
of the system, although over time, excessive biofilm growth and retention of solids may lead
to bypass flow of untreated influent. The balance between these two dominant clogging
mechanisms often requires a multi-modal assessment methodology to elucidate the
complete nature and severity of the clogging.
Fig. 1. Cross sectional view of a typical subsurface flow constructed wetland.
3. Traditional measurement strategies
There are a variety of measurement techniques available to determine the hydraulic
conditions within the filter in situ (Knowles et al., 2009a; Lin et al, 2003), whilst
determination of the composition and quantity of clog matter usually requires samples of
the gravel matrix to be extracted prior to laboratory analysis. Each of these measurement
techniques is discussed in this section along with the weaknesses and strengths of each
strategy, which are summarised in Table 1. Whilst no individual technique is suitable for
gaining a full insight into the true extent of clogging, they may be useful to understand
individual contributions of system clogging or be used in combination for an understanding
of the interplay between different factors.
3.1 Hydraulic conductivity measurements
Traditional measurements of hydraulic conductivity share two common elements. The first
is that a test well or sample core must be made either in situ or remotely in a laboratory. The
second is that the hydraulics of the system must be tested in some repeatable or measurable
way to determine the hydraulic properties of the sample under test. In this section seven
common hydraulic conductivity measurement techniques will be briefly discussed.
Measurement Techniques for Wastewater Filtration Systems
111
Test Family Test Description
Slug Test
A piezometer tube (devoid of media) is inserted into
the media. The water level is rapidly changed by
addition of water or a metal slug. The evolution of
the water level back to equilibrium is used to
calculate the permeability.
Pumping Test
Water is pumped at a constant rate into or out of a
well, and the resulting cone of depression in the
filtration medium is monitored over time.
Steady State
Test
Flow through the filter medium results in a
hydraulic gradient. Differences in the height of the
water table are observed in different wells.
Unlined
Auger Hole
A borehole is made into the media and water is
either added or removed. The recharge rate or flow
rate into the media is measured.
Infiltration
Tests
A ring is impressed into the surface of the filtration
medium and water is added to measure the
infiltration rate through the surface.
Laboratory
Permeameter
A sample of the media is placed into a laboratory
permeameter cell. A constant or variable head of
water is then applied across the media. Manometer
take off points allow the variation in resistivity
across the sample to be determined.
Hydraulic
Conductivity
Modified
Cube Method
A cubic sample of the filtration media is sealed in
wax before removing single sets of opposing faces
and passing flow through the media, the hydraulic
conductivity in different planes can be determined.
Direct
Porosity
Measurements
Either saturated or drainable porosity of an
extracted sample is measured in the laboratory. This
approximates the ratios of free to interstitial water.
Time Domain
Reflectometry
Capacitance
Probe
Ground
Penetrating
Radar
A family of methods which rely on the dielectric
constant of a medium being proportional to water
saturation. Each method uses a different approach
to measure this property. TDR and CP are inserted
at various points and give readings in the
immediate locality whilst the GPR is swept over the
surface providing a subsurface image.
Clog Matter
Characterisation
Solids Assays
Total and volatile solids of the interstitial clog
matter are determined by drying the samples.
Suspended fractions in interstitial water may also be
measured.
Breakthrough
Curve
The breakthrough of a pulse of tracer added to the
system inlet is monitored at the outlet of the system
Hydrodynamic
Visualisation
Internal
Tracing
The dynamics of an inlet injected tracer are
monitored at different points in the system.
Table 1. Summary of available hydraulic measurement techniques separated into families.
Waste Water - Treatment and Reutilization
112
3.1.1 Slug test
To perform a slug test, a hollow tube perforated at the lower end or a piezometer is inserted
into the gravel substrate. A rapid and temporary change in water level, followed by return
to the equilibrium state is used to determine the hydraulic conductivity of the substrate near
the tube. This is achievable in one of two ways: the first (and the origin of its name) is shown
in figure 2 and requires the introduction of a metal slug into the water which infiltrates the
tube thus displacing some of it. The second is to add a known amount of water to the well.
Measurements of the water level (or air pressure above the water) will show a sudden
increase corresponding to the volume of the slug followed by an exponential decay back to
the natural level of the water table. The hydraulic conductivity of the surrounding gravel
can then be determined.
Fig. 2. Schematic representation of the measurement phases in the slug test used in a gravel
substrate.
The analysis of the relaxation curve from the slug test relies on two assumptions. The first is
that the water and gravel in the area around the tube is incompressible, which is typically a
reasonable assumption in an established water saturated wetland. The second is that the
surrounding medium is completely homogeneous which unfortunately is rarely the case.
The method for determining the hydraulic conductivity is based on a modified Thiem
equation (equation 1)
(
)
2
0
ln
,
Wt
Rhh
K
Ft
=
(1)
where K is the hydraulic conductivity of the gravel substrate, R
W
is the radius of the well,
h
0
and h
t
are the height of the water relative to the equilibrium level at the start and end of
Measurement Techniques for Wastewater Filtration Systems
113
the experiment lasting time t and F is a shape factor determined by the dimensions of the
well using one of several methods. The shape factor presented in equation 2 is valid only
for a well which has a perforated section with a length, L
P
, shorter than sixteen times its
radius. The reader is referred to the work of Hvorslev (1951) for more unusual well
geometries.
()
2
.
20.25
L
P
F
LR
P
W
π
=
+
(2)
For gravel substrates which contain fractions of different gravel sizes, the hydraulic
conductivity determined using the slug test is often not representative and an alternative
technique is required.
3.1.2 Pumping test
The pumping test is typically performed on aquifers but is equally applicable (with careful
consideration of error) to water saturated gravel substrates. The pumping test can be
performed either by pumping water into or out of the gravel substrate. In a clogged system
this can be quite disruptive if the flow rates are too high and in shallower systems, it may
not be possible to withdraw a sufficiency of water to yield valid results in the case where the
water is pumped out. The test is set up as in figure 3 with at least one test well, although the
results are more reliable with several.
As water is withdrawn (or added) to the substrate, a cone of depression develops (for water
withdrawal), the geometry of which corresponds to the flow rate out of (into) the well and
hydraulic resistance to flow offered by the substrate. By measuring the height of the water
table at several places along the radius of the cone it is possible to determine the hydraulic
conductivity of the gravel substrate. Most often this test is performed with a constant
pumping flow rate and the changing geometry of the cone of depression is plotted against
time. It is also possible however to repeat this test several times in succession with
increasing pump rates to improve the quality of the analysis. The hydraulic conductivity is
again determined from the measurements using a steady state solution to the Thiem
equation (eq. 3)
0
ln ,
2( )
Qr
K
dh h R
π
⎛⎞
=
⎜⎟
−
⎝⎠
(3)
where Q is the flow rate of the pump, d is the depth of the substrate, h-h
0
is the drawdown
(i.e. the difference between the depth of the water before and after the pump is started)
measured at a distance r from the pumping well. R is the distance from the pumping well at
which the water level is unaffected. In a small wastewater treatment system, where the cone
of depression may quickly extend to the inlet, R can be assumed as the distance to the inlet
of the system with a usually small experimental error.
The results from this test are only truly representative of the actual hydraulics of the system
when it has undergone little clogging and is relatively deep in comparison to the depth of
the wells and the depth of the cone of depression.
Waste Water - Treatment and Reutilization
114
Fig. 3. Schematic of pump test set up. The right hand side is the pumping well whilst the left
and centre are two test wells.
3.1.3 Steady state test
The steady state test is one of the least disruptive hydraulic conductivity tests. It requires
only the insertion of several test wells (pipes with part perforation as used previously) at
various lengths along the bed. The flow of water from one side of the bed to the other will
result in a hydraulic gradient along its length, causing a variation in the height of the water
table which can be measured in each test well. The determination of the hydraulic
conductivity is then relatively simple using Darcy's law as in equation 4.
,
Qr
K
Ah
=
(4)
where h is the difference in height between the water table in each well separated by
distance r, and A is the cross sectional area through which the flow has taken place. This
analysis relies on a homogeneous flow path between the wells and assumes that the flow
uses the whole of the cross sectional area. Although the impact of these assumptions can be
minimised by keeping the test wells relatively close together, the extra number of wells that
are required may cause too great a disturbance to the substrate to be fully representative.
This test is best performed in a system which has not undergone long term clogging to
ensure that the results are as reliable as possible.
Measurement Techniques for Wastewater Filtration Systems
115
3.1.4 Unlined auger hole
The unlined auger test is a means of measuring the hydraulic conductivity in a constructed
wetland which has undergone a sufficient degree of clogging that the gravel matrix has
become stabilised by clog matter. This allows an unlined bore hole to be made without too
great a risk of the walls collapsing into it. The three tests discussed so far can all be
performed in an unlined auger hole with the benefit of complete confidence that the whole
surface of the bore hole is participating in the method thus ensuring complete assessment of
the local environment. The drawback of this method is however ensuring that the walls do
not become weakened to the point of collapse and to avoid the build up of silt and sediment
in the base of the well. This is particularly critical for the pumping test in which the large
flow rates increase the likelihood of this occurring.
3.1.5 Infiltration test
The testing strategies discussed in the previous sections are primarily affected by horizontal
hydraulic conductivity only. As this is the typical direction of fluid flow in a typical
horizontal constructed wetland this is acceptable. In many situations, particularly clogged
gravel beds, overland flow occurs which results in a dual flow regime with vertical and
horizontal components. Additionally, vertical flow constructed wetlands are also becoming
more popular thanks to their smaller footprint and thus methods for measuring the vertical
hydraulic conductivity are required. In the infiltration test, the vertical infiltration rate of
flow across the surface of the system is measured. This is normally performed by burying
two concentric metal rings partially in the surface of the gravel (the rings are typically 60cm
and 30cm in diameter and about 25cm in height buried 15cm into the gravel) as in figure 4.
Both the central ring and the space between the two rings are filled with water. The drop in
water level is monitored every few minutes. The water level is kept relatively constant and
Fig. 4. Schematic representation of equipment used for infiltration testing before and after
filling with water (left and right).
Waste Water - Treatment and Reutilization
116
measurements are made frequently. Once the water is seen to be falling at a constant rate the
value is noted as the basic infiltration rate. The time that this takes is also of some relevance,
particularly on dry samples as it allows the tester to determine the wetability.
This test only indicates the infiltration rate through the surface of the substrate and does not
indicate the hydraulic conductivity of the bulk substrate. It is worth noting that the test is
only valid so long as the water between the two rings is at a similar level as that inside the
inner ring, as it is used to prevent horizontal motion of the water from the centre.
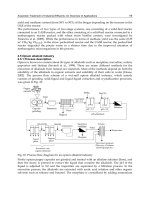
3.1.6 Laboratory permeameter
The laboratory permeameter is often considered the most accurate means of assessing gravel
permeability. However, to use a traditional permeameter, a sample of the gravel substrate
must be extracted, in tact with the surrounding clog matter and transported to a laboratory.
The sample is then loaded into the permeameter system and, using one of two techniques,
the permeability is assessed. The standard setup for a laboratory permeameter is as shown
in figure 5. A constant head of water is produced by using a top reservoir with a connection
to the permeameter and a much larger overflow drain. Water is fed into the device at a rate
that the overflow drain is utilised to a small degree, such that a constant flow rate into the
permeameter is maintained. A bottom reservoir is used to create a water-lock and ensure
that the sample remains saturated. The height difference between the water level in the top
and bottom reservoir forces flow through the sample, with a flow-rate that corresponds to
the hydraulic conductivity of the media. By measuring the outlet flow-rate, Darcy's law can
be used to determine the hydraulic conductivity of the sample as in equation 5.
,
QL
K
Ah
=
Δ
(5)
where Δh is the distance between the bottom of the reservoir overflow and the bottom of the
sample overflow and L is the vertical length of the sample with cross sectional area A. In this
experiment Q is calculated using the volume of water collected per unit time.
The accuracy of this method can be somewhat improved by varying the value of ∆h and
measuring Q. If Q is then plotted against (A∆h)/L, a linear relationship with gradient K is
found.
An alternative set up which allows a similar measurement accuracy in a shorter time is
known as a falling head permeameter. The equipment is the same as in the static head
permeameter only instead of keeping the level of the cup constant, it is allowed to drop with
time from a height h
0
to a height of h
t
at time t. Typically the cup is narrower than the
sample in this experiment to allow the height of the liquid to be measured easily. The
experimental protocol is to monitor the height of the liquid in the reservoir over time. A
rearrangement of Darcy's law can then be used to determine the value of the hydraulic
conductivity. If ln(h
0
/h
t
) is plotted against t, the slope will be KA/aL, where a is the cross
sectional area of the cup.
The main drawback of this technique is that the samples must be extracted from the
wetland. Careful measurements do however give reliable assessment of the hydraulic
conductivity using both protocols which are often used as benchmarks for alternative
testing strategies.
Measurement Techniques for Wastewater Filtration Systems
117
Fig. 5. Schematic representation of laboratory permeameter setup.
Waste Water - Treatment and Reutilization
118
3.1.7 Measurements of anisotropic hydraulic conductivity
Hydraulic conductivity is a tensor with three nodes that represent hydraulic conductivity in
different directions of flow. In an anisotropic medium, hydraulic conductivity at a point
may vary depending on the flow direction. A simple example of this is whereby particle
size stratification has created horizontal layers that encourage horizontal flow channelling,
and do not encourage vertical flow across the layers. The previously discussed methods are
axial tests which only allow measurement of hydraulic conductivity in one direction. Recent
laboratory methods have been developed to allow anisotropic hydraulic conductivity to be
evaluated in extracted soil samples (Renard et al., 2001). One such method called the
Modified Cube Method has been applied to measure anisotropy in natural wetland peat
samples (Beckwith et al.; 2003, Kruse et al.; 2008, Rosa and Larocque, 2008). The test involves
cutting a cube of material from an extracted core and coating it in paraffin wax. One set of
opposing sides of the wax case are removed and the sample subjected to an axial hydraulic
conductivity test, such as the constant head laboratory permeameter test. After
measurement the wax case is restored and a different set of opposing sides is removed, and
the test repeated across this flow direction. This is performed for all three flow directions
such that the hydraulic conductivity tensor can be ascertained.
3.2 Clog matter characterisation
The techniques described in the previous section are used to assess the hydraulic properties
of the clogged porous media flow system. However, these tests cannot reveal information
about the cause of clogging and the nature of the clog matter, which is often key in
determining the health of a system. In this section we will consider the range of common
tools available to determine the properties of the clog matter fraction in the system.
3.2.1 Direct porosity measurements
There are numerous methods for measuring the porosity of a sample directly. In this section
we will discuss the two most commonly used for samples collected from constructed
wetlands. This is a highly invasive technique and requires the extraction of sample cores
from the gravel substrate. Once these cores are extracted, they are analysed in the laboratory
using two tests to determine the amount of water which is free and the amount that is
associated, that is to say the amount that is associated with the surface of the grains in
biofilms for example. The first test is relatively straightforward and relies on taking a known
volume of the core sample which is allowed to drain of water for a few minutes, possibly
during gentle agitation, whilst preventing the loss of any clog matter. The sample is placed
in a container and the amount of water needed to fill the sample (again with or without
agitation) divided by the total apparent volume of the sample is the free water porosity. This
measure is reliable in samples with well connected pores so that all of the free water is able
to drain unhindered from the sample. The water is then drained again from the sample in
preparation for the second test. Collection and determination of the volume of this second
drain of water is advisable as a means to check the reliability of the first measurement.
Determination of the remaining, and hence associated, water in the sample can be achieved
using one of two methods. The longer of the two methods allows the remaining water to
drain slowly from the sample in a sealed vessel (as evaporation will result in much of the
loss) until it is completely dry, the volume of the collected water then represents the pore
space occupied by interstitial water in the sample. This is a lengthy process and requires a
careful set up to avoid disrupting the sample. The alternative technique, which is often
Measurement Techniques for Wastewater Filtration Systems
119
combined with a solids assay as described in section 3.2.5 is to weigh the sample before and
after gentle heating to evaporate the interstitial water fraction. The mass change is then used
to determine the volume of water lost. This method may give unpredictable results in a
sample which contains volatile solids which will contribute to the mass of the sample.
Although these techniques both offer useful results, the need to collect a core of the gravel
substrate often makes them less attractive than their in situ counterparts.
3.2.2 Time domain reflectometry
Time domain reflectometry is a technique which relies on the relationship between the
dielectric properties of different materials and their water content. The principal for
measuring clogging using Time Domain Reflectometry and the next two techniques to be
reviewed; Capacitance Probes and Ground Penetrating Radar; is that they all measure
properties that will vary depending on the amount of interstitial water in a sample.
Therefore, it would be possible to detect where accumulation of clog matter has reduced the
interstitial water volume compared to a calibrated clean sample. This, in itself, is an inherent
limitation of these techniques as clog matter is typically well hydrated (often above 95%
water by volume) and as such very small variations in water volume must be measured. The
complexity of the system used to perform the measurements is such that a detailed
description is beyond the scope of this chapter. Instead, the basic operating principles of the
technology will be provided along with the relationship between the results and the
physical properties of the sample. The technique is particularly difficult to use in a gravel
substrate as the grains disrupt its underlying mechanism. Its use in heavily clogged media is
however still valuable as a method for assessing water content.
The underlying principle of time domain reflectometry is similar to that of radar. An
electromagnetic wave pulse is produced and transmitted into the gravel substrate, often using
metal electrodes. The wave will propagate through the medium at a speed which is
determined by the dielectric constant of the medium which is dependent on the water content.
The wave will be reflected and picked up by the same electrodes as were used to deliver it into
the medium. The time between the emission and absorption of this pulse is used to determine
the speed with which it travelled through the medium. This is then converted to water content
using a calibration produced from samples with known water content. Whilst the technique
may offer very accurate results, it is heavily influenced by spurious reflections caused by local
heterogeneities, may be affected by changes in electrical conductivity (such as those caused by
salinity) and relies on calibration in similar samples to those under test to be representative.
An alternative technique which relies on the same underlying principle is known as time
domain transmissometry. In this technique, instead of using the same electrodes to generate
and measure the pulse, separate electrodes are used. In this way it is possible to somewhat
reduce the influence of local inhomogeneity on the results although this is often of little benefit
in a filtration system containing gravel which is still highly reflective to the wave.
3.2.3 Capacitance probe
The operation of the capacitance sensor is similar in some respects to time domain
reflectometry in that electrodes are used to determine the dielectric properties of the gravel
substrate. In this technique however, the two electrodes are commonly metallic plates
wrapped around a cylinder (see Figure 6). In combination with the surrounding gravel
substrate, clog matter and water, a capacitor is formed. The capacitance of this arrangement
is dependent on the size and spacing of the plates and the dielectric permittivity of the
Waste Water - Treatment and Reutilization
120
surrounding medium. The dielectric permittivity is in turn dependent predominantly on the
water content and salinity. Several of these probes are often included on a single plastic
cylinder to maximise the measurements that can be made for a single insertion.
Fig. 6. Schematic of capacitance sensor. Right hand figure is front view of left hand figure
showing the area in which measurements are made.
The measurement of the capacitance is typically made by including the capacitance probe as
an element of a resonant circuit. The frequency at which the circuit resonates is determined by
the value of the capacitor and thus may be used to determine the dielectric permittivity in the
region of influence (see figure 6). The size of, and spacing between the plates may be adjusted
to optimise the penetration distance from the cylinder into the medium based on the intended
usage. For example, the plates would ideally be separated by a greater distance for
measurements in gravel where the particle size is large in comparison to a measurement in a
sand filter. As with time domain reflectometry, the capacitance probe must be calibrated.
Owing to its considerably lower cost however, it is quite practical to have several probes along
the bed including one in the influent, thus compensating for the effect of salinity.
3.2.4 Ground penetrating radar
Ground penetrating radar is a technique which uses pulses of microwaves to determine the
properties of a sample non-destructively. The instruments are relatively expensive and
complex but offer an unprecedented measure of the dielectric properties of a sample without
requiring its extraction. In a typical setup, a unit is moved along the surface of a bed whilst the
measurement is made. Microwave pulses are transmitted by a coil in contact with the surface
of the ground. At changes in dielectric constant (such as different media or different water
content) the microwaves are reflected back and picked up by the instrument. The use of
ground penetrating radar in a typical constructed wetland is very challenging given the reed
growth above ground making it difficult to place the equipment on the surface and the
propensity for gravel to cause a great number of reflections before any measurements have
been made. For this reason it is not usually practical for the majority of situations.
3.2.5 Solids assays
In order to assess the quantity of clog matter in an extracted sample from a wetland, solids
assays may be used. The typical procedure is to extract a known volume or mass of sample
Measurement Techniques for Wastewater Filtration Systems
121
from a wetland and collect the water which drains from it. This sample is then dried and the
remaining solids are weighed to determine the free particulates in the sample. In the case of
a gravel substrate, the sample is washed to allow the clean gravel to be sieved out and
removed. The accumulated solids fraction is then dried (often in an oven at a low
temperature) and the remaining solid fraction weighed to determine the quantity of the clog
matter. Whilst this method offers a good measure of the total quantity of solids in the
sample, as a single measurement it may not offer much insight into the actual clogging
process. This is because a large contribution of the clogging comes from biofilms which may
contain up to 80% water by volume. When this water is removed, the volume occupied by
the biofilm will be greatly reduced thus giving a misleading result in terms of the extent of
the clogging. This test is best performed with the direct porosity measurements detailed in
section 3.2.1 to provide a fuller understanding. If desired, ignition tests above 550°C can
then be used to calculate the volatile fraction of the sample (BS-EN-872, 2005).
3.3 Hydrodynamic visualisation
All of the techniques presented thus far in this chapter have been localised measurements
which rely on studying the material directly around a probe or the extraction of samples for
laboratory analysis. In systems in which the flow path is in some way defined (as it is in
constructed wetlands) hydrodynamic visualisation techniques are useful for determining
how flow responds to clogging. Two strategies are discussed in this section both of which
rely on injecting a tracer (for example rhodamine dye) near the inlet and then monitoring for
its presence at one or more locations in the bed.
3.3.1 Breakthrough curve
The basic measurement using a tracer method is the breakthrough curve. In this technique, a
tracer such as rhodamine dye is injected at the inlet of the bed. A specific sensor for the dye
to be used (an optical fluorescence detector in the case of rhodamine dye) is installed at a
location in the bed (typically the outlet in the case of breakthrough) and is monitored from
the time of injection, through detection of the dye, when it passes through the sensor, until
the detection level returns to that at the start of the test. A plot of the detected dye from
injection to end is known as the breakthrough curve and will typically have a single peak of
given amplitude and breadth. The integral of this curve should equal the amount of dye
injected. Should this not be the case, it is likely that there are features of the flow path that
result in stagnant water. Occasionally distinct peaks will be picked up other than the main
peak which indicates flow short-circuiting along multiple preferential flow-paths and
resulting in multiple peaks. The treatment performance of the system is directly linked to
the hydraulic performance. Ideally, the system behaves as a Plug Flow Reactor which means
that all of the fluid remains in the system for the same duration, the design retention time;
which would correspond to a sharp pulse of tracer being detected at the outlet. The broader
the breakthrough curve, the greater the extent of mixing and short-circuiting within the
system, and the more likely that some flow will prematurely discharge before sufficient time
for treatment has elapsed (Figure 7). It is always wise to repeat the measurement with the
sensor at several outlet locations on several different occasions as there are many factors
which affect the flow path including temperature, humidity and precipitation. The reader is