Báo cáo hóa học: " Research Article A Fuzzy Color-Based Approach for Understanding Animated Movies Content in the Indexing Task" doc
Bạn đang xem bản rút gọn của tài liệu. Xem và tải ngay bản đầy đủ của tài liệu tại đây (18.63 MB, 17 trang )
Hindawi Publishing Corporation
EURASIP Journal on Image and Video Processing
Volume 2008, Article ID 849625, 17 pages
doi:10.1155/2008/849625
Research Article
A Fuzzy Color-Based Approach for Understanding Animated
Movies Content in the Indexing Task
Bogdan Ionescu,
1, 2
Didier Coquin,
1
Patrick Lambert,
1
and Vasile Buzuloiu
2
1
LISTIC, Domaine Universitaire, BP 80439, 74944 Annecy le vieux Cedex, France
2
LAPI, University Politehnica of Bucharest, 061071 Bucharest, Romania
Correspondence should be addressed to Didier Coquin,
Received 26 July 2007; Revised 15 November 2007; Accepted 11 January 2008
Recommended by Alain Tremeau
This paper proposes a method for detecting and analyzing the color techniques used in the animated movies. Each animated
movie uses a specific color palette which makes its color distribution one major feature in analyzing the movie content. The color
palette is specially tuned by the author in order to convey certain feelings or to express artistic concepts. Deriving semantic or
symbolic information from the color concepts or the visual impression induced by the movie should be an ideal way of accessing
its content in a content-based retrieval system. The proposed approach is carried out in two steps. The first processing step is the
low-level analysis. The movie color content gets represented with several global statistical parameters computed from the movie
global weighted color histogram. The second step is the symbolic representation of the movie content. The numerical parameters
obtained from the first step are converted into meaningful linguistic concepts through a fuzzy system. They concern mainly the
predominant hues of the movie, some of Itten’s color contrasts and harmony schemes, color relationships and color richness. We
use the proposed linguistic concepts to link to given animated movies according to their color techniques. In order to make the
retrieval task easier, we also propose to represent color properties in a graphical manner which is similar to the color gamut repre-
sentation. Several tests have been conducted on an animated movie database.
Copyright © 2008 Bogdan Ionescu et al. This is an open access article distributed under the Creative Commons Attribution
License, which permits unrestricted use, distribution, and reproduction in any medium, provided the original work is properly
cited.
1. INTRODUCTION
One of the most important human senses, maybe the most
important one, is human vision. We sense, explore,and un-
derstand the surrounding world by using our visual percep-
tion. For every object we interact with, we create a mental
image of its specific colors: the sky is blue, the forest is green,
the sand is yellow, and so forth. In this way, we can easily rec-
ognize similar objects. Moreover, individual colors or groups
of colors create particular feelings, for example, blue gives
the sensation of cold, orange gives a warm sensation, black
and white create a contrast, excessive red creates a discom-
fort, and so on. Inspired by real life, researchers attempted
to replicate our senses by developing systems capable of pro-
viding automatic understanding of the visual information.
Color, in particular, has been extensively used, now, for more
than three decades to describe the image visual perception
[4].
One conventional approach is to capture the image color
distribution using color histograms. They are computed ei-
ther on the entire image or for some regions of interest. His-
tograms are very reliable statistical measures which describe
the global color distribution. They are invariant to some geo-
metrical transformations of the image (e.g., rotations, resolu-
tion change, etc.) [11]. However, histograms are sensitive to
global illumination changes. To overcome this problem, his-
tograms can be computed from specially tuned color spaces
which separate the illumination information from the chro-
matic information (i.e., the HSV or YCbCr color spaces) [1].
In addition to the information provided by histograms,
color names are used to describe the human color percep-
tion. Associating names with colors allows everyone to create
a mental image of the color. The color names are typically re-
trieved from a dictionary which is the result of a color nam-
ing system. The existing naming systems use different tech-
niques for delivering a certain universality, as the color names
should comply with different cultures and human percep-
tions [2]. For example, they model the color membership to
a specific color name with fuzzy membership functions, they
associate color names with wavelength intervals according
2 EURASIP Journal on Image and Video Processing
to the physical color representation, or they use predefined
lookup tables. These methods are not completely automatic
and require the human intervention [3].
Another way to characterize the color perception is
through the sensation induced by the color. In this case, colors
are analyzed in relation with other colors. For example, Itten
in 1961 defined a first set of formal rules to quantify the per-
ception effects achieved by combining different colors. They
are known as the seven color contrast schemes: the contrast
of saturation, the contrast of light and dark, the contrast of
extension, the contrast of complements, simultaneous con-
trasts, the contrast of hue, and the contrast of warm and
cold [21]. Similarly, Birren later defined some color schemes
which induce particular visual effects, which he called color
harmony schemes, that is, the monochromatic principle, the
adjacent principle, or the complementarity principle [22].
Analyzing color relationships can also be done with the help
of color wheels. They are basically color spaces where several
elementary colors are arranged in a perceptually progressive
manner [14].
This paper tackles the issue of the automatic under-
standing of the color content of video material in the video
indexing task of the animated movies. The proposed ap-
proach uses a fuzzy-based system to derive meaningful sym-
bolic/semantic linguistic concepts from the movie’s color
content.
Very little research has been done in this field, especially
in the animated movie domain [6]. Many of the existing
color characterization methods have focused naturally on
the static image indexation task as they describe local image
properties. Most of them describe the image color content
with low-level parameters [4]. However, few methods try to
tackle the “semantic gap” issue and thus to capture the se-
mantic meaning of the color content. For example, in [14]
the color artistry concepts are extracted for the indexing task
of artwork static images. The relationships between colors
are analyzed in a perceptual color space, namely LCH (lu-
minosity, chroma, and hue), and several color techniques are
used: contrasting color schemes, Itten’s seven color contrasts,
and color harmony schemes. A similar approach is the query
by image content (QBIC) system proposed in [15]. It sup-
ports two types of syntactic color search: the dominant color
search and the color layout search where the user specifies an
arrangement of a color structure. However, these approaches
are applied to static images. The understanding of the color
content of a movie requires a temporal color analysis.
In the video indexing field, color content analysis, to-
gether with other low-level features, such as texture, shape,
and motion, has extensively been used for the low-level char-
acterization of the image local properties. Few approaches
tackle the description of the color perception of video ma-
terial by adding a temporal dimension to the local image-
based analysis. Such a system which takes the temporal color
information into account is proposed in [16]. The art im-
ages and commercials are analyzed at emotional and expres-
sional levels. Various features are used, not only the color
information but also motion, video transition distribution,
and so on, all in order to identify a set of primary induced
emotions, namely, action, relaxation, joy, and uneasiness.The
colors are analyzed at a region-based level by taking the spa-
tial relationships of the object in the image into account. The
proposed system is adapted to the semantic analysis of com-
mercials. Another connected approach is the one proposed in
[17], where fuzzy decision trees are used for data mining of
news video footage. In this case, color histograms are used to
successfully retrieve two types of semantic information: the
textual annotations and the presence of the journalist.
Our approach is different. We are addressing here the
problem of delivering a global color content characterization
of the animated movies. The proposed approach captures
the movie global color distribution with the global weighted
color histogram proposed in [8]. The color content percep-
tion is then analyzed at a symbolic level using color names
and the sensations induced by the colors. This global color
description is possible thanks to the peculiarity of the ani-
mated movies of containing specific color palettes [19], un-
like conventional movies which usually have the same color
distribution. The proposed approach is carried out in two
steps. The first one is the low-level analysis where the movie
color content gets represented with several global statistical
parameters retrieved from the movie global weighted color
histogram. The second step is the symbolic content repre-
sentation. The numerical parameters obtained with the first
step are converted into meaningful linguistic concepts using
a fuzzy rule system. They are mainly concerned with the pre-
dominant hues of the movie, some of Itten’s color contrasts
and harmony schemes, color relationships and color wealth.
Using a clustering approach, we are discussing the possibil-
ity of employing the proposed content descriptions to sort
animated movies according to color content.
The “International Animated Film Festival” [5], one of
the major events in the worldwide animated movies en-
tertainment, which has taken place in Annecy (France) ev-
ery year since 1960, stands as the applicative support of
our approach. Every year, hundreds of movies coming from
all over the world are competing. Some of these movies
are currently being digitized by the city of moving pictures
(CITIA), which is the organization managing the festival,
to compose a numerical animation movie database, soon
to be available online for general use (see Animaquid at
). Managing thousands of videos is a
tedious task. An automatic tool that allows artists or or-
dinary people to analyze or to access the movie content is
thus required. The existing tools, as is the case of CITIA, are
limited to use only the textual information provided by the
movie authors, that is movie title, artist name, short movie
abstracts, and so on. However, the available text information
does not totally apply to the rich artistic content of the ani-
mation movies. The artistic content is strongly related to the
visual information, which is poorly described with textual in-
formation. Deriving semantic or symbolic information from
the color concepts or the visual sensations induced by the
movie should be an ideal way of accessing its content in a
content-based retrieval system.
The paper is thus organized. Section 2 presents the pe-
culiarity of the animation domain. Section 3 presents the
general description of the proposed analysis system. In
Section 4, we discuss the movie temporal segmentation and
Bogdan Ionescu et al. 3
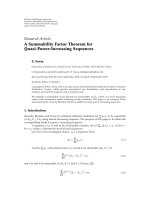
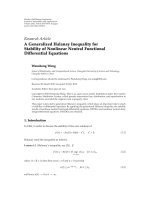
Figure 1: Animation techniques (from left to right): 3D synthesis, color salts, glass painting, object animation, paper drawing, and plasticine
modeling.
Animation movie
Movie segmentation
Abstraction
Color statistics
Fuzzy representation
Low semantic
level
High semantic
level
Apriori
knowledge
Fuzzy rule
set
Shot
1
Shot
2
··· Shot
i
··· Shot
m
Image
1
Image
2
··· Image
n
Statistical color parameters
Symbolic color description
Semantic color information
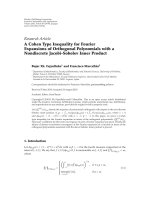
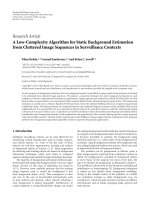
Figure 2: The diagram of the proposed symbolic color content characterization system.
abstraction. Section 5 deals with the color reduction issue.
The computation of the global weighted histogram is pre-
sented in Section 6 along with the low-level color content de-
scription. The semantic color characterization is achieved in
Section 7 using a fuzzy approach. In Section 8,severalexperi-
mental tests are conducted on an animation movies database.
Finally, the conclusions and future work are discussed in
Section 9.
2. ANIMATED MOVIES ARE PARTICULAR
Animated movies are different from conventional movies
and from cartoons in many respects. Some of them are pre-
sented below.
The animated movies from [5] are mainly fiction movies.
Typically the events do not follow a natural sequence: ob-
jects or characters emerge and vanish without respecting any
physical rule; the movements are not continuous; a lot of
color effects are used that is the “short color changes” [7];
artistic concepts are used: painting concepts, theatrical con-
cepts.
A lot of animation techniques are used: 3D synthesis, ob-
ject animation, paper drawing, plasticine modeling, and so
on. The movie color content gets thus related to the tech-
nique used (see Figure 1).
Animated movies have specific color palettes. Colors are
selected and mixed by the artists using various color artistry
concepts, all in order to express particular feelings or to in-
duce particular impressions such as contrast, depth, energy,
harmony, or warmth. Understanding the movie content is
sometimes a difficult task. Some animation experts say that
in the case of more than 30% of the animated movies from
[5], it is difficult for an amateur viewer, if not impossible, to
understand the movie’s story.
Therefore, the proposed analysis techniques should be
capable of dealing with all these constraints.
3. THE PROPOSED APPROACH
The proposed color characterization approach exploits the
peculiarity of the animation movies of containing specific
color palettes. It uses several analysis steps which are de-
scribed in Figure 2.
First, the movie is divided into shots by detecting the
video transitions, namely, cuts, fades, dissolves, and an ani-
mated movie specific color effect called “short color change”
or SCC [7]. A movie abstract is composed by retaining a per-
centage of each shot frame.
4 EURASIP Journal on Image and Video Processing
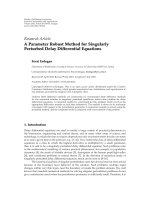
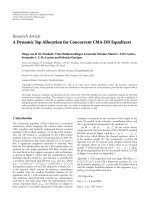
Figure 3: Several frames from two SCCs, movie “Francois le Vaillant.”
After color reducing of the frames of the movie ab-
stract, we capture the movie global color distribution with
the global weighted color histogram proposed in [8]. The
color content is further described with several statistical pa-
rameters which are to be computed on the global histogram,
that is, light, dark, warm, cold color ratios.
Meaningful symbolic/semantic color information is ex-
tracted from the statistical color information using a fuzzy
representation approach which uses a priori knowledge from
the animated movies domain. The proposed characteriza-
tions concern some of Itten’s color contrasts [21] and color
harmony schemes [22], which are to be found in the ani-
mated movies. In the sequel of the paper, we will describe
each of the processing steps.
4. TEMPORAL SEGMENTATION AND ABSTRACTION
The temporal segmentation of the movie is a basic processing
step required by most of the higher-level video analysis tech-
niques. The movie is divided into shots, which means detect-
ing the video transitions [23]. We detect the sharp transitions,
or cuts, using a specially tuned histogram-based algorithm
[7] adapted to the peculiarity of the animated movies. From
the existing gradual transitions we detect only the fades and
the dissolves as they are the most frequent gradual transitions.
The detection is performed using a pixel-level statistical ap-
proach [9].
In addition, using a modified camera flash detector [7]
we detect an animation movie specific color effect named
“short color change” or SCC. An SCC stands for a “short-
in-time dramatic color change”, such as explosion, lightning,
and short color effect (see Figure 3). Generally SCCs do not
produce a shot change but unfortunately are, by mistake, de-
tected as cuts. Detecting the SCCs allows us to reduce the cut
detection false positives.
The video shots are further determined by considering
the video segments limited by the detected video transitions.
Less relevant frames (e.g., the black frames between fade-out
and fade-in transitions, the dissolves transition frames, etc.)
are to be removed as they do not contain meaningful color
information.
To reduce the movie temporal redundancy and thus the
computational cost, the movie is substituted with a movie ab-
stract which is automatically generated by retaining some key
frames for each video shot. As action most likely takes place
in the middle of the shot, key frames are extracted as consec-
utive frames near the middle of the shot. The achieved frame
sequence is centered on the middle of the shot and it contains
p% of its frames. In this way, more details will be captured for
the longer shots as they contain more color information (the
choice of the p-value is discussed later in Section 6.1). This
video abstract will stand as the basis for all further process-
ing steps.
5. COLOR REDUCTION
Working with true color video frames requires processing 16
million color palettes which makes the color analysis task
very difficult (i.e., computing color histograms). To over-
come this problem typically a color reduction step is adopted.
The color reduction techniques aim at reducing the number
of colors without or with minimal visual loss. Depending on
the application, a compromise between the visual quality and
the execution time should be considered. In our case, the suc-
cess of the reduction step is crucial for the relevance of the
proposed content descriptions.
Generally, color image quantization involves two steps:
palette design and pixel mapping. There are two general
classes of quantization methods: fixed (using a universal pre-
defined palette) and adaptive (using a customized palette)
[13]. Fixed palette quantization is very fast, but sacrifices the
quantization quality which is related to the size and color
richness of the palette. On the contrary, the adaptive quan-
tization determines an optimum set of representative colors
for each image [25].
In our application, the color reduction method should
first provide an accurate representation of the initial colors,
ideally without color distortion, all in order to preserve the
visual perception of the original image. The best color repro-
duction is achieved using an adaptive color reduction that
determines the optimum palette for each frame. However,
this operation is time consuming and in this way each image
gets represented with a specific color palette. As a result, the
total number of colors used to represent the color distribu-
tion of the entire movie will be high and will contain unno-
ticeable and undesired small variations of the same elemen-
tary colors. Comparing the color distribution of different
movies will in this case be inaccurate and diffi
cult [18, 26].
On the other hand, the animated movies have the advantage
of using reduced color palettes (see Figure 1) hence allowing
us to reduce the quantization quality loss which occurs in the
case of the use of a fixed quantization approach.
Describing the color techniques used by the movie re-
quires to analyze the human perception. One simple way is
the use of the color names. Associating names with colors al-
lows everyone to create a mental image of a given color. A
fixed-color palette approach simplifies this task as the prede-
fined palette could be composed of colors for which a color
naming system is available [2]. On the contrary, an adap-
tive palette cannot be manually designed, being automati-
cally determined for colors for which a textual description
is not available.
Bogdan Ionescu et al. 5
Color content characterization also requires to analyze
the perceptual relationship between colors. One simple and
efficient way is the use of the artwork color wheels [22].
Several color wheels have been proposed in the past: Runge
(1810), Chevreul (1864), Hering (1880), Itten (1960), and so
on. A color wheel is essentially a specifically tuned color space
whose topological arrangement exhibits relationships articu-
lated according to the theory of color contrast and harmony
[14]. Its particular arrangement of primary colors allows us
to define some perceptual color relations, such as adjacency
(e.g., neighboring colors on the wheel) and complementarity
(opposite colors on the wheel) relations (see Figure 4(a)). A
predefined color palette is the best match for this task as it
can be designed with respect to one of the existing artwork
color wheels.
In conclusion, the use of a fixed predefined palette quan-
tization should in our case be the best compromise between
visual quality and computational cost. In addition, this ap-
proach will make the color comparison task required in a
video indexing system easier. The quality of the color reduc-
tion will now depend on the quality of the used color palette,
therefore the choice of the palette is conclusive for the success
of our approach.
Several color palettes satisfying more or less the require-
ments of our approach have been analyzed, that is, Chevreul’s
color wheel, Hering’s color palette, the Gretag Macbeth color
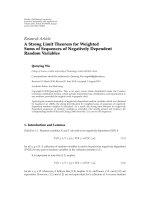
checker, Itten’s color wheel, and the Webmaster palette. We
found that the Webmaster nondithering 216 color palette
[27] (see Figure 4) is the only palette meeting to all the pre-
viously listed requirements, thus providing the following:
(i) the right compromise between color richness and
number of colors (216): it contains 12 elementary col-
ors, namely: orange, red, pink, magenta, violet, blue,
azure, cyan, teal, green, spring, and yellow, and 6gray
levels including white and black, well suited for repre-
senting the reduced color palettes of animated movies;
(ii) high color diversity: variations of 12 elementary colors
and 6 gray levels, resulting in reduced color distortion;
(iii) the availability of an efficient color naming system:
each color is named according to the degree of hue,
saturation, and brightness, facilitating the analysis of
the human color perception. An example is depicted
in Ta ble 1;
(iv) the analogy with Itten’s color wheel: elementary colors
are arranged on a wheel with respect to Itten’s percep-
tual color relations (see Figure 4).
Concerning the pixel mapping technique, we have de-
cided to use Floyd-Steinberg’s error diffusion filter [20]ap-
plied on the XYZ color space [25]. First, the colors are se-
lected in the Lab color space from the Webmaster color
palette using the minimum Euclidean distance criterion. We
use the Lab color space because it is a perceptually uniform
color space, thus the Euclidean distance between colors is
highly related to the perceptual distance. Then, the color ap-
proximation error is propagated using the Floyd-Stenberg’s
filter mask applied on the XYZ color space.
Table 1: Color naming examples from the Webmaster palette.
Color R, G, B Color name
255, 255, 51 “Light hard yellow”
204, 0, 102 “Dark hard pink”
204, 204, 204 “Pale gray”
Adjacent colors
Complementary colors
War m
colors
Cold
colors
(a)
B
A
(b)
Figure 4: The predefined color palette: (a) Itten’s color wheel, (b)
Webmaster color palette [27] (zone A contains variations of an ele-
mentary color, i.e., violet, and the zone B contains elementary color
mixtures).
6. LOW-LEVEL STATISTICAL COLOR PARAMETERS
The first step towards the color content description is the
computation of several statistical color parameters. To de-
termine which color properties we should capture with the
low-level parameters, first we have manually analyzed a large
amount of animated movies from [5]. As each movie uses a
specific color palette, the global color histogram and the ele-
mentary color histogram are naturally the best candidates to
describe the color content. Color intensity, saturation, and
warmth are also important color features of the animated
movies. They allow us to make the distinction between dif-
ferent movie types or genres. For instance, the movies using
the plasticine modeling as animation technique use typically
dark cold color palettes (see Section 8). Other important pa-
rameters which are related to color richness are the color
variation and diversity. For example, funny movies generally
come with a high color diversity or a pastel color palette. Fi-
nally, color relationships are useful to make the distinction
between movies using different color techniques like analo-
gous color schemes, complementary color schemes, and so
on (see also Section 8).
6.1. Color histograms
First, the movie global color distribution is captured with the
global weighted color histogram, h
GW
(), proposed in [19]. It
is defined as the weighted sum of the movie shot color his-
tograms, thus
h
GW
(c) =
M
i=0
1
N
i
N
i
j=0
h
j
shot
i
(c)
·
w
i
,(1)
6 EURASIP Journal on Image and Video Processing
where M is the total number of video shots, N
i
is the total
number of the retained frames for the shot i (representing
p% of its frames), h
j
shot
i
() is the color histogram of the frame
j from the shot i, c
∈{0, , 215} is the color index from the
Webmaster palette, and w
i
is the weight of the shot i. A shot
weight is defined as
w
i
=
N
shot
i
N
total
(2)
with N
shot
i
the total number of frames of the shot i and N
total
is the total number of frames of all the movie shots. The
longer the shot, the more important the contribution of its
histogram to the movie’s global histogram.
The h
GW
()-values are related to the color apparition per-
centage in the movie and they are normalized with respect to
1 (frequency of occurrence of 100%). Moreover, the values
of p%, representing the percentage of the retained frames
for a given shot, affect the accuracy of the obtained global
color histogram and thus the color characterization. Taking
p
∈ [15%, 20%] has proven to be a good compromise be-
tween the achieved processing time and the quality of the
obtained color representation [8]. The quality of the color
representation drastically decreased only when, owing to the
reduced percentage of the retained images, some shots did
not even get represented in the global histogram. This is the
case of p
= 1% where very short shots (less than 4 seconds)
are not represented by any image.
Another important color feature of the animated movies
is the elementary color distribution. Using h
GW
() the elemen-
tary color histogram, h
E
(), is defined as
h
E
(c
e
) =
215
c=0
h
GW
(c)|
Name(c
e
)⊂Name(c)
,(3)
where c
e
is an elementary color index from the elementary
colors set, Γ
elem
, of the Webmaster palette, with Γ
elem
=
{
“orange,” “red,” “pink,” “magenta,” “violet,” “blue,” “azure,”
“c y an,” “teal ,” “g r een,” “spring ,” “ y e llow,” “gray,” “white,”
“black”
}, c is a color index from the Webmaster palette, and
Name(c) is the operator which returns the color c name from
the palette dictionary.
Each available color of the used color palette is pro-
jected in h
E
() on to its elementary hue, therefore disregard-
ing the saturation and intensity information. This mecha-
nism makes h
E
() invariant to the variations of the same hue.
For example, a dark red and a bright red are getting repre-
sented in h
E
() with the same elementary color, which is red.
Computing h
E
() from the movie global weighted histogram,
h
GW
(), ensures that its values correspond to the apparition
percentage of the elementary colors in the movie.
6.2. Global weighted histogram color statistics
Using the global weighted color histogram, h
GW
(), several
statistical low-level color parameters are further proposed.
They concern the color richness, color intensity, color sat-
uration, and color warmth.
The first parameter, called the color variation ratio, P
var
,
reflects the amount of the significant movie colors and it is
defined thus as
P
var
=
Card
c | h
GW
(c) > 0.01
216
,(4)
where c
∈{0, , 215} is a color index from the Webmaster
palette, Card() is the cardinal function which returns the size
of a data set. The threshold value 0.01 was empirically deter-
mined after analyzing several animation movies. Therefore, a
color of index c is considered to be significant for the movie
global color distribution if it has a frequency of occurrence
of more than 1%.
The next parameter is related to the color intensity: the
light color ratio, P
light
, reflects the amount of bright colors in
the movie. The brightness is reflected in the color names with
the words: “light”, “pale,” or “white” (white corresponds to the
highest brightness level). Thus, P
light
is defined thus as
P
light
=
215
c=0
h
GW
(c)|
W
light
⊂Name(c)
,(5)
where c is a color index with the property that its name, re-
turned by Name(), contains the word W
light
,withW
light
∈
{
“light,” “pale,” or “white”}.
Using the same reasoning, we define the following low-
level color parameters. Opposite P
light
is thedarkcolorratio
parameter, P
dark
, which reflects the amount of dark colors in
the movie. The darkness is reflected in the color names with
words like “dark,” “obscure,” or “black” (black reflects the low-
est brightness level).
Thehardcolorratioparameter, P
hard
, reflects the amount
of high/mean saturated colors (or hard colors) in the movie.
The high saturation is reflected in color names with words
like “hard” or “faded”. In this case the 12 elementary colors,
designated with Γ
elem
, are also to be considered as hard col-
ors, being defined as 100% saturated colors. Theweakcolor
ratio parameter, P
weak
,oppositeP
hard
, reflects the amount of
low saturated colors (or weak colors) in the movie. The low
saturation is reflected in color names with words like “dull”
or “weak”.
Thewarmcolorratioparameter, P
warm
, reflects the
amount of warm colors in the movie. In art, some hues are
commonly perceived to exhibit some levels of warmth. “Yel-
l ow,” “orang e ,” “r e d,” “ yellow - orange ,” “r e d -oran g e ,” “r ed-
violet,” “magenta,” “pink,” and “spring” are the warm color
names. On Itten’s color wheel the warm colors are distributed
on one half of the wheel, starting with spring, continuing
with yellow, and ending with magenta (see Figure 4). Op-
posite P
warm
is the cold color ratio parameter, P
cold
,which
reflects the amount of cold colors in the movie. “Green,”
“blue,” “violet,” “yellow-green,” “blue-green,” “blue-violet,”
“teal,” “cyan,” and “azure” are the cold color names. On It-
ten’s color wheel, unlike warm colors, the cold colors are dis-
tributed on the other half of the wheel, starting with violet,
continuing with blue, and ending with green (see Figure 4).
Bogdan Ionescu et al. 7
6.3. Elementary histogram color statistics
The next color parameters are computed from the elemen-
tary color histogram. The first parameter, called color diver-
sity ratio, P
div
, is related to the richness of color hues. It is
defined as the amount of the movie’s significant elementary
colors, thus
P
div
=
Card
c
e
| h
E
c
e
> 0.04
13
,(6)
where c
e
is an elementary color index from Γ
elem
(see (3)),
with c
e
∈{0, ,12} (12 elementary colors and gray, where
white and black are to be considered as gray levels in this
case). The threshold value 0.04 was empirically determined.
Similar to the computation of P
var
(see (4)), an elementary
color is considered to be significant for the movie global ele-
mentary color distribution if it has a frequency of occurence
of more than 4%.
The next two color parameters are related to the concept
of color perceptual relation, namely the adjacency and com-
plementarity relations. The complementarity relation refers
to the complementary relationship of hues. Using Itten’s
color wheel, a straight line drawn across the center of the
wheel is used to derive complementary color pairs. On the
other hand, the adjace nt colors (analogous) are defined as
neighborhood pairs of colors (see Figure 4).
The adjacent color ratio parameter, P
adj
, reflects the
amount of adjacent colors contained with the movie’s ele-
mentary color distribution, thus
P
adj
=
Card
c
e
| Adj
c
e
, c
e
= True
2 · N
c
e
,(7)
where c
e
/
= c
e
are the indexes of two significant elementary
colors from the movie, Adj(c
e
, c
e
) is the adjacency operator
returning the true value if the two colors are analogous on
Itten’s color wheel, and N
c
e
is the movie’s total number of
significant elementary colors. Using the same reasoning, we
define the complementary color ratio, P
compl
, as the amount of
complementary colors contained with the movie’s elemen-
tary color distribution.
7. FUZZY SEMANTIC COLO R DESCRIPTION
The previously proposed statistical color parameters are used
further to extract higher-level semantic color information re-
garding the movie color perception. The approach we use is
a linguistic representation of data using fuzzy sets [19].
The interest in using fuzzy sets instead of crisp sets is
multiple. The most important advantage of the fuzzy sets is
that they allow to represent the numerical low-level infor-
mation (in our case the statistical low-level parameters) in
a human-like manner using linguistic concepts [33]. Another
advantage is that the fuzzy sets are based on the concept of
uncertainty and better respect the reality which is uncertain.
The fuzzy mechanism is similar to the way the human brain
is functioning.Humansperceivetherealworldinanapprox-
imative way. For example, instead of describing the height
of a person in centimeters, we say that he is tall, medium,
small, and so on. Thus, the fuzzy representation captures the
semantics of data. The fuzzy sets are also universal approxi-
mators. The discussion universe which could be very vast or
even infinite is converted using the fuzzy representation into
a limited number of concepts [34]. Thus, using fuzzy infor-
mation, instead of statistical data (i.e., low-level parameters)
for content-based semantic indexing improves the informa-
tion retrieval performance as presented in [41].
To achieve the proposed semantic color content charac-
terization, several linguistic concepts are associated to the
numeric low-level parameters by defining the fuzzy member-
ship functions. This first level is a symbolic level. Then, using
a fuzzy rule base meaningful information is derived from the
movie color techniques, which constitute the semantic level
of description. The mechanism is described in the following
sections.
7.1. Symbolic description
The symbolic color description is achieved by associating a
linguistic concept to each of the proposed low-level color pa-
rameters. Each concept is then described with several fuzzy
symbols. The fuzzy meaning of each symbol is given by its
membership function. These functions are defined in a con-
ventional way using piecewise linear functions [35] which are
well adapted to the linear variations of our parameters. The
initial definition of the membership functions is based on the
expert knowledge in the field and the observation of exper-
imental data (the manual analysis of several representative
animated movies). This mechanism makes sure that the hu-
man perception will be captured with the proposed symbols.
Therefore, the light color content linguistic concept is as-
sociated with the P
light
parameter which is related to the
amount of bright colors in the movie. The concept is de-
scribed using three symbols: “low-light color content,” “mean-
light color conte nt,” and “high-light color content”. After ana-
lyzing several representative animated movies, we found that
a movie may have a color distribution “poor-in-light colors”
(degree of truth of 1) if 100
· P
light
< 33%, a color distribu-
tion with “a medium amount of light colors” (degree of truth
of 1) if 100
· P
light
> 50% and 100· P
light
< 60%, and finally, a
color distribution “containing high amounts of br ight colors”
(degree of truth of 1) if 100
· P
light
> 66%. Based on these
considerations, the membership functions of the light color
content concept, namely, μ
LC
low
, μ
LC
mean
,andμ
LC
high
,havebeen
designed using the thresholds t1
= 33, t2 = 50, t3 = 60, and
t4
= 66, as depicted in Figure 5(a).
The following linguistic concepts (see Table 2)describe
color properties in terms of color hue, saturation, intensity,
richness, and relationship. Their membership functions are
defined using the same reasoning as for the light color-content
concept [42]. A particular case are the linguistic concepts de-
scribing color relationship, namely the adjace nt colors and
complementary colors concepts.
In this case, the two concepts are represented with
only two symbols, that is “yes” and “no”, meaning that
the movie color distribution either uses or not uses ad-
jacent/complementary colors. The expertise of the domain
proved that in this case using only two symbols is sufficient
8 EURASIP Journal on Image and Video Processing
Low Mean High
100.P
light
0
0.2
0.4
0.6
0.8
1
0 102030405060708090100
t1 t2 t3 t4
(a) μ
LC
low
(blue), μ
LC
mean
(red), μ
LC
high
(green)
No Yes
100.P
compl.
0
0.2
0.4
0.6
0.8
1
0 102030405060708090100
tn ty
(b) μ
C
no
(blue), μ
C
yes
(green)
Figure 5: Examples of fuzzy partitions for (a) the light color-content concept, (b) the complementary color concept.
Table 2: Linguistic fuzzy concepts.
Parameter Linguistic concept Connotation
P
dark
Dark color content Describes the amount of dark colors
P
hard
Hard color content Describes the amount of saturated colors
P
weak
Weak color content Describes the amount of weak saturated colors
P
warm
Warm color content Describes the amount of warm colors
P
cold
Cold color content Describes the amount of cold colors
P
var
Color variation Describes color wealth
P
div
Color diversity Describes color richness in terms of elementary colors
P
adj
Adjacent colors Describes color relationship of adjacence
P
compl
Complementary colors Describes color relationship of complementarity
for describing the color content. The fuzzy membership
functions, μ
A
d
and μ
C
d
,whered ∈{“yes”, “no”},arede-
signed using two thresholds, namely, tn
= 33 and ty = 66
as presented in Figure 5(b). Therefore, the movie colors are
adjacent/complementary (degree of truth of 1) if more than
66% are adjacent/complementary and are not (degree of
truth of 1) if less than 33% are adjacent/complementary.
7.2. Semantic description
New higher-level linguistic concepts are built using a fuzzy
rule base [40]. The fuzzy descriptions of the new symbols are
obtained by a unifor m mechanism according to the combi-
nation/projection principle using conjunction operators for
the generalized modus ponens (i.e., the min() operator [28]).
The proposed new semantic descriptions concern some of It-
ten’s color contrasts [21] and harmony schemes [22], which
are to be found in the animation movies. The rule base
was designed using expert knowledge and as experimental
data the manual analysis of several representative animated
movies (see Section 8.1).
The first rule base regards the color intensity and it is de-
picted in Figure 6. Each new symbol is determined using the
generalized modus ponens. For instance, the new member-
ship function of the new semantic color description “there is
a light-dark cont rast” is given by
μ
cont.L−D
P
light
, P
dark
= min
μ
LC
mean
P
light
, μ
DC
mean
P
dark
,
(8)
where μ
LC
mean
and μ
DC
mean
are the membership functions of
the symbols “mean light color content” and “mean dark color
content” and the conjunction AND operator is in this case
the min() function. Several other operators have been tested,
namely probabilistic, Lukasiewicz, and Weber, which eventu-
ally concluded to similar results. In those cases where a rele-
vant color characterization is not possible, we output the “no
description available” (NDA) symbol.
We use the same reasoning to define rule bases for gen-
erating new linguistic concepts describing color saturation:
“weak colors are predominant,” “saturated colors are predom-
inant,” “there is a saturation contrast” and color warmth:
“warm colors are predominant”, “cold colors are predominant”,
“there is a warm-cold contrast”. The rule base describing
color relationships is slightly different as each linguistic con-
cept has only two symbols. The new linguistic symbols are
“adjacent colors are predominant”, “complementary colors are
predominant”, “there is an adjacent-complementary contrast”.
The mechanism is depicted in Figure 6.
The interest in the proposed color content descriptions
is twofold. First, we provide the animation experts or other
people with detailed symbolic descriptions of the movie
color content. This is valuable for the analysis and evaluation
of the competing movies in the context of the International
Animated Film Festival [5]. On the other hand, the proposed
descriptions could be used for the automatic content-based
indexing of animated movie databases as it is the case of
CITIA [5]. Using the proposed content descriptions movies
could be retrieved in a human-like manner according to their
color content.
Bogdan Ionescu et al. 9
P
light
P
dark
Low
Mean
High
Low
Mean
High
Rule 1
Rule 2
Rule 3
Rule 4
Rule 5
AND
“Dark colors are predominant”
NDA
“There is a light-dark contrast”
NDA
“Light colors are predominant”
(a)
P
adj.
P
compl.
No
Ye s
No
Ye s
Rule 1
Rule 2
Rule 3
Rule 4
AND
“Complementary colors
are predominant”
“There is an adjacent-
complementary contrast”
“Ad j a ce nt co lo r s
are predominant”
NDA
(b)
Figure 6: Fuzzy rule bases (NDA stands for “no description available”): (a) color intensity description, (b) color relationship description.
#1
#2
#3
#4
10%
0
19%
0
11%
0
19%
0
Several frames Global weighted histograms (h
GW
)Elementarycolors(h
E
)
Figure 7: Color histograms (p = 15%, see (1)).
8. EXPERIMENTAL RESULTS
The proposed approach has been tested on an animated
movie database from CITIA [5] and Folimage Company
[24]. It consists of 52 short animated movies using a large
diversity of animation techniques (total time of 6 hours and
7minutes).
First of all, we are presenting and discussing the color
content linguistic descriptions achieved for several represen-
tative animated movies. Secondly, a clustering test is con-
ducted on the animated movie database to analyze the dis-
criminative potential of the proposed color descriptions in
the automatic indexing task. Finally, we are discussing the
design of a similarity measure which could make the movie
content comparison issue easier.
The evaluation of our approach was confronted with the
problem of the strong subjectivity of such a type of content
descriptions. In this case, the evaluation is entirely related
to the human perception. Different people may perceive the
same movie contents in a very different way which makes the
evaluation task a very subjective one. Moreover, there is no
groundtruth available for this task to compute the conven-
tional evaluation measures such as the precision and recall
ratios [7]. To overcome all these issues we have substituted
the groundtruth with all the available color content infor-
mation retrieved from the CITIA Animaquid textual-based
search engine (i.e., movie synopsis (textual abstracts), techni-
cal information, animation technique, content descriptions,
etc.). Using all these pieces of information together with the
manual analysis of the movie content, provided by anima-
tion experts as well as by image processing experts, we have
performed the validation of the results.
8.1. Color content linguistic descriptions
In this section, we are presenting the color content descrip-
tions achieved for four representative animation movies,
namely,
1“Casa”(6minutes,5seconds),2 “Le Moine et
le Poisson” (6 minutes),
3“CircuitMarine”(5minutes,35
seconds), and
4 “Francois le Vaillant” (8 minutes, 56 sec-
onds) [24] (see Figure 7).
The obtained global weighted color histograms, h
GW
(), and
elementary color histograms, h
E
(), (see Section 6.1)arede-
picted in Figure 7. The global weighted color histograms are
depicted using column graphs. The oX axis corresponds to
the color index from the Webmaster 216 color palette. Col-
ors are presented as they appear in the Webmaster palette.
The oY axis represents the color frequency (only significant
colors are shown, i.e., frequency of occurrence of more than
1%). The elementary color histograms are represented us-
ing pie charts. The movie’s actual colors have been formally
replaced by 100% saturated elementary colors as in the ele-
mentary color histogram color saturation and intensity are
not considered (see (3)).
10 EURASIP Journal on Image and Video Processing
0
10
20
30
40
50
60
Orange
Red
Pink
Magenta
Violet
Blue
Azure
Cyan
Te a l
Green
Spring
Ye l l o w
Gray
White
Black
Casa
Le Moine et le Poisson
Circuit marine
Franc¸ois le Vaillant
Figure 8: A comparison of the significant elementary colors for the
tested movies.
In Figure 8 we present the achieved elementary color dis-
tributions for the four tested movies (only significant ele-
mentary colors are represented, i.e., frequency of occurrence
of more than 2%).
After the manual analysis of the results we found that
the proposed elementary color histogram provides an accu-
rate color content description of the movie. For the movie
“Casa,” we have found 7 elementary colors from existing 6;
in the movie “Le Moine et le Poisson,” we found 7 elemen-
tary colors from existing 5; in the movie “Circuit Marine,”
we found 9 elementary colors from existing 8; in the movie
“FrancoisleVaillant,”wefound10elementarycolorsfrom
existing 8. The difference with the actual number of elemen-
tary colors and the detected ones comes from the fact that in
reality movies use color mixtures which leave the impression
of primary colors.
The symbolic color descriptions of the four movies are
presented with Ta ble 3 (see Section 7.1), while the semantic
color descriptions are presented with Table 4 (they are ob-
tained using min() function as fuzzy AND conjunction, see
Section 7.2). The numbers presented represent the fuzzy de-
grees and NDA stands for “no description available”.
Compared with the reality, the proposed descriptions are
to be found very relevant for the color content. The movie
“Casa” uses a predominance of orange/red which is con-
trasted by a monochromatic color which is gray or black.
Thus, the colors are warm, bothlight and dark, and we per-
ceive a light-dark contrast. The colors are more adjacent than
complementary. In what concerns the color wealth, the color
variation and diversity are average as approximatively half of
the available colors are being used.
The movie “Le Moine et le Poisson” uses the same color
technique as the previous movie “Casa”. It presents the pre-
dominance of a main hue, which is “yellow” in this case, con-
trasted with the presence of a monochromatic color which is
“black”. Thus, as in the previous case the colors are mainly
warm, both light and dark, and there is a light-dark contrast.
As “yellow” is used more than 60%, the colors are only adja-
cent. The movie uses paper painting with Gouache India ink
as animation technique, which makes the colors diluted and
thus low saturated. The color variation and diversity are also
average.
The movie “Circuit Marine” uses an important number
of colors (142 from the total of 216 available from the Web-
master palette), thus the color variation is high. In terms of
elementary colors, the color diversity is average. The movie
does not have a predominance of a certain color warmth or
saturation but instead it uses cold colors, warm colors, and
saturated colors in small amounts. The colors are both adja-
cent and complementary.
Finally, the movie “Francois le Vaillant” uses high
amounts of “blue,” thus the predominant colors are cold col-
ors. Moreover, the colors are mainly dark colors. The colors
are also both adjacent and complementary. In what concerns
the color richness, the movie uses 187 colors from the 216
available from the Webmaster palette, thus there is a high
color variation. On the other hand, as only one hue is pre-
dominant, the elementary color diversity is reduced.
Compared to the conventional boolean logic, fuzzy logic
provides more accurate content description. The boolean
logic uses decision rules which return only one degree of
truth, namely True (1) of False (0). This typically requires
the definition of only one threshold. To compare the re-
sults achieved with the proposed fuzzy approach to the ones
obtained in the conventional way using boolean logic, we
have constructed similar decision rules (see Section 7.2). The
boolean rules have the following pattern:
if (100
· P
prop
>t
bool
), then “prop colors are predominant”
(9)
with t
bool
the decision threshold (in our case t
bool
= 66%)
and P
prop
a low-level parameter (see Section 6).
After testing several animated movies from CITIA [5],
we found that the fuzzy rules present many advantages. First
of all, boolean logic leads to false descriptions when the P
prop
valueisclosetot
bool
while the fuzzy description provides a
degree of truth, for example, for the movie “Tamer of Wild
Horse”, P
dark
= 0.657, in boolean logic: “dark colors are pre-
dominant” (degree of truth of 0), while in fuzzy logic “weak
colors are predominant” (degree of truth of 0.9) or movie
“Casa”, P
weak
= 0.612, in boolean logic “weak colors are pre-
dominant” (0), while in fuzzy logic “weak colors are predom-
inant” (0.3). Secondly, with boolean logic important infor-
mation is disregarded, for example in the movie “Le Moine
et le Poisson”, P
light
= 0.489 and P
dark
= 0.511, in boolean
logic: “light colors are predominant” (0) and “dark colors
are predominant” (0) while in fuzzy logic there is a “mean
light color content” (0.9) and “mean dark color content” (1)
and moreover the joint analysis of the two provide the best
description which is “there is a ‘light-dark contrast’ ” (0.9).
Finally, there are some situations where a relevant descrip-
tion is missing . In such cases, boolean logic fails by provid-
ing a degree of truth, for example in the movie “Amerlock,”
P
warm
= 0.3andP
cold
= 0.59, in boolean logic “warm colors
are predominant” (0) and “cold colors are predominant” (0),
while in fuzzy logic “no description is available”. The descrip-
tion provided with fuzzy logic is more accurate as we cannot
say for sure if there is, or if there is not, a predominance of
warm or cold colors.
However, the proposed approach tends to fail when ow-
ing to some animation techniques, that is crayon drawing,
conventional paper drawing, in the color distribution there
Bogdan Ionescu et al. 11
Table 3: Symbolic color description.
Light Dark Hard Weak Warm Cold Var Div Adj Compl
1 Mean/0.9 Mean/1 Low/1 Mean/0.7 High/1 Low/1 Mean/0.7 Mean/1 Yes/1 Yes/0.8
2 Mean/0.9 Mean/1 Low/1 High/1 High/1 Low/1 Mean/1 Mean/1 Yes/1 No/0.7
3 Mean/1 Mean/1 Low/1 Mean/1 Low/0.9 Low/1 High/1 Mean/1 Yes/1 Yes/1
4 Low/1 High/1 Low/1 Low/0.9 Low/1 High/0.9 High/1 Low/0.8 Yes/1 Yes/1
Cluster silhouettes
Silhouette value
5
4
3
2
1
Cluster
00.20.40.60.81
(a)
Cluster repartition
40
20
0
−20
−40
−60
Cluster 1
Cluster 2
Cluster 3
Cluster 4
Cluster 5
−60
−40
−20
0
20
40
60
−100
0
100
(b)
Figure 9: Classification in terms of predominant hues (the data repartition is displayed using the first three principal components).
Table 4: Semantic color description.
Symbol/fuzzy degree 1 2 3 4
Dark colors are predominant 0 0 0 1
Light colors are predominant 0 0 0 0
There is a light-dark contrast 0.9 0.9 1 0
Weak colors are predominant 0.3 1 NDA NDA
Saturated colors are predominant 0 0 NDA NDA
There is a saturation contrast 0 0 NDA NDA
Warm colors are predominant 1 1 NDA 0
Cold colors are predominant 0 0 NDA 0.9
There is a warm-cold contrast 0 0 NDA 0
Adjacent colors are predominant 0.2 0.7 0 0
Complementary colors are predominant 0 0 0 0
There is a adjacent-complementary contrast 0.8 0.3 1 1
are high amounts of gray. The presence of “gray” in the movie
is hardly noticeable for the human observer as it is responsi-
ble only for edges, pencil traces, object contours, and so on.
This causes the real color content to be poorly represented
with the color histograms and thus resulting in an unreliable
or poor content characterization (see movie “Circuit Ma-
rine” which contains “gray” 31%).
8.2. Automatic clustering of animated movies
We are addressing here the content-retrieval issue of the
animated movies in the framework of developing an auto-
matic indexing system. The proposed content descriptions
were used in several unsupervised clustering tests in the at-
tempt of extracting knowledge from the animated movie
database. The goal is to determine whether the proposed se-
mantic/symbolic color content descriptions are discrimina-
tive enough to retrieve movies according to their color con-
tent. We present here our first attempts in this direction.
The clustering of the movies was performed using a k-
means unsuper vised clustering method due to its efficiency in
terms of the reduced computational time and the good qual-
ity of the results [29]. To overcome the problem of k-means
reaching local minimum solutions, the clustering is repeated
several times (i.e., 10 iterations in our case) and the final so-
lution is the one with the lowest total sum of distances, over
all replicates. As distance measure, the Euclidean distance is
used. It proved to be a good compromise between the cluster
delimitation and homogeneity and the computational cost.
The number N of relevant movie clusters is entirely related
to the used movie database. The high diversity of the avail-
able movies makes it difficult to a priori determine the right
value for N. Therefore, several experiments were performed
for different values of N.
12 EURASIP Journal on Image and Video Processing
“Circuit marine”
Red (22%) and blue (13%)
“Gazoon”
Yellow/orange (68%) and Green (14%)
Cluster 4:
yellow/orange
Cluster 1:
green
Cluster 3:
blue
“At the end of the earth”
Blue (64%)
“Petite escapade”
Gray/black (94%)
Cluster 5:
gray/black
Cluster 2:
red/maroon
“The breath”
Green (73%)
“Le Moine et le Poisson”
Yellow (60%)
Figure 10: A 2D projection of the 3D data space of the classified data from Figure 9 (the clusters were manually delimitated with the color
line for visualization purpose).
The validation of the results was performed using the
manual analysis of the cluster silhouettes and object repar-
tition. A silhouette is defined as a graphic plot which displays
a measure of how close each object in one cluster is to ob-
jects in the neighboring clusters (see Figure 9). The silhou-
ette measure ranges from +1 (maximum distance), through
0, to
−1 indicating points that are probably assigned to the
wrong cluster [30]. To overcome the difficulty of visualizing
and thus analyzing n-order data sets, with n>3, which is
the case of the clustering data, we use the principal compo-
nent analysis or PCA [31] to decorrelate the data. The inter-
pretation of the results is thus performed by analyzing the
plotting of only the first three principal components, as they
account for as much of the variability in the data as possible.
We present several experimental results here after.
8.2.1. Classification in terms of predominant colors
As we already discussed, each animated movie uses a spe-
cific color palette (see Section 8.1) which contains a reduced
number of elementary hues. The richness of the elementary
color palette is related to the movie artistic content and an-
imation technique (see movies “Casa” and “Le Moine et le
Poisson” in Section 8.1). For instance, a funny movie will
typically use pastel colors, a sad movie will use mainly cold
colors and a reduced number of hues, while a retro movie is
restricted to use only gray levels. The interest in the elemen-
tary color distribution is twofold. First, retrieving movies ac-
cording to their elementary color distribution in correlation
with other color properties will grant the user access to the
color content at a perceptual level. Second, it will allow to
recognize different copies of the same movie (i.e., digitized
in different conditions or using different color settings). The
same movie replicates but with different illumination and/or
saturation conditions will be represented with the same ele-
mentary histogram.
In this test, we attempt to retrieve the animated movies
according to their color similarities. The ideal color param-
eter for our classification task is the elementary color his-
togram, h
E
(), defined in (3), which captures the movie global
elementary color distribution by only taking the hue infor-
mation into account.
To determine the right number of classes, N,which
should be used for the clustering, first a manual classifica-
tion was performed. Several persons were asked to manually
classify the movies according to their visual color similari-
ties. After the intersection of the results, as each person clas-
sified the movies in a slightly different way, we found that
in the 52-movie database there are 5-movie clusters shar-
ing similar predominant elementary colors: cluster
1
:green,
cluster
2
:red/maroon,cluster
3
:blue,cluster
4
: yellow/orange,
and cluster
5
:gray/black.Thek-means was run using as input
data the h
E
()-values (see (3))foreachofthemovies,thus52
data vectors, each containing 15 values, and N
= 5 clusters.
The obtained cluster repartition is presented in Figure 9.
We have noted a good cluster homogeneity judging from
the cluster silhouette: most of the values are typically above
0.4. The fact that there are movies which are to be found close
to the border of two clusters (the silhouette values are smaller
than 0.2) is due to the fact that some movies have several
predominant colors, not only one.
To analyze the semantic meaning of the results, we use
a 2D projection of the 3D data repartition presented with
Figure 9, as this projection best represents the cluster de-
limitations. In Figure 10, instead of representing the movies
as points on the 2D plot, each movie gets represented
with a significant image. Similarly as the construction of a
groundtruth for evaluating the proposed linguistical descrip-
tions, evaluating the relevance of the results is a subjective
task. It is difficult to give a precise measure of the quality
of the classification results, such as the precision and recall
measures, as even the manual classification was performed
differently by different persons. Moreover, many movies use
Bogdan Ionescu et al. 13
Cluster silhouettes Cluster repartition
N
= 4
4
3
2
1
Cluster
−100
−50
0
50
00.20.40.60.81
100 50 0
−50 −100 −150
−100
0
100
N
= 3
3
2
1
Cluster
−100
−50
0
50
00.20.40.60.8 1 100 50 0 −50 −100 −150
−100
0
100
N
= 2
2
1
Cluster
−100
−50
0
50
00.20.40.60.81
100 50 0
−50 −100 −150
−100
0
100
(a)
Cluster silhouettes Cluster repartition
N
= 4
1+2
3+4
1
2
3+4
1
2
3
4
Adjacent
Colorful
Dark cold
4
3
2
1
Cluster
−100
−50
0
50
100
150
00.20.40.60.81
200 100 0
−100 −200
−200
0
200
N
= 3
3
2
1
Cluster
−100
−50
0
50
100
150
00.20.40.60.8 1 200 100 0
−200 −100
−200
0
200
N
= 2
2
1
Cluster
−100
−50
0
50
100
150
00.20.40.60.81
200 100 0
−100 −200
−200
0
200
(b)
Figure 11: Low-level versus semantic clustering: (a) using low-level parameters, (b) using the fuzzy degrees of the symbolic/semantic color
descriptions (N is the number of clusters, the data repartition is plotted using only the first three principal components).
several predominant hues which makes it difficult to com-
pute the detection errors. To validate the relevance of the re-
sults, we have manually analyzed the content of each achieved
cluster.
We found that the movies are grouped according to their
predominant hues. Each movie sharing one predominant
hue has been successfully assigned to one cluster, being close
to the cluster centroid (see Figure 10). For example, the
movie “Le Moine et le Poisson” which contains 60% yellow
is the centroid of the yellow/orange cluster
4
, the movie “At
the End of the Earth” having 64% blue is the centroid of the
blue cluster
3
, the movie “The Breath” containing 73% green
is the centroid of the green cluster
1
or the movie “Petite Es-
capade” containing 94% gray (gray-level movie) is the cen-
troidofgray/blackcluster
5
(see Figure 10). Meanwhile, the
movies having more than one predominant hue are to be
found close to the clusters containing these colors as repre-
sentative colors. For example, the movie “Gazoon” contain-
ing 51% yellow and 14% green is to be found in the yel-
low/orange cluster
4
but close to the border with the green
cluster
1
. Similarly, the movie “Circuit Marine” having 22%
red and 13% blue is to be found in the red/marron cluster
2
but also close to the blue cluster
3
.
8.2.2. Classification in terms of color techniques
The second test attempts to retrieve the animated movies ac-
cording to the used color techniques. For that, we first prove
the advantage of using symbolic/semantic content descrip-
tions instead of low-level statistical parameters.
Therefore, the k-means clustering was performed first of
all by using only the low-level color parameters proposed
with Section 6 (without the color histograms, a total of 10
parameters) and second by using as input data the fuzzy de-
grees of each symbolic/semantic color descriptions proposed
in Section 7 (a total of 18 parameters). For the second test,
the data redundancy has been reduced by using only two
symbols from three in the case of the linguistic concepts rep-
resented with three symbols, as one symbol can always be
deduced from the other two. Similarly, for the linguistic con-
cepts having two symbols, only one is used.
In what concerns the number of clusters, N, it is entirely
related to the animated movie database. The important het-
erogeneity in terms of animation techniques and movie gen-
res of the used database makes it very difficult, even for a
human operator, to determine precisely the suitable number
of movie clusters to use. To overcome this issue, the k-means
clustering was performed for a number of clusters, N,vary-
ing from 2 to 4. In the absence of a groundtruth, to evaluate
the relevance of the movie repartitions we have manually an-
alyzed each of the movie contents within the obtained clus-
ters. The achieved cluster silhouettes and data repartition are
depicted in Figure 11.
For the clustering using the low-level parameters (see
Figure 11(a)) we found that even for different values of N
the clusters are not well delimited judging from the small
silhouette values which are mainly inferior to 0.4. A lot of
movies are probably assigned to the wrong cluster as there is
a high amount of negative silhouette values. The clusters are
also superposing one another no matter the angle of view.
Moreover, the manual analysis of the movies within the clus-
ters revealed that they are not grouped accordingly to content
similarities. The clusters contain movies which do not share
particular common color characteristics.
On the other hand, the results of the clustering using the
fuzzy degrees of the proposed symbolic/semantic descrip-
tions proved to be very relevant. That is due to the inter-
vention of the expert knowledge in the phase of the con-
stitution of the linguistic concepts. In this case, new knowl-
edge emerges from the achieved cluster repartition. First, the
14 EURASIP Journal on Image and Video Processing
“Casa”
“Le Moine et le
Poisson”
“A me rl o ck”
Light
Dark
Cold
We ak
Hard
War m
Va r.
Comp. Div.
Adj.
Light
Dark
Cold
We ak
Hard
War m
Va r.
Comp. Div.
Adj.
Light
Dark
Cold
We ak
Hard
War m
Va r.
Comp. Div.
Adj.
(a)
“La Cancion du
Microsillon”
“Le Ch
ˆ
ateau des
Autres”
“Le Trop Petit
Prince”
Light
Dark
Cold
We ak
Hard
War m
Va r.
Comp. Div.
Adj.
Light
Dark
Cold
We ak
Hard
War m
Va r.
Comp. Div.
Adj.
Light
Dark
Cold
We ak
Hard
War m
Va r.
Comp. Div.
Adj.
(b)
“Franc¸ois le Vaillant”
“Tamer of wild
horses”
“Och, och”
Light
Dark
Cold
We ak
Hard
War m
Va r.
Comp. Div.
Adj.
Light
Dark
Cold
We ak
Hard
War m
Va r.
Comp. Div.
Adj.
Light
Dark
Cold
We ak
Hard
War m
Va r.
Comp. Div.
Adj.
(c)
Figure 12: Examples of semantic gamuts: color properties gamut G
prop
and color richness gamut G
rich
for several animated movies.
clusters are better separated as most of the silhouette val-
ues are above 0.4 (see Figure 11(b)). Almost none of the sil-
houette values is negative meaning that most probably the
movies are assigned to the adequate clusters. The manual
analysis of the movies within the cluster revealed several in-
teresting movie categories.
Varying the number of classes, N, from 2 to 4, the clus-
tering attempts to preserve the cluster configuration in terms
of color content similarity (see Figure 11(b)), while only the
nonhomogenous clusters are getting divided. For N
= 2, the
movies are divided into colorful movies with predominant
bright colors and high/moderate color variation, cluster
1+2
,
and dark cold adjacent color movies with a reduced color di-
versity, cluster
3+4
. Increasing the numbers of classes to N =
3, the previously obtained cluster
1+2
is divided in two. The
movies having a moderate color diversity and adjacent colors,
cluster
1
, are separated from the colorful movies having a high
color variation/diversity, cluster
2
.ForN = 4,cluster
1
and
cluster
2
are almost entirely preserved while cluster
3+4
is split
in two, forming cluster
3
, which contains the movies having
Bogdan Ionescu et al. 15
generally only a reduced color diversity,andcluster
4
,which
contains all the movies with predominant dark colors and us-
ing a very reduced c olor palette (2 to 4 colors). This is the case
of some particular animation techniques, namely sand, pa-
per, or plasticine modeling, as they are restricted to a very
reduced color palette due to the texture of the materials.
These tests prove the certain advantage of using high-
level content descriptions against the classical low-level pa-
rameters. Using the proposed color content descriptions,
the movies were successfully retrieved in the following cat-
egories: adjacent color movies, using variation of a single
hue, colorful movies (pastel) and dark cold color movies (see
Figure 11). Obviously, the achieved results are limited to the
animated movie database we used. Further tests should be
performed on a much larger-scale database.
8.3. Comparing movies
We are addressing here the problem of comparing different
animated movies, a task which is mandatory in a content-
based indexing system [36]. In such a system, the user will
typically search for movies having the same characteristics as
one he knows (i.e., the same technique, the same genre, in-
ducing the same visual feeling, etc.). To denote this property,
we are saying that they are similar [37].
Expressing the similarity concept is a difficult task, par-
ticularly in the case of the indexing systems, where each ob-
ject is represented with a large variety of features (i.e., textual
features, low-level numerical parameters, color distributions,
etc.). The basic solution adopted by most of the existing ap-
proaches is to express the similarity concept using some nu-
merical distance measures [12].Butinthiscaseeachtypeof
data requires the use of a specific distance measure which is
adapted to the data set. To overcome this issue and thus to
facilitate the similarity evaluation task, we propose to repre-
sent color content in an efficient graphical manner. The pro-
posed method was inspired from the color gamut [38], used
in printing devices, and we called it the semantic gamut.We
define the semantic gamut as the 2D graphical representation
of the semantic properties of the movie where each semantic
feature gets represented on a different axis. All the axes share
the same origin which is also the origin of the system. The
semantic gamut is the surface determined by the feature val-
ues. The major discriminant feature of the gamut is its shape
(see Figure 12).
To test the efficiency of this approach, we are con-
structing two different semantic color gamuts using the
symbolic/semantic color content descriptions proposed in
Section 7. Thus, the following holds.
(i) The color properties gamut, G
prop
, displays on dif-
ferent axes the following information: light colors
(Light), hard colors (Hard), warm colors (Warm), dark
colors (Dark), weak colors (Weak),andcoldcolors
(Cold). Within the color properties gamut, opposite
color properties are to be found in the opposing ends
of the gamut for visualization purpose: cold versus
warm, weak versus hard, and so on. These properties
are somehow complementary, that is, in a movie the
Light
Dark
Cold
We ak
Hard
War m
Light
Dark
Cold
We ak
Hard
War m
Figure 13: G
prop
gamut substraction example.
amount of light and dark colors is complementary as
the dark colors cannot be also light and vice versa.
(ii) The color richness gamut, G
rich
, displays the following
color information: color variation (Var), color diver-
sity (Div), the amount of adjacent colors (Adj), and of
complementary colors (Comp). In this case the order
of the color information is not relevant.
The two gamuts have been tested on the CITIA [5] ani-
mated movie database. Some of the obtained results are de-
picted in Figure 12. The semantic gamut facilitates the re-
trieval of similar content movies. For instance, the movies
“Casa” and “Le Moine et le Poisson”, which share similar
color techniques, namely the paper drawing as animation
technique, the color distribution based on a single predom-
inant hue (red/orange and, resp., yellow) being contrasted
by the presence of gray, have similar shape gamuts (see
Figure 12). Another example are the movies “La Cancion du
Miscrosillon” and “Le Chateau des Autres” which are using
the same elementary colors (orange, red, yellow, and gray)
and similar color techniques, therefore the shapes of the color
properties gamuts, G
prop
, are quite similar.
The interest in this graphical representation is not limited
measuring the content similarity. The semantic gamut could
serve as visual color content summarization in a navigation
system. Representing the movies with semantic gamuts will
quickly debrief the user on the movie content characteristics
and, depending on the application (i.e., database browsing),
this will perform faster than a movie abstract. For instance,
by looking at the gamuts in Figure 12, we can easily spot the
dark-warm colors movies like “Le Chateau des Autres” or
“Casa”, or adjacent color movies like “Le Moine et le Pois-
son” or “Tamer of Wild Horses”. Obviously, when a more
profound content understanding is needed, video abstracts
are required.
On the other hand, the semantic gamut can be used with
the search engine. One can formulate the query by graph-
ically designing a particular gamut shape according to his
content preferences. In this way, the research task is sim-
plified by providing a normalization of the query. Instead
of using complex similarity measures applied between dif-
ferent types of data (features) to browse through the movie
database, one can employ a simple and efficient distance
measure such as the substraction of the gamuts:
d
surf
G
1
, G
2
= Surf
G
1
∪ G
2
− G
1
∩ G
2
, (10)
where G
1
and G
2
are two semantic gamuts and Surf() is the
operator returning the surface of a gamut. The efficiency of
16 EURASIP Journal on Image and Video Processing
this type of measure is shown in Figure 13.Wehaveillus-
trated the achieved d
surf
distance (depicted with blue) for two
movies havingvery different color contents, namely “Casa”
and “Franc¸ois le Vaillant” (first graph) and for two movies
having a similar color content, namely “Casa” and “Le Moine
et le Poisson” (second graph). We can easily observe that the
movies having a similar color content lead to a small distance,
while the different ones lead to an important distance value.
9. CONCLUSION
This paper proposes a method for the symbolic/semantic
description of the animated movies color content in the
automatic content-based indexing task. It exploits the pecu-
liarity of the animated movies of containing specific color
palettes.
The movie color distribution is captured using a global
weighted color histogram. The color content is further de-
scribed with several low-level statistical parameters. The se-
mantic description is achieved using a fuzzy set representa-
tion approach and a priori knowledge from the animation
domain. It regards the color artistry concepts which are to be
found in animated movies, that is, color perception, Itten’s
color contrast, harmony schemes, color richness.
The proposed content descriptions were used in sev-
eral unsupervised clustering tests in the attempt to retrieve
the animated movies according to the color techniques.
The achieved results show the advantage of using seman-
tic/symbolic descriptions instead of low-level parameters
which have not been capable of delivering any semantic
knowledge. The movies have been successfully retrieved ac-
cording to their predominant hues and the used color tech-
niques, that is, colorful movies (pastel, joyful movies), dark
cold color movies (sad movies), or adjacent color movies.
To facilitate the retrieval task, we have proposed to represent
the movie color properties in a graphical manner which was
called the semantic gamut. This representation proved to be
very efficient in spotting movies having a similar content and
in facilitating the design of a similarity measure to compare
different movie contents.
The evaluation of the results proved to be a very sub-
jective task as it mainly relies on human perception and of
course on the animated database we used. However, the elo-
quence of the results was confirmed through the manual
analysis of the results using a priori knowledge provided by
the animation experts.
The interest in the proposed content description
methodology is multiple. Firstly, it facilitated the navigation
task. Instead of using movie abstracts, one may use the pro-
posed linguistical descriptions and the semantic gamuts. Sec-
ondly, it facilitates the research task. The proposed descrip-
tions could be used as human-like indexes in a content-based
retrieval system. For instance, it would be an intuitive way of
searching movies that share “yellow” as a predominant color
or movies expressing sadness (i.e., dark cold colors). Finally,
we provide the animation artists or ordinary people with de-
tailed information regarding the movie color content and the
color techniques used for analysis purpose.
Future improvements of the proposed methodology con-
sist mainly in a multimodal approach where other types
of information are to be considered (i.e., motion, text, and
sound). We should also pursue our tests on a larger-scale an-
imated movies database by solving the groundtruth issue.
ACKNOWLEDGMENTS
The authors would like to thank CITIA—the city of mov-
ing images [5]—and Folimage Animation Company [24]for
providing them access to their animated movie database and
for the technical support. This work was partially supported
by CNCSIS, National University Research Council of Roma-
nia, Grant no. 6/01-10-2007/RP-2 (EL/08-07-12).
REFERENCES
[1]W.K.Pratt,Digital Image Processing,JohnWiley&Sons,
Hoboken, NJ, USA, 2007.
[2] P. Kay and T. Regier, “Resolving the question of color naming
universals,” Proceedings of the National Academy of Sciences of
the United States of America, vol. 100, no. 15, pp. 9085–9089,
2003.
[3] R. Benavente and M. Vanrell, “Fuzzy colour naming based on
sigmoid membership functions,” in Proceedings of the 2nd Eu-
ropean Conference on Color in Graphics, Imaging and Vision
(CGIV ’04), pp. 135–139, Aachen, Germany, April 2004.
[4] A. W. M. Smeulders, M. Worring, S. Santini, A. Gupta, and
R. Jain, “Content-based image retrieval at the end of the early
years,” IEEE Transactions on Pattern Analysis and Machine In-
telligence, vol. 22, no. 12, pp. 1349–1380, 2000.
[5] CITIA—City of Moving Images, o/.
[6] C. G. M. Snoek and M. Worring, “Multimodal video indexing:
a review of the state-of-the-art,” Multimedia Tools and Appli-
cations, vol. 25, no. 1, pp. 5–35, 2005.
[7] B. Ionescu, V. Buzuloiu, P. Lambert, and D. Coquin, “Im-
proved cut detection for the segmentation of animation
movies,” in Proceedings of IEEE International Conference on
Acoustics, Speech and Signal Processing (ICASSP ’06), vol. 2, pp.
641–644, Toulouse, France, May 2006.
[8] B. Ionescu, P. Lambert, D. Coquin, and L. Darlea, “Color-
based semantic characterization of cartoons,” in Proceedings
of International Symposium on Signals, Circuits and Systems
(ISSCS ’05), vol. 1, pp. 223–226, Iasi, Romania, July 2005.
[9] W. A. C. Fernando, C. N. Canagarajah, and D. R. Bull, “Fade
and dissolve detection in uncompressed and compressed video
sequences,” in Proceedings of IEEE International Conference on
Image Processing (ICIP ’99), vol. 3, pp. 299–303, Kobe, Japan,
October 1999.
[10] M. Roach, J. S. Mason, and M. Pawlewski, “Motion-based clas-
sification of cartoons,” in Proceedings of Internat ional Sympo-
sium on Intelligent Multimedia, Video and Speech Processing
(ISIMP ’01), pp. 146–149, Hong Kong, May 2001.
[11] A. K. Jain, Fundamentals of Digital Image Processing, Prentice
Hall Information and Systems Sciences Series, Prentice Hall,
Upper Saddle River, NJ, USA, 1988.
[12] A. K. Jain, M. N. Murty, and P. J. Flynn, “Data clustering: a
review,” ACM Computing Surveys, vol. 31, no. 3, pp. 264–323,
1999.
[13] N. Papamarkos, A. E. Atsalakis, and C. P. Strouthopoulos,
“Adaptive color reduction,” IEEE Transactions on Systems,
Man, and Cybernetics, Part B, vol. 32, no. 1, pp. 44–56, 2002.
Bogdan Ionescu et al. 17
[14] J. A. Lay and L. Guan, “Retrieval for color artistry concepts,”
IEEE Transactions on Image Processing, vol. 13, no. 3, pp. 326–
339, 2004.
[15] “IBM QBIC at the Hermitage Museum,” mita-
gemuseum.org/.
[16] C. Colombo, A. Del Bimbo, and P. Pala, “Semantics in visual
information retrieval,” IEEE Multimedia, vol. 6, no. 3, pp. 38–
53, 1999.
[17] M. Detyniecki and C. Marsala, “Discovering knowledge for
better video indexing based on colors,” in Proceedings of the
12th IEEE International Conference on Fuzzy Systems (FUZZ
’03), vol. 2, pp. 1177–1181, St. Louis, Mo, USA, May 2003.
[18] J. Hafner, H. S. Sawhney, W. Equitz, M. Flickner, and W.
Niblack, “Efficient color histogram indexing for quadratic
form distance functions,” IEEE Transactions on Pattern Anal-
ysis and Machine Intelligence, vol. 17, no. 7, pp. 729–736, 1995.
[19] B. Ionescu, P. Lambert, D. Coquin, and V. Buzuloiu, “Fuzzy
color-based semantic characterization of animation movies,”
in Proceedings of the 3rd European Conference on Color in
Graphics, Imaging, and Vision (CGIV ’06), Leeds, UK, June
2006.
[20] R. W. Floyd and L. Steinberg, “An adaptive algorithm for spa-
tial gray scale,” in Proceedings of Society for Information Display
International Symposium (SID ’75), p. 3637, Washington, DC,
USA, April 1975.
[21] J. Itten, The Art of Color: The Subjective Experience and Ob jec-
tive Rationale of Color, Reinhold, New York, NY, USA, 1961.
[22] F. Birren, Principles of Color: A Review of Past Traditions and
Modern Theories of Color Harmony,Reinhold,NewYork,NY,
USA, 1969.
[23] R. Lienhart, “Reliable transition detection in videos: a survey
and practitioners guide,” International Journal of Image and
Graphics, vol. 1, no. 3, pp. 469–486, 2001.
[24] Folimage animation, />[25] K. Kanjanawanishkul and B. Uyyanonvara, “Novel fast color
reduction algorithm for time-constrained applications,” Jour-
nal of Visual Communication and Image Representation,
vol. 16, no. 3, pp. 311–332, 2005.
[26]Y.Rubner,L.Guibas,andC.Tomasi,“TheEarth’smover
distance, multi-dimensional scaling and color-based image
retrieval,” in Proceedings of the ARPA Image Understanding
Workshop, pp. 661–668, New Orleans, La, USA, May 1997.
[27] Visibone, />[28] L. A. Zadeh , “Fuzzy sets,” Information and Control, vol. 8,
no. 3, pp. 338–353, 1965.
[29] G. A. F. Seber, Multivariate Observations,JohnWiley&Sons,
New York, NY, USA, 1984.
[30] L. Kaufman and P. J. Rousseeuw, Finding Groups in Data: An
Introduction to Cluster Analysis, John Wiley & Sons, New York,
NY, USA, 1990.
[31] J. E. Jackson, User’s Guide to Principal Components,JohnWiley
& Sons, New York, NY, USA, 1991.
[32] B. Ionescu, P. Lambert, D. Coquin, and V. Buzuloiu, “Color-
based content retrieval of animation movies: a study,” in Pro-
ceedings of the International Workshop on Content-Based Mul-
timedia Indexing (CBMI ’07), pp. 295–302, Talence, France,
June 2007.
[33] G. J. Klir and B. Yuan, Fuzzy Sets and Fuzzy Logic: Theory and
Applications, Prentice Hall, Englewood Cliffs, NJ, USA, 1995.
[34] L X. Wang, “Fuzzy systems are universal approximators,” in
Proceedings of the IEEE International Conference on Fuzzy Sys-
tems, pp. 1163–1170, San Diego, Calif, USA, March 1992.
[35] J. Dombi and Z. Gera, “The approximation of piecewise linear
membership functions and Łukasiewicz operators,” Fuzzy Sets
and Systems, vol. 154, no. 2, pp. 275–286, 2005.
[36] M. R. Naphade and T. S. Huang, “Extracting semantics from
audiovisual content: the final frontier in multimedia retrieval,”
IEEE Transactions on Neural Networks, vol. 13, no. 4, pp. 793–
810, 2002.
[37] J. Fan, H. Luo, and A. K. Elmagarmid, “Concept-oriented in-
dexing of video databases: toward semantic sensitive retrieval
and browsing,” IEEE Transactions on Image Processing, vol. 13,
no. 7, pp. 974–992, 2004.
[38] Wikipedia The Free Encyclopedia, />wiki/Gamut.
[39] B. Ionescu, D. Coquin, P. Lambert, and V. Buzuloiu, “Fuzzy se-
mantic action and color characterization of animation movies
in the video indexing task context,” in Adaptive Multimedia
Retrieval: User, Context, and Feedback, S. Marchand-Maillet,
E.Bruno,A.N
¨
urnberger , and M. Detyniecki, Eds., vol. 4398
of Lecture Notes in Computer Sc ience, pp. 119–135, Springer,
Heidelberg, Germany, 2007.
[40] R. Culebras, J. Ram
´
ırez, and J. M. G
´
orriz, “Effective
speech/pause discrimination combining noise suppression
and fuzzy logic rules,” in Proceedings of the IEEE International
Conference on Acoustics, Speech and Signal Processing (ICASSP
’06), vol. 1, pp. 1213–1216, Toulouse, France, May 2006.
[41] B Y. Kang, D W. Kim, and S J. Lee, “Semantic indexing and
fuzzy relevance model in information retrieval,” in Compu-
tational Intelligence for Modelling and Prediction, pp. 49–60,
Springer, Heidelberg, Germany, 2005.
[42] P. Lambert and T. Carron, “Symbolic fusion of luminance-
hue-chroma features for region segmentation,” Pattern Recog-
nition, vol. 32, no. 11, pp. 1857–1872, 1999.