Báo cáo hóa học: " New Method to Prepare Mitomycin C Loaded PLA-Nanoparticles with High Drug Entrapment Efficiency" docx
Bạn đang xem bản rút gọn của tài liệu. Xem và tải ngay bản đầy đủ của tài liệu tại đây (295.43 KB, 6 trang )
NANO EXPRESS
New Method to Prepare Mitomycin C Loaded PLA-Nanoparticles
with High Drug Entrapment Efficiency
Zhenqing Hou Æ Heng Wei Æ Qian Wang Æ Qian Sun Æ
Chunxiao Zhou Æ Chuanming Zhan Æ Xiaolong Tang Æ
Qiqing Zhang
Received: 10 February 2009 / Accepted: 2 April 2009 / Published online: 21 April 2009
Ó to the authors 2009
Abstract The classical utilized double emulsion solvent
diffusion technique for encapsulating water soluble Mito-
mycin C (MMC) in PLA nanoparticles suffers from low
encapsulation efficiency because of the drug rapid parti-
tioning to the external aqueous phase. In this paper, MMC
loaded PLA nanoparticles were prepared by a new single
emulsion solvent evaporation method, in which soybean
phosphatidylcholine (SPC) was employed to improve the
liposolubility of MMC by formation of MMC–SPC com-
plex. Four main influential factors based on the results of a
single-factor test, namely, PLA molecular weight, ratio of
PLA to SPC (wt/wt) and MMC to SPC (wt/wt), volume
ratio of oil phase to water phase, were evaluated using an
orthogonal design with respect to drug entrapment effi-
ciency. The drug release study was performed in pH 7.2
PBS at 37 °C with drug analysis using UV/vis spectrometer
at 365 nm. MMC–PLA particles prepared by classical
method were used as comparison. The formulated MMC–
SPC–PLA nanoparticles under optimized condition are
found to be relatively uniform in size (594 nm) with up to
94.8% of drug entrapment efficiency compared to 6.44 lm
of PLA–MMC microparticles with 34.5% of drug
entrapment efficiency. The release of MMC shows biphasic
with an initial burst effect, followed by a cumulated drug
release over 30 days is 50.17% for PLA–MMC–SPC
nanoparticles, and 74.1% for PLA–MMC particles. The IR
analysis of MMC–SPC complex shows that their high
liposolubility may be attributed to some weak physical
interaction between MMC and SPC during the formation of
the complex. It is concluded that the new method is
advantageous in terms of smaller size, lower size distri-
bution, higher encapsulation yield, and longer sustained
drug release in comparison to classical method.
Keywords Mitomycin C Á PLA Á Nanoparticles Á
Drug release
Introduction
Mitomycin C (MMC) is a bifunctional alkylating agent
which has been extensively used as an anti-tumor agent for
a long time. Because of MMC’s enhanced activity in
hypoxic environments [1], it has great potential for loco-
regional treatment of solid tumors since a significant per-
centage of viable cancer cells within a solid tumor can be
hypoxic [2]. However, use of MMC is associated with a
number of acute and chronic toxicities, such as irreversible
myelosuppression and hemolyticuremic syndrome, which
limit its clinical application. Therefore, efforts have been
made to lessen the toxic effects of MMC and improve its
utility using various delivery methods.
The predominant method for MMC delivery involves
drug encapsulation in nano-or micro-particles using various
polymers including albumin [3], dextran [4, 5], estradiol
[6], N-succinyl-chitosan [7], hydrogels [8], polybutylcy-
anoacrylate [9], and poly-epsilon-caprolactone [10]. These
Z. Hou Á H. Wei Á Q. Wang Á Q. Sun Á C. Zhou Á C. Zhan Á
X. Tang Á Q. Zhang (&)
Research Center of Biomedical Engineering of Xiamen
University, Material College of Xiamen University,
Xiamen 361005, China
e-mail:
Z. Hou
e-mail:
Q. Zhang
Chinese Academy of Medical Sciences, Peking Union Medical
College Institute of Biomedical Engineering, Tianjin 300192,
China
123
Nanoscale Res Lett (2009) 4:732–737
DOI 10.1007/s11671-009-9312-z
systems, however, have shown some defects for local
administration of MMC due to fast degradation of those
drug carriers in the body.
PLA is a well-known biodegradable and biocompatible
polymer and has a relatively longer degradation time in
vivo (from weeks to months) according to their molecular
weight. It has been used in various applications such as
wound dressing and drug delivery [10, 11]. Generally, the
water-limited soluble MMC cannot be directly dissolved in
hydrophobic organic solvents such as dichloromethane, so
the drug entrapment efficiency of PLA nano/microparticles
prepared by a classical double emulsion solvent evapora-
tion method is very limited.
In order to overcome these shortcomings, we have
developed a new method to prepare mitomycin C loaded
PLA nanoparticles by a new emulsion solvent evaporation
technique, in which soybean phosphatidylcholine (SPC)
was employed to improve the liposolubility of MMC by
formation of MMC–SPC complex. SPC was used because
of its good biocompatibility and ready availability.
In this paper, the four main influential factors at three
levels, PLA MW (molecular weight), ratio of PLA to SPC
(wt/wt) and ratio of MMC to SPC (wt/wt), volume ratio of
oil phase to water phase chosen for the present investiga-
tion, were based on the results of preliminary experiments
using a single-factor test; the emphasis of this paper was
placed on the optimum production conditions and charac-
terization of PLA–MMC–SPC nanoparticles in vitro.
Experimental Details
Materials
Mitomycin C (MMC) (99.5%) was purchased from
Shanghai Xin Ya Pharmaceutical Co. Ltd. PLA (M
w
=
5000, 10000, 50000) were obtained from Shandong
Medical Treatment and Instrument Institute. Soybean
phosphatidylcholine was provided by Sigma Co. Ltd.
Dichloromethane (DCM), dimethyl sulfoxide (DMSO),
poly (vinyl alcohol) (PVA, degree of polymerization 1700,
degree of hydrolysis 88.5%) used as a stabilizer in the
external water phase were purchased from Xiamen
Chemical Reagents Company (Xiamen, China). All other
reagents and solvents were of analytical grade.
Preparation of MMC–SPC Complex
Due to both MMC and SPC being dispersed as the uni-
molecular form in DMSO solution, a waterless complex of
MMC and SPC was formed after removal of the solvent. So
the complex was prepared by an anhydrous co-solvent
lyophilization method. Briefly, MMC powder and SPC
with a ratio of 1:5 (wt/wt) were co-dissolved in dimethyl
sulfoxide (DMSO) by gentle agitation. The resultant
homogeneous solution was then freeze-dried overnight at a
condenser temperature of -40 °C and under a vacuum of
10 Pa. So the MMC–SPC complex with a ratio of 1:5 was
obtained; the MMC–SPC complex with a ratio of 1:10 and
3:10 (wt/wt) were also prepared in a same way used as the
following optimal experiment.
The MMC–SPC physical mixture was prepared by
mixing MMC with SPC (a ratio of 1:5 wt/wt).
FTIR Analysis of Complex
Fourier transform infrared spectrophotometry (FTIR
Spectrometer, BRUKER IFS-55, Switzerland) was used to
study the interaction between MMC and SPC. The FTIR
spectra of MMC, SPC, the complex and physical mixture
of MMC and SPC with a ratio of 1:5 (wt/wt) were obtained
by the KBr method.
Solubilization Studies of Complex
Organic solvent dichloromethane (DCM) was used to
evaluate the altered solubility of MMC after it was com-
bined with SPC. Briefly, aliquots of organic solvent (2 mL)
were introduced into MMC–SPC complexes (20 mg) and
physical mixture (20 mg) of SPC and MMC with a ratio of
5:1, respectively, followed by gentle vortexing until an
equilibrium system was obtained. The solubilization of
each system before and after 24 h of storage was evaluated
by visual examination.
Preparation of MMC–PLA–SPC Nanoparticles
MMC was formulated into PLA nanoparticles by a new
single emulsion solvent evaporation method. Briefly, 6 mL
DCM containing defined amounts of PLA was added to the
MMC–SPC complex (60 mg), followed by gentle agitation
until a micelle solution was obtained. The solution was
poured into defined amounts of aqueous solution contain-
ing 0.25% PVA and then probe sonicated at 80 W for 5 s
and repeated three times in an ice-water bath to form a
stable o/w emulsion. After evaporation of the organic
solvent with gentle stirring under atmospheric pressure for
24 h, the complex and polymer gradually co-precipitated in
the emulsion droplets, so MMC–PLA–SPC nanoparticles
were obtained. Those solidified nanoparticles were col-
lected by ultracentrifugation, washed with distilled water
three times, and lyophilized.
The drug entrapment efficiency (EE%) was determined
indirectly by measuring the amount of free MMC using
UV/vis spectrometer at 365 nm in the supernatant recov-
ered after ultracentrifugation. The drug entrapment
Nanoscale Res Lett (2009) 4:732–737 733
123
efficiency was expressed as percentage of the MMC dif-
ference between the initial amount of MMC and the free
amount in the supernatant relative to the total amount used
for the nanoparticles preparation.
To compare the results and those obtained by a classical
method, the PLA–MMC microparticles were also prepared
by a double emulation solvent evaporation method. The
procedure for PLA–MMC microparticles was similar to the
process mentioned above except that 6 mL DCM con-
taining defined amounts of PLA was added to 3 mL of
distilled water solution containing 10 mg MMC, and probe
sonicated at 80 W for 5 s and repeated three times in an
ice-water bath to form a w
1
/o primary emulsion, and fol-
lowed by the w
1
/o emulsion droplets were poured into
defined amounts of aqueous solution containing 0.25%
PVA and homogenized at a rate of 1000 rpm.
Formulation Optimization
An orthogonal L
9
(3
4
) test design was used to investigate
the optimal formulation condition. As seen from Table 1,
the optimal experiment was carried out with four factors
and three levels, namely PLA MW, ratio of PLA to SPC
(w/w), the ratio of MMC to SPC (w/w), volume ratio of oil
phase to water phase (labeled as A, B, C, and D in
Table 1). The range of each factor level was based on the
results of preliminary experiments using a single-factor
test. The entrapment efficiency (EE%) of MMC was the
dependent variable. The PLA–MMC–SPC nanoparticles
obtained from the above nine tests were operated following
the method mentioned above. The L
9
(3
4
) orthogonal design
was established as shown in Table 1.
Characterization of PLA–MMC–SPC Nanoparticles
SEM (XL-30, Philips) was used to examine the surface
morphology of PLA–MMC–SPC nanoparticles. The dried
nanoparticles were mounted on metal stubs with double-
sided electrical tape. They were gold coated under reduced
pressure with a sputter coater before being viewed under
the SEM at 20 kV. Zetasizer (Nano-ZS, Malven) was used
to measure the size distribution and Zata potential of PLA–
MMC nanoparticles. Prior to analysis, 10 mL of distilled
water was added to a 20 mL vial containing PLA–MMC–
SPC nanoparticles powder (containing 10 mg), and the vial
was shaken. The characterization of PLA–MMC micro-
particles prepared by classical method was also examined
in the same way as used for comparison.
Assay of In Vitro Drug Release
The in vitro release of MMC from the PLA–MMC–SPC
nanoparticles was measured in PBS at pH 7.2. PLA–
MMC–SPC nanoparticles weighing 40 mg were added in
50 mL of the medium in 60 mL conical screw capped
tubes, preserved with 0.05% (w/v) sodium azide to prevent
microbial growth. The samples were incubated at 37 °C
and shaken horizontally at 100 cpm in a shaking incubator.
At given time intervals, samples were removed from the
vials tubes for quantitative estimation of the amount of
drug released. In a typical test, 0.5 mL of the drug con-
taining buffer solution was removed and the vial was
replenished with 0.5 mL of fresh buffer solution to main-
tain a constant volume of the released medium. All release
tests were run in triplicates.
The release of MMC from PLA–MMC microparticles
was also measured in the same way as used for comparison.
Results and Discussion
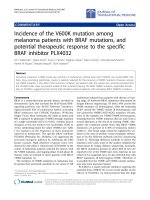
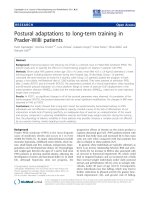
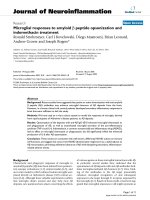
The pictures of SPC, MMC, their physical mixture, and
complex in organic solvent (DCM) before and after 24 h
storage are shown in Figs. 1 and 2. It is clear to see that
MMC–SPC complex is dissolved in the DCM completely
(Fig. 1d) and stable even after 24 h storage (Fig. 2d).
Table 1 Factor-level in orthogonal-design experiments of L
9
(3
4
)
Level Factor
ABC D
PLA MW PLA/SPC MMC/SPC O/W
1 5000 1:1 1:10 1:2.5
2 10000 3:1 2:10 1:5
3 50000 5:1 3:10 1:10
A The molecular weight of PLA, B the ratio of PLA to SPC (wt/wt), C
the ratio of MMC to SPC (wt/wt), D the ratio of oil to water solution
(v/v)
Fig. 1 The pictures of SPC (a), MMC (b), their physical mixture (c),
and complex (d) in organic solvent (DCM) before storage
734 Nanoscale Res Lett (2009) 4:732–737
123
However, a separation layer is shown for the corresponding
physical mixture (Fig. 1c and Fig. 2c), which suggests that
MMC could not be solubilized effectively within DCM by
simple physical mixing with SPC. As MMC cannot be
soluble in DCM (Fig. 1b) it precipitates after 24 h of
storage (Fig. 2b). The results could be explained by that the
hydrophilic head group of SPC may be directed toward the
hydrophilic areas of MMC and the hydrophobic tail is
directed toward the organic phase to provide the correct
orientation. This explanation is further confirmed by FTIR
experiments, which will be discussed below.
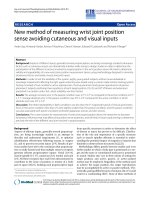
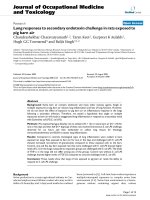
FTIR analysis is used to study the interactions between
MMC and SPC. The infrared spectra of MMC and SPC,
their physical mixture and complex are shown in Fig. 3.
There was a significant difference between the physical
mixture (Fig. 3d) and the complex (Fig. 3c). The spectrum
of the physical mixture shows an additive effect of MMC
and SPC, in which the characteristic absorption peaks of
MMC (Fig. 3a) at 3345 cm
-1
, 3316 cm
-1
, 3269 cm
-1
are
present in one broad absorption peak. However, in the
spectrum of their complex, the three characteristic
absorption peaks of MMC are almost masked by that of
SPC. Compared with SPC (Fig. 3b), the characteristic
absorption peak at 1231 cm
-1
of SPC disappears in the
spectrum of the complex. Moreover, no new peaks are
observed in the mixture and complex. These observations
suggest that some weak physical interactions between
MMC and SPC take place during the formation of the
complex.
The analysis results of orthogonal test performed by
statistical software SPSS 13.0 are presented in Table 2.
The factors influencing the EE (%) are listed in a
decreasing order as follow: B [ C [ D [ A according to
the R value and the individual levels within each factor are
ranked as: A: 1 [ 3 [ 2; B: 2 [ 3 [ 1; C: 2 [ 1 [ 3;
D: 1 [ 2 [ 3. The optimized formulation should be
B
2
C
2
D
1
A
1
(the ratio of PLA to SPC: 3:1, the ratio of MMC
to SPC: 2:10, the ratio of oil to water solution: 1:2.5, and
PLA MW: 5000), according to the R value, we can find the
ratio of PLA to SPC is found to be the most important
determinant of the EE (%). However, the factor of PLA
MW can be overlooked. Through confirmatory test, the
drug entrapment efficiency is up to as high as 94.8%, while
that prepared by classical method at same condition is
Fig. 2 The pictures of SPC (a), MMC (b), their physical mixture (c),
and complex (d) in organic solvent (DCM) after 24 h storage
Fig. 3 The FTIR of MMC (a)
and SPC (b), complex (c), and
their physical mixture (d)
Nanoscale Res Lett (2009) 4:732–737 735
123
34.5%. Those significant differences may be due to the
reason that high liposolubility of MMC–SPC and affinity of
MMC and SPC make MMC being trapped in the nano-
particles with little MMC released into the external water
phase or destroyed during the preparation.
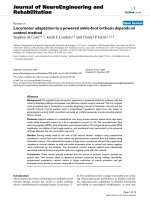
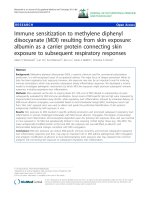
The SEM image of both PLA–MMC–SPC nanoparticles
(a, c) and PLA–MMC microparticle (b, d) are shown in
Fig. 4, which demonstrates that both nanoparticles and
microparticles are essentially spherical in shape, but there
are many pinholes in the surface of microparticles. The
cross-sectional SEM image of both PLA nanoparticles (c)
and microparticles (d) could be seen by breaking them,
showing inner empty structure, but shell of PLA nanopar-
ticles is relatively thicker than that of microparticles. There
exist two possibility of the position of encapsulated drugs
after removing the dichloromethane in the preparation of
PLA nanoparticles, one possibility is that the encapsulated
drugs are uniformly dispersed with the PLA nanoparticles,
another possibility is that the encapsulated drugs are loaded
into the inner part of PLA particles, forming a shell core
structure (same like the egg) or layer structure, but this shell
core or layer structure was not found from the cross-sec-
tional SEM image of PLA nanoparticles, indicting that drug
is uniformly dispersed within the shell of PLA nanoparticles.
The zeta potential value (-42.2 mV) observed for
PLA–MMC–SPC nanoparticles is significantly lower than
-30 mV, the typical threshold value for flocculation [12],
suggesting the suspension shows well stability, while zeta
potential value for the PLA–MMC microparticles is found to
be -12.6 mV. This significant difference of zeta potential
value between PLA–MMC–SPC nanoparticles and PLA–
MMC microparticles can be explained by the fact that SPC is
an amphiphile and can be served as a surfactant; there was a
minimal free SPC on their surface with hydrophilic head
group of SPC toward the suspending medium during the
formation of PLA–MMC–SPC nanoparticles.
A particle size distribution of PLA–MMC–SPC nano-
particles is shown in Fig. 5. Result shows that an average
diameter of PLA–MMC–SPC nanoparticles is 594 nm with
a narrow size distribution, while those prepared by the
classical method present very broad size distribution
Table 2 Result of orthogonal-design experiments L
9
(3
4
)
No. A B C D EE (S1)
1 1 1 1 1 70.53
2 1 2 2 2 88.75
3 1 3 3 3 80.45
4 2 1 2 3 65.98
5 2 2 3 1 83.67
6 2 3 1 2 87.20
7 3 1 3 2 60.46
8 3 2 1 3 86.45
9 3 3 2 1 90.36
S1 K1 79.91 65.66 81.39 81.52
K2 78.95 86.29 81.70 78.80
K3 79.09 86.00 74.86 77.63
R 0.96 20.63 6.84 3.89
A The molecular weight of PLA, B the ratio of PLA to SPC (wt/wt), C
the ratio of MMC to SPC (wt/wt), D the ratio of oil to water solution
(v/v), EE(%) drug entrapment efficiency
Fig. 4 SME image of PLA–
MMC–SPC nanoparticles
prepared by new single solvent
evaporation method (a, c) and
PLA–MMC microparticles
prepared by the classical
method (b, d)
736 Nanoscale Res Lett (2009) 4:732–737
123
and the average diameters of 6.44 lm (figure was not
presented).
The in vitro release profiles of MMC from the PLA–
MMC–SPC nanoparticles and the PLA–MMC microparti-
cles are monitored as a function of time (Fig. 6). As seen in
Fig. 6, the amount of MMC released from the PLA–MMC–
SPC nanoparticles at pH 7.2 medium is 30.76% over 24 h,
whereas that of free MMC released from the PLA–MMC
microparticles is no more than 23.00%. This difference is
probably due to the fact that smaller sized PLA–MMC–SPC
nanoparticles are subject to a more extensive MMC release
by diffusion toward the suspending medium due to their
higher surface volume ratio. This phenomenon also sug-
gests that the MMC–SPC complex trapped on the surface of
the nanoparticles has suffered dissociation and MMC could
be released as free form. Following the initial rapid release
phase, both of them have a sustained drug release phase and
a cumulated drug release over 30 days is 50.17% for PLA–
MMC–SPC nanoparticles and 74.10% for PLA–MMC
microparticles. This difference may be explained by the
interaction between the negatively charged phosphate group
in SPC and positively charged amino group in MMC, which
guarantees the integrity of MMC–SPC complex being
released from the nanoparticles first and then followed by
the MMC dissociation from the complex in the pH 7.2 PBS
medium. In addition, integrity of MMC–SPC complex also
prevents the labile amino group of MMC from being broken
down at low pH surrounding. Actually, the real reason
requires further studies.
Conclusion
This work demonstrates that the new single emulsion sol-
vent evaporation method for the encapsulation of MMC in
PLA nanoparticles results in improved formulation char-
acteristics including smaller size, lower size distribution,
higher encapsulation yield, and longer sustained drug
release in comparison to classical method. The PLA–
MMC–SPC nanoparticles system has a potential for long
sustained delivery of MMC for local administration espe-
cially at tumor tissues and efficacy studies with these
systems are underway.
Acknowledgments This work was supported by the National Basic
Research Program of China (2006CB933300) and the National Key
Technology R&D Program (2007BAD07B05).
References
1. A.M. Rauth, J.K. Mohindra, I.F. Tannock, Cancer Res. 43, 4154
(1983)
2. S. Rockwell, C.S. Hughes, Cell Prolif. 27, 153 (1994). doi:
10.1111/j.1365-2184.1994.tb01413.x
3. J. Cummings, L. Allan, J.F. Smyth, Biochem. Pharmacol. 47,
1345 (1994). doi:10.1016/0006-2952(94)90333-6
4. T. Nomura, A. Saikawa, S. Morita, T. Sakaeda, F. Yamashita, K.
Honda, J. Control. Release 52, 239 (1998). doi:10.1016/S0168-
3659(97)00185-5
5. Y.C. Richard, Y. Yuming, M.R. Andrew, M. Norman, Bioma-
terials 26, 5375 (2005). doi:10.1016/j.biomaterials.2005.01.050
6. N. Ishiki, H. Onishi, Y. Machida, Int. J. Pharm. 279, 81 (2004).
doi:10.1016/j.ijpharm.2004.04.017
7. H. Onishi, H. Takahashi, M. Yoshiyasu, Y. Machida, Drug Dev.
Ind. Pharm. 27, 659 (2001). doi:10.1081/DDC-100107322
8. Y. Liu, H. Li, X.Z. Shu, S.D. Gray, G.D. Prestwich, Fertil. Steril.
83, 1275 (2005). doi:10.1016/j.fertnstert.2004.09.038
9. X.X. Yang, J.H. Chen, S.T. Liu, D. Guo, X.X. Zeng, Regul.
Toxicol. Pharmacol. 46, 211 (2006). doi:10.1016/j.yrtph.2006.07.
008
10. C. Sarıso
¨
zen, Y. Aktas¸, A. Mungan, E. Bilensoy, Eur. J. Pharm.
Sci. 32, S36 (2007). doi:10.1016/j.ejps.2007.05.076
11. S. Benita, J.P. Benoit, F. Puisieux, C. Thies, J. Pharm. Sci. 73,
1721 (1984). doi:10.1002/jps.2600731215
12. P.A. Webb, Analytical Methods in Fine Particle Technology
(Micromeritics Instrument Corporation, Norcross, GA, 1997),
p. 279
Fig. 5 Size distribution of PLA-MMC-SPC nanoparticles prepared
by a new single solvent evaporation method
Fig. 6 Release of MMC from particles prepared with different
methods. Prepared by a new single solvent evaporation method (black
square), prepared by a classical method (black circle)
Nanoscale Res Lett (2009) 4:732–737 737
123