Báo cáo hóa học: " Tin Oxide Nanowires: The Influence of Trap States on Ultrafast Carrier Relaxation" potx
Bạn đang xem bản rút gọn của tài liệu. Xem và tải ngay bản đầy đủ của tài liệu tại đây (575.89 KB, 6 trang )
NANO EXPRESS
Tin Oxide Nanowires: The Influence of Trap States on Ultrafast
Carrier Relaxation
Andreas Othonos Æ Matthew Zervos Æ
Demetra Tsokkou
Received: 31 January 2009 / Accepted: 14 April 2009 / Published online: 30 April 2009
Ó to the authors 2009
Abstract We have studied the optical properties and
carrier dynamics in SnO
2
nanowires (NWs) with an aver-
age radius of 50 nm that were grown via the vapor–liquid
solid method. Transient differential absorption measure-
ments have been employed to investigate the ultrafast
relaxation dynamics of photogenerated carriers in the SnO
2
NWs. Steady state transmission measurements revealed
that the band gap of these NWs is 3.77 eV and contains two
broad absorption bands. The first is located below the band
edge (shallow traps) and the second near the center of the
band gap (deep traps). Both of these absorption bands seem
to play a crucial role in the relaxation of the photogener-
ated carriers. Time resolved measurements suggest that the
photogenerated carriers take a few picoseconds to move
into the shallow trap states whereas they take *70 ps to
move from the shallow to the deep trap states. Furthermore
the recombination process of electrons in these trap states
with holes in the valence band takes *2 ns. Auger
recombination appears to be important at the highest flu-
ence used in this study (500 lJ/cm
2
); however, it has
negligible effect for fluences below 50 lJ/cm
2
. The Auger
coefficient for the SnO
2
NWs was estimated to be
7.5 ± 2.5 9 10
-31
cm
6
/s.
Keywords SnO
2
nanowires Á
Chemical vapour deposition Á Carrier dynamics Á
Differential absorption spectroscopy
Introduction
Tin oxide (SnO
2
) is considered an important wide-bandgap
n-type semiconductor which has received a great deal of
attention over the past few years due to its high transpar-
ency in the visible part of the spectrum and sensitivity to
certain gases which make it technologically important for
optoelectronic devices [1–6] and sensors [7]. In addition Sn
is readily available and cheaper compared to indium (In)
which is used for the growth of indium oxide (In
2
O
3
).
Furthermore, in recent years, the field of semiconducting
metal oxides has benefited a great deal from the develop-
ment of one-dimensional nanostructures such as nanowires
(NWs) and nanorods (NRs) due to their interesting prop-
erties arising from their small size [8, 9] and high surface-
to-volume ratio. In view of this, there has been growing
interest in the synthesis of SnO
2
NWs, the study of their
fundamental electronic and optoelectronic properties, and
finally device applications [10–13].
Despite the potential applications of SnO
2
NWs there
has been no detailed study of the fundamental, ultrafast
carrier relaxation mechanisms of the photogenerated car-
riers in this nanostructured material. Consequently, here we
investigate the carrier dynamics in SnO
2
NWs and obtain a
detailed understanding of the various relaxation mecha-
nisms and the influence of trap states using transient white
light absorption spectroscopy [14–16] with femtosecond
resolution. We find that the band gap of the SnO
2
NWs is
3.77 eV and contains two broad absorption bands, the first
of which is located below the band edge and is related to
A. Othonos (&) Á D. Tsokkou
Department of Physics, Research Centre of Ultrafast Science,
University of Cyprus, P.O. Box 20537, 1678 Nicosia, Cyprus
e-mail:
M. Zervos
Department of Mechanical and Manufacturing Engineering,
Materials Science Group, Nanostructured Materials and Devices
Laboratory, University of Cyprus, P.O. Box 20537,
1678 Nicosia, Cyprus
123
Nanoscale Res Lett (2009) 4:828–833
DOI 10.1007/s11671-009-9323-9
shallow trap states while the second is near the center of the
band gap due to deep trap states. Detailed transient mea-
surements revealed their energetic position, carrier relax-
ation times, and the importance of Auger recombination.
Experimental Procedure
The SnO
2
NWs were grown using an atmospheric pressure
chemical vapour deposition (APCVD) reactor which con-
sists of four mass flow controllers (MFC’s) and a horizontal
quartz tube furnace, capable of reaching a maximum tem-
perature of 1100 °C. Initially, approximately 0.2 g of fine
Sn powder (Aldrich, \150 lm, 99.5%) was weighed and
loaded into a quartz boat together with a square piece of
Si(111) which was coated with 0.5 nm of Au. The Au layer
was deposited via sputtering at a slow rate\5A
˚
/s using an
Ar plasma under a pressure \10
-4
mBar. The sample was
positioned a few mm downstream from the Sn and subse-
quently the boat was loaded into the reactor and positioned
directly above the thermocouple used to measure the heater
temperature at the centre of tube. After loading the boat at
room temperature (RT), Ar (99.999%) was introduced at a
flow rate of 500 standard cubic centimetres per minute
(sccm) for 5 min in order to purge the tube.
Following this the temperature was ramped to 800 °Cin
an Ar flow of 100 sccm at a rate of 30 °C/min. Upon
reaching T
G
, the flow of Ar was maintained at 100 sccm for
a further 90 min after which the tube was allowed to cool
down over at least an hour in an inert gas flow of Ar, 100
sccm. The sample was removed only when the temperature
was lower than 100 °C. For the optical measurements,
NWs were grown directly onto square pieces of quartz that
were coated with 0.5 nm of Au and had an area of
&6 9 6mm
2
. The morphology of the SnO
2
NWs was
examined with a TESCAN scanning electron microscope
(SEM) while the crystal structure and the phase purity of
the NWs were investigated using a SHIMADZU, XRD-
6000, X-ray diffractometer, and Cu Ka source. A scan of
h–2h in the range between 20° and 80° was performed for
the SnO
2
NWs that were grown on Si(111) and quartz.
In this study, we investigate the ultrafast dynamic
behavior of carriers in SnO
2
NWs following femtosecond
pulse excitation through the temporal behavior of differ-
ential absorption [14–16]. The experimental study was
carried out using an ultrafast amplifier system operating at
5 kHz. A self mode-locked Ti: Sapphire oscillator centered
at 796 nm and generating 45 fs pulses was the source of
short pulses. Approximately 1 mJ of amplified energy was
used to pump an Optical Parametric Amplifier (OPA)
providing ultrafast pulses in the UV range of the spectrum.
The rest of the energy from the amplifier was used to
generate 400 nm from a BBO crystal via second harmonic
generation and white light super continuum. The UV
femtosecond pulses from the OPA were used to excite the
nanowires given that the expected band gap of this material
is around 3.7 eV. A small part of the fundamental 796 nm
pulses were used to generate VIS-IR super continuum light
by focusing the beam on a 1 mm thick sapphire plate.
Similarly a super continuum light in the UV region of the
spectrum was also generated using 400 nm pulses. The
white light probe beam was used in a pump-probe non-
collinear geometry, with the pump beam been generated
from the OPA. To minimize the broadening of the laser
pulse, optical elements such as focusing mirrors were uti-
lized in the setup. The reflected and transmission probe
beams were separately directed onto their respective
detectors after passing through a band pass filter and thus
selecting the probe wavelength from the broad band white
light. The differential reflected and transmission signals
were measured using lock-in amplifiers with reference to
the optical chopper frequency of the pump beam. The
temporal variation in the photo-induced absorption was
extracted using the transient reflection and transmission
measurements, thus providing a means of monitoring the
carrier dynamics within the probing region [14].
Results and Discussion
Tin oxide NWs have been grown so far by a variety of
methods including thermal evaporation [17, 18], chemical
vapour deposition [19], and the VLS method using carbo-
thermal reduction of stannous oxide SnO at 880 °C for
90 min [20]. On the other hand, stannic oxide, SnO
2
NWs
have been grown by direct oxidation of Sn at 900 °C under
a flow of 10 sccm O
2
[21]. Similarly, Yang et al. obtained
SnO
2
NWs at 900 °C under a flow of 50 sccm O
2
[22]
while Wan et al. [23] obtained Sb doped SnO
2
NWs by
heating up the mixture at 20 °C/min up to 900 °C under a
flow of 500 sccm Ar with a trace of O
2
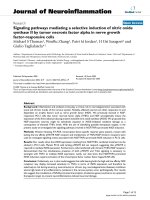
. A typical scanning
electron microscope (SEM) image of the SnO
2
NWs grown
on quartz is shown in Fig. 1 where it is apparent that a
large coverage has been obtained. The SnO
2
NWs have an
average diameter of 50 nm and lengths C5 lms. Further-
more the diameter of the SnO
2
NWs was found to be
uniform along their length. The growth of the SnO
2
NWs
occurs via the formation of Au nanoparticles (NPs) from
the thin layer of Au and the VLS mechanism. No NWs
were obtained on Si(111) or quartz alone. In addition we
have found that direct oxidation using a flow of O
2
during
growth hinders the formation of SnO
2
NWs due to the
oxidation of the Sn upstream, which melts at 232 °C and
which in turn reduces the vapour pressure, especially at low
temperatures i.e., T B 800 °C. While we obtained SnO
2
NWs at temperatures as low as 700 °C we find that the
Nanoscale Res Lett (2009) 4:828–833 829
123
optimum temperature for a high yield and uniform cover-
age is 800 °C. The optimum growth conditions are there-
fore close to those described by Wan et al. [23] who use
only a trace of oxygen under a larger flow of Ar i.e.,
500 sccm as opposed to 100 sccm used here. In our case
the formation of SnO
2
NWs is due to the oxygen admitted
into the APCVD reactor at RT prior to the temperature
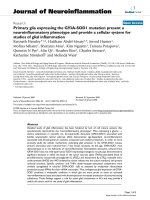
ramp. The SnO
2
NWs grown at the optimum temperature
i.e., T
G
= 800 °C on quartz are characterized by the (1 1 0),
(1 0 1), (2 1 1), (2 2 0), (3 1 0), and (3 0 1) peaks in the
X-ray diffraction spectrum shown in Fig. 2. Diffraction
peaks can be indexed to the tetragonal rutile structure of
SnO
2
[22, 24]. We should point out that the Al peaks
appearing in the XRD spectrum of Fig. 2 are due to the
sample holder.
Following the growth of SnO
2
NWs, we performed
steady state transmission measurements on the NWs grown
on quartz. Figure 3 shows the optical absorption of the
SnO
2
NWs covering a spectral range from the UV near to
the IR. Given that SnO
2
is a direct gap semiconductor, a plot
of the square of the absorption versus the incident photon
energy provides a measure of the bandgap which was
determined to be approximately 3.77 eV (see inset of
Fig. 3). Here we should point out that there appears to be a
broad absorption band around 4.2 eV which we believe to
be due to lower lying valance bands [25]. In addition to
Fig. 1 SEM images of SnO
2
NWs grown at 800 °C with an average
diameter of 50 nm
Fig. 3 Steady state transmission measurements carried out on SnO
2
NWs using a UV-IR spectrometer. The upper corner inset shows a
plot of the square of the absorption versus incident photon energy,
providing us with an estimate of the bandgap energy 3.77 eV. There
are two broad absorption bands below the bandgap referred to as
D.T.S—deep trap states and S.T.S.—shallow trap states
Fig. 2 XRD spectrum of the SnO
2
NWs grown at 800 °C on 0.5 nm
Au/quartz
830 Nanoscale Res Lett (2009) 4:828–833
123
determining the energy bandgap, the absorption spectrum
depicts several features within the energy gap of these NWs.
There appears to be a broad absorption band below the band
edge covering a range from 3.7 eV to 1.8 eV which may be
divided into two regions [26, 27]. The first broad absorption
band which starts just below the conduction-band edge of
the NWs is associated with impurity traps and these are
therefore commonly referred to as shallow trap states
(S.T.S.). The second band is referred to as the deep trap
states (D.T.S.) band generated by defects or/and surface
imperfections. Both of these absorption bands seem to play
a crucial role in the relaxation of photoexcited carriers on a
femtosecond timescale. Furthermore, there appears to be a
weak absorption band centred around 2.2 eV (see Fig. 3)
which corresponds to the well known Surface Plasmon
Resonance (SÁP.R.) of Au nanoparticles that are required as
catalysts for the formation of the SnO
2
NWs on quartz.
Figure 4 shows typical time resolved differential
absorption measurements for the SnO
2
NWs excited at
fluence of approximately 0.5 mJ/cm
2
with UV ultrafast
pulses at 4.00 eV (310 nm) and probed at different photon
probing energies ranging from UV to near IR. The x-axis on
this graph corresponds to the optical delay between the
pump and the probe pulse whereas the y-axis indicates the
induced absorption. The behaviour appears to be complex
and varies over the probing spectral range. For some of the
probing wavelengths there is a sharp drop in the absorption
reaching a minimum value and then followed by a slower
recovery toward equilibrium that takes hundreds of pico-
seconds, whereas in other cases there is a positive change in
the absorption with again a recovery towards equilibrium.
These observed changes in absorption are associated
with excitation of the SnO
2
NWs by photons whose energy
is larger than the bandgap energy which results in the
generation of non-equilibrium carriers. These non-equilib-
rium carriers will distribute themselves along energy states
that are normally unoccupied under equilibrium conditions.
The occupation of states (referred to as state filling) fol-
lowing an ultrafast laser pulse will appear as a reduction in
the absorption at the probing energy states. Clearly the
observed recovery of this negative absorption change will
be a direct measure of the time required by the photogen-
erated carriers to move out of the occupied states. Fur-
thermore, a positive change in the induced absorption is also
observed in the transient absorption measurements. This
phenomenon is mainly due to secondary excitation of the
photo-generated carriers by the probing photons from their
initial states to higher energy states. This ‘‘free-carrier
absorption’’ depends on the number of carriers present at the
initial states and the coupling coefficient between the two
energy bands. The temporal profile of this positive induced
absorption is again a direct measure of the presence of the
photo-generated carrier at the probing energy states.
We will begin the analysis of the data from the degen-
erate induced absorption measurements where the excita-
tion and probing photon energies were 4.00 eV. It is
important to point out that the observed sharp drop
reaching a minimum (state filling) is pulse width limited,
which is expected since we are probing the same energy
states that we are exciting. To obtain a better understanding
of the dynamics for the degenerate pump-probe data, we
have performed intensity measurements as seen in Fig. 5.
The normalized induced absorption measurements seen in
Fig. 5 clearly indicate that with increasing fluence there is a
faster recovery on the long time scale. This suggests that
Fig. 5 Time-resolved normalized differential absorption intensity
measurements of SnO
2
NWs excited with 4.0 eV and probe at 4.0 eV.
The different curves correspond to different incident absorption
fluence of the NWs. The inset shows the fits (solid lines) to the actual
differential absorption data (points) using a simple model which
includes multi-exponential decays and Auger recombination
Fig. 4 Time-resolved differential absorption of SnO
2
nanowires
excited with 4.00 eV photons (310 nm) at fluence of 500 lJ/cm
2
and probe at different photon energies ranging from UV to near IR
Nanoscale Res Lett (2009) 4:828–833 831
123
Auger recombination is a contributing factor at the fluence
used in this study. With decreasing fluence, Auger recom-
bination becomes less important, and for the NWs used in
this study at fluence less than 50 lJ/cm
2
, this contribution
may be considered negligible. A simple multi-exponential fit
to the experimental result at 50 lJ/cm
2
shows that a mini-
mum requirement of three exponential function is necessary
for a good fit to the data. The time constants obtained from
this fit were 2.4 ps (18%), 68 ps (22%), and 2.3 ns (60%). A
more detailed analysis of the experimental data was per-
formed using a simple differential equation model which
incorporated the above three exponential decay mechanisms
along with Auger recombination. Making use of the time
constants obtained for the lowest fluence utilized in these
experiments, where Auger recombination was negligible, it
was possible to obtain fits to the differential absorption data
at higher fluences. Relative good fits to the experimental data
(see inset Fig. 5) were obtained using an Auger coefficient of
7.5 ± 2.5 9 10
-31
cm
6
/s.
A schematic diagram of the various proposed relaxation
paths is shown in Fig. 6, to help the reader obtain a clear
picture of the dynamics. The first time constant (2.4 ps)
listed above, corresponds to mechanism 1, (see Fig. 6)
whereas the second time constant is associated with mech-
anism 2 or 3 through carrier saturation in the shallow trap
states. Given that no direct recombination was observed
from the conduction to the valence band which is corrobo-
rated by the absence of photoluminescence near 3.75 eV, we
believe that the long time constant is associated with the
carriers moving through the shallow and deep trap states.
Saturation of these states from the large number of carriers
will result in the decay of paths 4 and/or 5 being effectively
seen when probing above the band gap.
We should also point out that the fast decay component,
which is associated with mechanism 1 of the photo-gen-
erated carriers when they are moving into the shallow traps
states, appears to become slower with increasing fluence
(Fig. 5). This is most likely due to saturation of available
shallow trap states. Furthermore, in the above proposed
model, the holes generated near the C point will also relax
to the top of the valence band. However, the expected
relaxation within the valence band is much faster than the
multi-picosecond relaxation mechanisms shown in Fig. 6.
This is expected given the small excess kinetic energy
received by the holes during excitation.
Considering next the time-resolved absorption measure-
ments (Fig. 4) for probing photon energies below the band
gap energy (shallow traps) from 3.54 eV (350 nm) to 3.3 eV
(380 nm), we notice that although the maximum state filling
occurs very close to t = 0 (within the pulse width), there
appears to be a small drop and then a small rise after a few
picoseconds. This behavior is due to a small free-carrier
contribution which reduces the state filling contribution thus
artificially making this feature (‘‘dip’’) appear near the tip of
the maximum signal. This is clearly obvious when looking at
the differential absorption in Fig. 4 with decreasing probing
photon energy. The free-carrier ‘‘dip’’ increases with
increasing probing wavelength and eventually becomes the
main contributing factor at the longer probing wavelengths.
Furthermore, intensity measurements carried out over a
range of 500–50 lJ/cm
2
at the probing photon energy of
3.54 eV (350 nm) indicate that Auger recombination has a
noticeable effect only at the maximum fluence, however, at
fluence as low as *50 lJ/cm
2
, this effect becomes negli-
gible. A multi-exponential fit to the data shows a minimum
requirement of two exponential function for a good fit with
time constants of 72 ps (27%) and 2.08 ns (73%). Most
likely the fast time constant is associated with carriers
moving into the deep traps (path 3 in Fig. 6) whereas the
long decay is associated with recombination of the carriers
(path 5 in Fig. 6). Here we should point out that differential
absorption intensity measurements have also been carried
at other probing photon energies within the top shallow
trap states with similar results.
Considering the differential absorption measurements in
Fig. 4 for the longer probing wavelengths, we notice an
increase in free-carrier contribution. This contribution
becomes dominant for probing photon energies below
1.65 eV (750 nm), where no trap states can be reached
from the valence band thus excluding state filling. The
initial fast recovery component which is of the order of a
< 3.75 eV
E ~3.77 eV
g
Γ
C.B.
V.B.
Excitation
4.00 eV
Shallow trap
states
Deep trap
states
1
2
4
5
3
< 2.8 eV
Fig. 6 A schematic diagram of the energy band gap diagram of SnO
2
NWs with the various relaxation mechanisms following carrier
photoexcitation by an ultrafast pulse
832 Nanoscale Res Lett (2009) 4:828–833
123
few picoseconds seen in these measurements is attributed
to free-carrier contributions within the trap states.
Finally we should point out that due to the presence of
Au nanoparticles (NPs) which are required as a catalysts in
the formation of the SnO
2
NWs, transient absorption mea-
surements in the probing region 2.4–2.1 eV depict the well
known surface plasmon resonance of Au [28–30]. Time
resolved measurements outside the above probing spectral
region show no evidence of differential absorption signal
from Au. Furthermore, measurements with excitation pho-
tons having energy below the band gap of SnO
2
show signal
only at the probing region of the surface plasmon resonance.
Identical results were obtained when transient absorption
measurements were carried out on just the quartz substrate
coated with the 0.5 nm film of the Au catalyst. It appears
that the Au NPs required for the formation of the NWs have
no effect on probing the carrier dynamics in SnO
2
NWs
despite the strong plasmon resonance.
In conclusion, we have investigated the ultrafast
dynamic behavior of SnO
2
nanowires using above band
gap excitation UV femtosecond pulses. Transmission
measurements of the NWs provided us with an estimate of
the band gap at 3.75 eV and reveal broad absorption bands
below the band edge. These absorption bands appear to
play an important role in the relaxation of the photogen-
erated carriers in the NWs. Transient differential absorp-
tion measurements reveal the different pathways and time
constants associated with the relaxation of the photogen-
erated carriers. Measurements suggest that the photogen-
erated carriers take a few picoseconds to move into the
shallow traps states whereas it takes *70 ps to move from
the shallow to the deep trap states. Furthermore, recombi-
nation of electrons from these traps states with holes in the
valence band takes *2 ns. Auger recombination has a
contribution to the carrier dynamics at the highest fluence
used in this study (*500 lJ/cm
2
), however at fluence of
50 lJ/cm
2
Auger recombination appears to be negligible.
Transient absorption intensity measurements provided us
with an estimate of the Auger coefficient for the SnO
2
NWs
to be approximately 7.5 ± 2.5 9 10
-31
cm
6
/s.
Acknowledgments The study in this article was partially supported
by the research programs; EPYNE/0504/06, ERYAN/0506/04, and
ERYNE/0506/02 funded by the Cyprus Research Promotion Foun-
dation in Cyprus.
References
1. Z.M. Jarzebski, J.P. Marton, J. Electrochem. Soc. 123, 1990
(1976)
2. J. Maier, W. Gopel, J. Solid State Chem. 72, 293 (1988). doi:
10.1016/0022-4596(88)90032-1
3. K.P. Kumar, A.D. Domodaran, J. Mater. Sci. 24, 220 (1989). doi:
10.1007/BF00660957
4. S.A. Pianaro, P.R. Bueno, E. Longo, J.A. Varela, J. Mater. Sci.
Lett. 14, 692 (1995). doi:10.1007/BF00253373
5. P.I. Rovira, R.W. Collins, J. Appl. Phys. 85, 2015 (1999). doi:
10.1063/1.369496
6. N. Amin, T. Isaka, A. Yamada, M. Konagai, Sol. Energy Mater.
Sol. Cells 67, 195 (2001). doi:10.1016/S0927-0248(00)00281-6
7. N. Yamazoe, Sens. Actuators B Chem. 5, 7 (1991). doi:10.1016/
0925-4005(91)80213-4
8. Z.W. Pan, Z.R. Dai, Z.L. Wang, Science 291, 1947 (2001). doi:
10.1126/science.1058120
9. J. Zhang, J. Liu, J.L. Huang, P. Kim, C.M. Lieber, Science 274,
757 (1996). doi:10.1126/science.274.5288.757
10. Z.R. Dai, J.L. Gole, J.D. Stout, Z.L. Wang, J. Phys. Chem. B 106,
1274 (2002). doi:10.1021/jp013214r
11. Z. Liu, D. Zhang, S. Han, C. Li, T. Tang, W. Jin, X. Liu, B. Lei,
C. Zhou, Adv. Mater. 15, 1754 (2003). doi:10.1002/adma.
200305439
12. X.C. Jiang, Y.L. Wang, T. Herricks, Y.N. Xia, J. Mater. Chem.
14, 695 (2004). doi:10.1039/b313938g
13. M.J. Zheng, G.H. Li, X.Y. Zhang, S.Y. Huang, Y. Lei, L.D.
Zhang, Chem. Mater. 13, 3859 (2001). doi:10.1021/cm010084q
14. A. Othonos, J. Appl. Phys. 83, 1789 (1998). doi:10.1063/1.367
411
15. A. Othonos, E. Lioudakis, U. Philipose, H.E. Ruda, Appl. Phys.
Lett. 91, 241113 (2007). doi:10.1063/1.2825290
16. A. Othonos, M. Zervos, M. Pervolaraki, Nanoscale Res. Lett. 4,
122 (2009). doi:10.1007/s11671-008-9211-8
17. M.S. Arnold, P. Avouris, Z.W. Pan, Z.L. Wang, J. Phys. Chem. B
107, 659 (2003). doi:10.1021/jp0271054
18. X.Y. Xue, Y.J. Chen, Y.G. Liu, S.L. Shi, Y.G. Wang, T.H. Wang,
Appl. Phys. Lett. 88, 201907 (2006). doi:10.1063/1.2203941
19. S. Mathur, S. Barth, H. Shen, J C. Pyun, U. Werner, Small 1, 713
(2005)
20. A. Kar, J. Yang, M. Dutta, M.A. Stroscio, J. Kumari, M.
Meyyappan, Nanotechnology 20, 065704 (2009). doi:10.1088/
0957-4484/20/6/065704
21. Y.J. Ma, F. Zhou, L. Lu, Z. Zhang, Solid State Commun. 130,
313 (2004). doi:10.1016/j.ssc.2004.02.013
22. M R. Yang, S Y. Chu, R C. Chang, Sens. Actuators B 122
, 269
(2007). doi:10.1016/j.snb.2006.05.034
23. Q. Wan, E.N. Dattoli, W. Lu, Appl. Phys. Lett. 90, 222107
(2007). doi:10.1063/1.2743746
24. M. Chen, X. Xia, Z. Wang, Microelectron. Eng. 85, 1379 (2008).
doi:10.1016/j.mee.2008.01.027
25. F.J. Arlinghaus, J. Phys. Chem. Solids 35, 931 (1974). doi:
10.1016/S0022-3697(74)80102-2
26. R. Liu, Y. Chen, F. Wang, L. Cao, A. Pan, G. Yang, T. Wang, B.
Zou, Physica E 39, 223 (2007). doi:10.1016/j.physe.2007.04.009
27. D. Maestre, A. Cremades, J. Piqueras, J. Appl. Phys. 95, 3027
(2004). doi:10.1063/1.1647267
28. A. Devizis, V. Vaicikauskas, V. Gulbinas, Appl. Opt. 45,11
(2006). doi:10.1364/AO.45.002535
29. S. Link, C. Burda, Z.L. Wang, M.A. El-Sayed, J. Chem. Phys.
111, 3 (1999). doi:10.1063/1.479310
30. T.S. Ahmadi, S.L. Logunov, M.A. El-Sayed, J. Phys. Chem. 100,
20 (1996). doi:10.1021/jp960484e
Nanoscale Res Lett (2009) 4:828–833 833
123