Báo cáo hóa học: " Synthesis, Characterization, and Microwave Absorption Property of the SnO2 Nanowire/Paraffin Composites" doc
Bạn đang xem bản rút gọn của tài liệu. Xem và tải ngay bản đầy đủ của tài liệu tại đây (511.37 KB, 6 trang )
NANO EXPRESS
Synthesis, Characterization, and Microwave Absorption Property
of the SnO
2
Nanowire/Paraffin Composites
H. T. Feng Æ R. F. Zhuo Æ J. T. Chen Æ D. Yan Æ
J. J. Feng Æ H. J. Li Æ S. Cheng Æ Z. G. Wu Æ
J. Wang Æ P. X. Yan
Received: 18 June 2009 / Accepted: 12 August 2009 / Published online: 18 September 2009
Ó to the authors 2009
Abstract In this article, SnO
2
nanowires (NWs) have
been prepared and their microwave absorption properties
have been investigated in detail. Complex permittivity and
permeability of the SnO
2
NWs/paraffin composites have
been measured in a frequency range of 0.1–18 GHz, and
the measured results are compared with that calculated
from effective medium theory. The value of maximum
reflection loss for the composites with 20 vol.% SnO
2
NWs
is approximately -32.5 dB at 14 GHz with a thickness of
5.0 mm.
Keywords Nanowires Á Permittivity Á
Microwave absorption Á Effective medium theory
Introduction
In recent years, electromagnetic (EM) wave absorbing
materials have aroused great interest because of more and
more civil, commercial, and military applications in elec-
tromagnetic interference (EMI) shielding and radar cross
section (RCS) reduction in the gigahertz (GHz) band range
[1, 2]. Traditionally, EM wave absorbing materials, which
are composed of magnetic metals or alloys particles, are
restricted in application because of high specific gravity
and formulation difficulty. It is hence desirable to have
microwave absorbing materials that are lightweight,
structurally sound, and flexible and show good microwave-
absorbing ability in a wide frequency range. In terms of
these criteria, one-dimensional nanostructures, which have
a tremendous surface area and more dangling bond atoms
on surface, appear to be good candidates [3]. Recently,
carbon nanotubes (CNTs) [4–6], magnetic-particle-doped
CNTs [7], magnetic nanowires (NWs) [8], nanostructured
ZnO [9, 10], and Mn
3
O
4
[11] were intensively studied and
found to be promising microwave absorbing materials.
Many groups found ZnO nanomaterials with different
morphologies show excellent microwave absorption
behavior, and partly attributed to its semiconductor char-
acter [9, 10, 12]. Microwave absorption property of ZnO
has been investigated thoroughly in previous reports. In
this work, microwave absorption behavior of another
important semiconductor SnO
2
was investigated in detail.
SnO
2
has been paid attention in a variety of applications
in chemical, optical, electronic, and mechanical fields, due
to its unique high conductivity, chemical stability, photo-
luminescence, and gas sensitivity [13–16]. However, the
research on its dielectric property and microwave absorp-
tion has not been reported. Here, both the complex per-
mittivity (e
r
= e
0
- je
00
) and permeability (l
r
= l
0
- jl
00
)
of the SnO
2
NWs/paraffin composites with different load-
ing proportion were studied, and the measured results are
compared with calculation results from effective medium
theory (EMT). The effective permittivity of composite has
linear increase with increment of SnO
2
NWs proportion.
Their microwave reflection loss curves were simulated
according to transmission line theory. The excellent
absorbing properties of the NW–paraffin were revealed,
and the relationship between absorption property and the
H. T. Feng Á R. F. Zhuo Á J. T. Chen Á D. Yan Á
J. J. Feng Á H. J. Li Á S. Cheng Á Z. G. Wu Á J. Wang Á
P. X. Yan (&)
School of Physical Science and Technology, Lanzhou
University, 730000 Lanzhou, China
e-mail:
P. X. Yan
State Key Laboratory of Solid Lubrication, Lanzhou Institute
of Chemistry and Physics, Chinese Academy of Science,
730000 Lanzhou, China
123
Nanoscale Res Lett (2009) 4:1452–1457
DOI 10.1007/s11671-009-9419-2
proportion between SnO
2
NWs and paraffin were also
investigated.
Experimental Section
SnO
2
NWs were prepared by a normal chemical vapor
deposition (CVD) method. Briefly, a small amount of Sn
powder (purity: C99%, about 3 g) was placed in an alu-
mina crucible. A porous aluminum oxide (AAO) template
coated with Au film of about 10 nm was used as substrate,
which was positioned about 5 cm downstream from the
precursor. Then, the crucible was put into a quartz tube that
was located at the center of an electronic resistance fur-
nace. One end of the quartz tube was connected with a
mass-flow controller, which introduces a constant mixed
carrier gas flow of Ar and O
2
at a flow rate of 100 and
10 sccm, respectively; the other end of the quartz tube was
evacuated by a pump. The furnace was heated to 1,000 °C
and kept for 1 h. After the furnace was cooled naturally
down to room temperature, white wool-like products in
high yield were found on the substrate.
The powder samples were characterized by high reso-
lution transmission electron microscopy (TEM) and
selected-area electron diffraction (SAED) on a JEM-2010
transmission electron microscope operated at 100 kV.
Field emission scanning electron microscopy (FESEM)
observation was performed on a Hitachi S-4800 field
emission scanning electron microscope. The products were
mixed with paraffin wax with different volume fraction and
pressed into toroidal-shaped samples (u
out
= 7 mm,
u
in
= 3.04 mm) for microwave absorption tests. The real
part and imaginary part of the complex permittivity and
permeability of the samples were measured using the
transmission/reflection coaxial method by an Agilent
E8363B vector network analyzer working at 0.1–18 GHz.
Results and Discussion
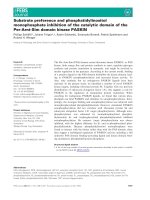
Figure 1 shows the SEM and TEM images of the as-syn-
thesized SnO
2
NWs. The diameters of the SnO
2
NWs are
about 100 nm, and the lengths are up to micron scale. From
TEM image (Fig. 1c) and HRTEM image (Fig. 1d), as-
synthesized SnO
2
NWs are well crystallized and have
smooth surfaces.
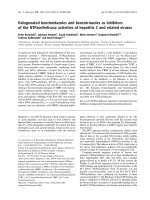
Figure 2 is the typical SEM image of the SnO
2
NWs/
paraffin composite with 50 vol.% loading. From Fig. 2a, it
is clear that the inclination angle of these NWs (indicated
with arrows) in the composites is different, leading to the
randomly oriented NWs in the composites, and the volume
proportion of NWs close to the surface is much lower than
50%, which is lower than that inside the composites
(indicated with ellipse in a gap). As paraffin is EM wave
transparent, EM waves can easily penetrate into the
microwave absorbing materials with this structure.
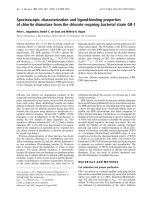
We independently measured the relative complex per-
mittivity and permeability of the SnO
2
NWs/paraffin com-
posites in a frequency range of 2–18 GHz (Fig. 3a–c) using
the T/R coaxial line method as described in the experimental
section. The complex permittivity of composite versus
frequency is shown in Fig. 3a. One can see a decrease of e
0
and an increase of e
00
with frequency rise. It reveals that the
real part e
0
exhibits an abrupt decrease from 23 to 18 at the
0–4-GHz range, an approximate constant over 4–12 GHz
and a broad peak at 12–18 GHz. Meanwhile, the imaginary
part increases from 0.1 to 0.5 in the whole frequency range.
As shown in Fig. 3b of complex permeability, a decrease of
l
0
from 1.2 to 1 and an imaginary part close to 0 can be
related to the absence of ferromagnetic components in the
sample. The tangent of dielectric and magnetic loss can be
expressed as tan d
E
= e
00
/e
0
and tan d
M
= l
00
/l
0
, respec-
tively. From Fig. 3a–b, it can be seen that tan d
E
increases
from 0.1 to 0.5 in the whole frequency range, while tan d
M
is below 0.1. It suggests that microwave absorption
enhancement of composite results mainly from dielectric
loss rather than magnetic loss.
According to the transmission line theory [17], the
normalized input impedance Z
in
of a microwave absorber is
given by
Z
in
¼
ffiffiffiffiffi
l
r
e
r
r
tanh j
2p
c
ffiffiffiffiffiffiffiffi
l
r
e
r
p
fd
!
ð1Þ
where l
r
and e
r
are the relative permeability and
permittivity of the composite medium, c the velocity of
EM waves in free space, f the frequency of the microwave,
and d the thickness of the absorber. The reflection loss is
related to Z
in
as
RLðdBÞ¼20 log
Z
in
À Z
0
Z
in
þ Z
0
; ð2Þ
where Z
0
¼
ffiffiffiffiffiffiffiffiffiffiffi
l
0
=
e
0
p
is the characteristic impedance of free
space.
Figure 3c shows the microwave reflection loss of com-
posite with 50 vol.% loading at different composite
thicknesses. With matching thickness t
m
= 7 mm, the
maximum reflection loss R
max
is ca. -16 dB at 7 GHz. At
t = 2 mm, the bandwidth corresponding to reflection loss
below -10 dB (i.e., over 90% microwave absorption) is
higher than 1.5 GHz.
It can be seen that the sample of 50% proportion does
not exhibit good ability of microwave absorption com-
pared with the results of ZnO and CNTs [5–11], in order to
find optimal loading proportion and to investigate the
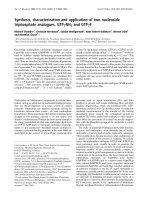
intrinsic reasons for the absorption. Figure 4a, b show the
real part e
0
and the imaginary part e
00
of the permittivity of
Nanoscale Res Lett (2009) 4:1452–1457 1453
123
the composite samples with different contents of SnO
2
NWs. It can be seen that the values of both real part e
0
and
imaginary part e
00
of the permittivity increase significantly
with SnO
2
NWs loading increasing, and the variation curve
of every contents has the similar shape with that of
50 vol.%. Figure 4c–f shows the microwave reflection loss
of composite with different loading proportion at different
composite thicknesses. Composite of 10, 20, 30, and
40 vol.% loading proportion have their matching thickness
t
m
= 7, 5, 7, 7 mm and the approximate maximum
reflection loss R
max
=-27.5, -32.5, -25, -18 dB. It can
be found that the microwave absorption property of the
SnO
2
NW/paraffin composites becomes better with the
decrease of proportion of SnO
2
NWs and get optimal
proportion at 20% when the best EM parameter matching
realizes. In particular, the composite sample of 40 vol.%
exhibits enhanced microwave absorption with an absorber
thickness of 2 mm, which is same as that of 50 vol.%
shown in Fig. 3c.
The dominant dipolar polarization and the associated
relaxation phenomena of SnO
2
constitute the loss mecha-
nisms. Composite materials, in which semiconductor NWs
are coated with a dielectric nanolayer, introduce additional
interfaces and more polarization charges at the surface [18,
19]. The interfacial polarization is an important polariza-
tion process and the associated relaxation will also give rise
to a loss mechanism. It is reasonable to expect that the
dielectric loss may be due to significant contributions of the
interfacial polarization. It is well known that SnO
2
NWs
have excellent gas sensitivity and can form space charge
layer of several nanometers on the surface. Molecular
dipoles formed at the NWs surface interact with the
microwave field, leading to some absorption losses through
heating [18].
Fig. 1 a and b Different
magnification FESEM images
of SnO
2
NWs. c TEM image
and d HR-TEM image of SnO
2
NWs, the inset is the SAED
pattern
Fig. 2 a, b The SEM images of
the SnO
2
NWs–paraffin
composite with 50 vol.%
loading
1454 Nanoscale Res Lett (2009) 4:1452–1457
123
From Fig. 4c–f, it can be seen that composite of 10, 20,
30, 40 vol.% loading proportion have their approximate
reflection loss R
max
at 11.5, 10, 8.5, 8 GHz at thickness
t = 7 mm. With the increase of proportion in the nano-
composites, the matching frequency tends to shift to the
lower frequency region, and similar results have been
gained on CNTs [1, 2] and ZnO NWs [9]. Fan et al. pointed
out that with an increase of CNT content in composite, the
electric field of short-distance resonance multipoles leads
to dominance of reflection property rather than absorption
property. They reported that e increase with increasing
CNT concentration, resulting in a shift of reflectivity peak
toward lower frequency [2]. The revelation is important
because it suggests that the range of absorption frequency
can be easily tuned by changing the SnO
2
NWs content of
composites. Thus, wideband absorption could be achieved
by coupling SnO
2
NWs/paraffin layers of different SnO
2
NWs contents. So, it is of great significance to calculate
real and imaginary part of complex permittivity at different
loading proportion of SnO
2
NWs.
Composites consisting of metallic or semiconductor
particles embedded in a dielectric matrix have been widely
used and studied for years [20–22], but their physical
properties are still not fully understood or unveiled. It
would be extremely useful to predict the properties of
composites once the properties of constituent components
are known and extract the properties of constituents from
the measured composite properties. If the composites are
isotropic and homogeneous, this work could be done with
EMTs. Classical EMTs are usually based on an equivalent
dipole representation of the composite. The effective
macroscopic EM properties of the composites are modeled
on the effective dipole moments per unit volume, which is
determined by the intrinsic dipole moment contributions of
each constituent and their relative volume concentration
[23]. Among EMTs, the Bruggeman (BG) formula is the
most commonly used. In this work, the complex permit-
tivity e of SnO
2
NWs/paraffin composites at microwave
frequencies has been studied in the framework of the BG
formula.
p
Um ÀUe
Um þ2Ue
þ 1 ÀpðÞ
Ui ÀUe
Ui þ2Ue
¼ 0: ð3Þ
From formula (3), one can calculate Ue, Um as follows:
Um ¼ Ue
3p À2ðÞUi þ2Ue
Ui þ 3p À1ðÞUe
; ð4Þ
Ue ¼
1
4
3Um À6ðÞp þ 4 ÀUmðÞ
þ
ffiffiffiffiffiffiffiffiffiffiffiffiffiffiffiffiffiffiffiffiffiffiffiffiffiffiffiffiffiffiffiffiffiffiffiffiffiffiffiffiffiffiffiffiffiffiffiffiffiffiffiffiffiffiffiffiffiffiffiffiffiffiffiffiffiffiffi
3Ump À6p þ4 À UmðÞ
2
þ8UiUm
q
#
:
ð5Þ
U is either of the real part and imaginary part of the
complex permittivity e and complex permeability l. Ue,
Ui, Um correspond to the parameter of the effective med-
ium, the insulator, and the semiconductor particles,
respectively. p is the volume fractions of SnO
2
NWs in the
components. The insulator is paraffin in our experiment,
real part and imaginary part of the complex permittivity are
2 and 0.01, respectively, as shown in Fig. 4a, b
Fig. 3 a The real part e
0
, b the
imaginary part e
00
of the
permittivity, and c reflection
loss of the composite samples
with 50 vol.% of SnO
2
NWS
Nanoscale Res Lett (2009) 4:1452–1457 1455
123
Fig. 5 Comparison between the
calculated and measured
effective permittivity: a real
part and b imaginary part of the
composite at 100 MHz versus
the volume fraction of SnO
2
NWs
Fig. 4 a The real part e
0
and b
the imaginary part e
00
of the
permittivity and c–f reflection
loss of the composite samples
with different content of SnO
2
NWs
1456 Nanoscale Res Lett (2009) 4:1452–1457
123
Using the BG equation, the effective permittivity of the
SnO
2
NWs/paraffin composite at 100 MHz was calculated
over a wide particle volume fraction range of 10–50% and
was compared to the measured values in Fig. 5. Prior to the
calculation, the permittivity of SnO
2
NWs at 100 MHz was
extracted from the measured effective permittivity of a
mixture sample with SnO
2
NWs of 40 vol.% using Eq. 4.
The real and the imaginary parts of the permittivity
increase with the volume concentration. Our measured
results show approximately a homogeneous increase across
different proportion. BG formula predicts a distinct
increase happening at around 30 vol.%, which results from
the semiconductor–insulator transition at the percolation
threshold [3], and a linear increase after percolation, which
is the same as measured results but with a different slope.
BG formula is often used in the case of spherical inclusions
whose diameter d is much smaller than the incident
wavelength k. In our experiment, SnO
2
NWs are around
100 nm in width and up to micron scale in length; the
aspect ratio is so large that error may be brought and result
in the difference in slope. As BG formula has difficulty in
dealing with composite with percolation, we find that EMT
can be only used in qualitative analyses, and leads to large
error in quantitative analyses.
Conclusion
In conclusion, SnO
2
NWs have been prepared by a CVD
method and their microwave absorption properties have
been investigated in detail. Complex permittivity and
permeability of the SnO
2
nanostructures and paraffin com-
posites have been measured in a frequency range of
0.1–18 GHz, the value of both real part e
0
and imaginary part
e
00
of the permittivity increase significantly with increasing
SnO
2
NWs loading, and the variation curve of every content
has the similar shape. The value of maximum reflection loss
for the composites with 20 vol.% SnO
2
NWs is -32.5 dB at
14 GHz with a thickness of 5.0 mm. The measured results
are compared with results calculated with EMT. We find that
BG equation can be only used in qualitative analyses, and
leads to large error in quantitative analyses.
References
1. Z.F. Liu, G. Bai, Y. Huang, F.F. Li, Y.F. Ma, T.Y. Guo, X.B. He,
X. Lin, H.J. Gao, Y.S. Chen, J. Phys. Chem. C 111, 13696 (2007)
2. N.J. Tang, W. Zhong, C. Au, Y. Yang, M.G. Han, K.J. Lin, Y.W.
Du, J. Phys. Chem. C 112, 19316 (2008)
3. J.X. Qiu, H.G. Shen, M.Y. Gu, Powder Technol. 154, 116 (2005)
4. A. Wadhawan, D. Garrett, J.M. Perez, Appl. Phys. Lett. 83, 2683
(2003)
5. K.R. Paton, A.H. Windle, Carbon 1935, 46 (2008)
6. D.A. Makeiff, T. Huber, Synth. Met. 497, 156 (2006)
7. Z.J. Fan, G.H. Luo, Z.F. Zhang, L. Zhou, F. Wei, Mater. Sci. Eng.
B 132, 85 (2006)
8. A. Encinas, L. Vila, M. Darques, J.M. George, L. Piraux,
Nanotechnology 18, 065705 (2007)
9. R.F. Zhuo, H.T. Feng, J.T. Chen, D. Yan, J.J. Feng, H.J. Li, B.S.
Geng, S. Cheng, X.Y. Xu, P.X. Yan, J. Phys. Chem. C 112, 11767
(2008)
10. R.F. Zhuo, H.T. Feng, Q. Liang, J.Z. Liu, J.T. Chen, D. Yan, J.J.
Feng, H.J. Li, S. Cheng, B.S. Geng, X.Y. Xu, J. Wang, Z.G. Wu,
P.X. Yan, G.H. Yue, J. Phys. D Appl. Phys. 41, 185405 (2008)
11. D. Yan, S. Cheng, R.F. Zhuo, J.T. Chen, J.J. Feng, H.T. Feng,
H.J. Li, Z.G. Wu, J. Wang, P.X. Yan, Nanotechnology 20,
105706 (2009)
12. X.G. Liu, D.Y. Geng, H. Meng, P.J. Shang, Z.D. Zhang, Appl.
Phys. Lett. 92, 173117 (2008)
13. Y. Wang, J.Y. Lee, T.C. Deivaraj, J. Phys. Chem. B 108, 13589
(2004)
14. T. Gao, T. Wang, Mater. Res. Bull. 43, 836 (2008)
15. J.T. Chen, J. Wang, F. Zhang, D. Yan, G.A. Zhang, R.F. Zhuo,
P.X. Yan, J. Phys. D Appl. Phys. 41, 105306 (2008)
16. J. Mu, L.Y. Liu, S.Z. Kang, Nanoscale Res. Lett. 2, 100 (2007)
17. Y. Natio, K. Suetake, IEEE Trans. Microw. Theory Technol. 19,
65 (1971)
18. Y.J. Chen, M.S. Cao, T.H. Wang, Q. Wan, Appl. Phys. Lett. 84,
26 (2004)
19. M.S. Cao, X.L. Shi, X.Y. Fang, H.B. Jin, Z.L. Hou, W. Zhou,
Appl. Phys. Lett. 91, 203110 (2007)
20. B. Meng, B.D.B. Klein, J.H. Booske, R.F. Cooper, Phys. Rev. B
53, 12777 (1996)
21. B. Spivak, F. Zhou, M.T.B. Monod, Phys. Rev. B 51, 13226
(1995)
22. S.A. Studenikin, M. Potemski, A. Sachrajda, M. Hilke, L.N.
Pfeiffer, K.W. West, Phys. Rev. B 71, 245313 (2005)
23. P. Chen, R.X. Wu, T.E. Zhao, F. Yang, J.Q. Xiao, J. Phys. D
Appl. Phys. 38, 2302 (2005)
Nanoscale Res Lett (2009) 4:1452–1457 1457
123