Báo cáo hóa học: " Research Article Origins of Stochasticity and Burstiness in High-Dimensional Biochemical Networks" docx
Bạn đang xem bản rút gọn của tài liệu. Xem và tải ngay bản đầy đủ của tài liệu tại đây (1013.54 KB, 14 trang )
Hindawi Publishing Corporation
EURASIP Journal on Bioinformatics and Systems Biology
Volume 2009, Article ID 362309, 14 pages
doi:10.1155/2009/362309
Research Article
Origins of Stochasticity and Burstiness in High-Dimensional
Biochemical Networks
Simon Rosenfeld
Division of Cancer Prevention (DCP), National Cancer Institute, EPN 3108, 6130 Executive Blvd, Bethesda, MO 20892, USA
Correspondence should be addressed to Simon Rosenfeld,
Received 5 February 2008; Accepted 24 April 2008
Recommended by D. Repsilber
Two major approaches are known in the field of stochastic dynamics of intracellular biochemical networks. The first one places
the focus of attention on the fact that many biochemical constituents vitally important for the network functionality may be
present only in small quantities within the cell, and therefore the regulatory process is essentially discrete and prone to relatively
big fluctuations. The second approach treats the regulatory process as essentially continuous. Complex pseudostochastic behavior
in such processes may occur due to multistability and oscillatory motions within limit cycles. In this paper we outline the third
scenario of stochasticity in the regulatory process. This scenario is only conceivable in high-dimensional highly nonlinear systems.
In particular, we show that burstiness, a well-known phenomenon in the biology of gene expression, is a natural consequence of
high dimensionality coupled with high nonlinearity. In mathematical terms, burstiness is associated with heavy-tailed probability
distributions of stochastic processes describing the dynamics of the system. We demonstrate how the “shot” noise originates
from purely deterministic behavior of the underlying dynamical system. We conclude that the limiting stochastic process may be
accurately approximated by the “heavy-tailed” generalized Pareto process which is a direct mathematical expression of burstiness.
Copyright © 2009 Simon Rosenfeld. This is an open access article distributed under the Creative Commons Attribution License,
which permits unrestricted use, distribution, and reproduction in any medium, provided the original work is properly cited.
1. Introduction
High-dimensional biochemical networks are the integral
parts of intracellular organization. The most prominent roles
in this organization belong to genetic regulatory networks
[1] and protein interaction networks [2]. Also, there are
numerous other subsystems, such as metabolic [3]and
glycomic networks [4], to name just a few. All these networks
have several important features in common. First, they
are highly diverse, that is, contain numerous (up to tens
of thousands) different types of molecules. Second, their
dynamics is constrained by a highly structured, densely tan-
gled intracellular environment. Third, their constituents are
predominantly macromolecules interacting in accordance
with the laws of thermodynamics and chemical kinetics.
Fourth, all these networks may be called “unsupervised”
in the sense that they do not have an overlying regulatory
structure of a nonbiochemical nature. Although the term
“regulation” is frequently used in the description of cellular
processes, its actual meaning is different from that in the
systems control theory. In this theory, the regulatory signal
produced by the controller and the way it directs the system
are of a different physical nature than the functions of the
system under control. In contrast, the intra- and intercellular
regulations are of a biochemical nature themselves (e.g.,
protein signal transduction [5]); therefore, the subdivision of
a system on the regulator and the subsystem-to-be-regulated
is largely nominal. In order to be a stabilizing force, a bio-
chemical “controller” should first be stable itself. Logically,
such a subdivision serves as a way of compartmentalizing
a big biochemical system into relatively independent parts
for the simplification of analysis. However, in biology this
compartmentalization is rarely unambiguous, and it is never
known for sure what regulates what. An indiscriminate
usage of the concepts and terminology borrowed from
the systems control theory obscures the fundamental fact
that intracellular functionality is nothing else than a vast
system of interconnecting biochemical reactions between
billions of molecules belonging to tens of thousands of
molecular species. Therefore, studying general properties of
such large biochemical systems is of primary importance for
understanding functionality of the cell.
2 EURASIP Journal on Bioinformatics and Systems Biology
In this work, the focus of attention is placed on the
dynamical stability of biochemical networks. First, we show
that stringent requirements of dynamical stability have very
little chance to be satisfied in the biochemical networks of
sufficiently high order. The problem we encounter here is
essentially of the same nature as in now classic work by
May [6] where the famous question “will a large complex
system be stable?” has been discussed in ecological context.
Second, we show that a dynamically unstable system does not
necessarily end its existence through explosion or implosion,
as prescribed by simple linear considerations. It is possible
that such a system would reside in a dynamic state similar
to a stationary or slowly evolving stochastic process. Third,
we conjecture that the motion in a high-dimensional system
of strongly interacting units inevitably includes a pattern of
“burstiness,” that is, sporadic changes of the state variables in
either positive or negative directions.
In biology, burstiness is an experimentally observed phe-
nomenon [7–10], and a variety of theoretical approaches
have been developed to understand its origins. Two of
them have been especially successful in explanation of the
phenomenon of burstiness. In the first one, the focus of
attention is placed on the fact that many biochemical
constituents vitally important for the network functionality
may be present only in small quantities within the cell,
and therefore, the regulatory process is essentially discrete
and prone to relatively big fluctuations [11, 12]. The
second approach treats the regulatory process as essentially
continuous. Complex pseudostochastic behavior in such
processes may occur due to multistability and oscillatory
motions within limit cycles. An extensive summary of this
line of theoretical works may be found in [13, 14]. There are
numerous other approaches of various levels of mathemat-
ical sophistication and adherence to biological realities that
attempt to explain the phenomenon of burstiness. It is far
beyond the goals of this work to provide a detailed review.
Recently published papers [15, 16]aregoodsourcesofmore
comprehensive information. In summary, the origins of
stochasticity are so diverse that none of the existing theories
may claim to be exhaustive. Each set of unmodeled realities
in the system being modeled manifests itself as an additional
stochastic force or noise. Stochasticity occurs at all levels
of intracellular organization, from a single biomolecule,
through the middle-size regulatory units, all the way up to
tremendously large and complex systems such as GRN; each
of these contexts requires a special tool for mathematical
conceptualization.
The goal of this paper is to present a novel scenario
of bursting, in addition to the existing ones. Unlike the
approaches mentioned above, the mechanism we consider
does not require any special conditions for its realization.
Rather, it is seen as a ubiquitous property of any high-
dimensional highly nonlinear dynamical system, including
biochemical networks. The mechanism of stochastic behav-
ior proposed here allows for some experimentally verifiable
predictions regarding global parameters characterizing the
system.
Interrelations between the stochastic and deterministic
descriptions of multidimensional nonlinear systems, in gen-
eral, and the systems of chemical reactions, in particular,
have been given considerable attention in the literature [17–
20]. It often happens, however, that an approach, being mul-
tidimensional theoretically, stumbles upon insurmountable
mathematical difficulties in applications. As a result, there is
often a big gap between the sophistication and generality of a
theory, on one hand, and simplicity and particularity of the
applications, on the other. A big promise in studying really
large systems is seen in computational models, the ones that
are capable of dealing with dozens [21] or even hundreds
[22–24] of simultaneous biochemical constituents. These
models, however, are necessarily linked to particular systems
with all the specifics of their functionality and experimentally
available parameterization. Due to these narrowly focused
designs, computational models are rarely generalizable to
other systems with different parameterizations; hence, com-
mon features of all such systems are not readily detectable. In
addition, so far even big computational models are still too
small to be able to capture global properties and patterns of
behavior of really big biochemical networks, such as GRN.
The novelty of our approach consists of direct utilization
of the property of the system to be “asymptotically diverse”;
the bigger the system, the better the approximation we utilize
is working. In the biochemical context, the term “asymp-
totically diverse” does not simply mean that the number
of molecules in the system is very large; more importantly,
it means that the number of individual molecular species
is also very large, and that each of these species requires
an individual equation for the description of its dynamics.
In this paper, our goal is not in providing a detailed
mathematical analysis of any particular biochemical system;
rather it is to envision some important global properties
and patterns of behavior inherent in the entire class of
such systems. The novel message we intend to convey is
that burstiness is a fundamental and ubiquitous property of
asymptotically diverse nonlinear systems (ADNS). Of course,
it would be an oversimplification to ascribe the burstiness in
gene expression solely to the property of burstiness of ADNS.
Nevertheless, there is little doubt that many subsystems in
intracellular dynamics indeed may be seen as ADNS [25],
and as such they may share with them, at least in part, the
property of burstiness.
The problem of transition from deterministic to chaotic
dynamics in multidimensional systems has long history
in physics and mathematics, and a number of powerful
techniques have been proposed to solve it [26–29]. It is rarely,
however, the case that full strength of these techniques can
be actually applied to real systems; far reaching simplifica-
tions are unavoidable. Preliminary qualitative exploration
supported by partial theoretical modeling and simulation is
a necessary step towards developing a theoretically sound
yet mathematically tractable approximation. This paper,
together with [30], is intended to provide such an explo-
ration.
2. Nonlinear Model and State of Equilibrium
A natural basis for the description of chemical kinetics in
a multidimensional network is the power-law formalism,
EURASIP Journal on Bioinformatics and Systems Biology 3
also known under the name S-systems [24, 31–33]. Being
algebraically similar to the law of mass action (LMA), S-
systems proved to be an indispensable tool in the analysis
of complex biochemical systems and metabolic pathways
[34]. A useful property of S-systems is that S-functions are
the “universal approximators,” that is, have the capability
of representing a wide range of nonlinear functions under
mild restrictions on their regularity and differentiability.
S-functions are found to be helpful in the analysis of
genome-wide data, including those derived from microarray
experiments [35, 36]. However, the most important fact in
the context of this work is that in the vicinity of equilibrium
any nonlinear dynamical system may be represented as an
S-system [37]. Unlike mere linearization, which replaces
a nonlinear system by the topologically isomorphic linear
one, the S-approximation still retains essential traits of
nonlinearity but often is much easier to analyze.
In the S-system formalism, equations of chemical kinet-
ics may be recast in the following form:
dx
i
dt
= F
i
x
1
, , x
n
=
α
i
N
m=1
x
p
im
m
−β
i
N
m=1
x
q
im
m
,(1)
where α
i
, β
i
are the rates of production and degradation, and
p
im
, q
im
are the stoichiometric coefficients in the direct and
inverse reactions, respectively. Depending on the nature and
complexity of the system under investigation, the quantities
{x
i
}, i = 1, , N may represent various biochemical con-
stituents participating in the process, including individual
molecules or their aggregates. There is no unique way of
representing the biochemical machinery in mathematical
form: depending on the level of structural “granularity”
and temporal resolution, the same process may be seen
either as an individual chemical reaction or as a complex
system of reactions. For example, on a certain level of
abstraction, the process of transcription may be seen as an
individual biochemical reaction between RNA polymerase
and DNA molecule, whereas a more detailed view reveals
a complex “dance” involving hundreds of elemental steps,
each representing a separate chemical reaction [38, 39].
Formally, the system of S-equations (1) is analogous to the
equations of chemical kinetics in which each constituent is
generated by only one direct and only one reverse reaction.
Reality of large biochemical systems is, of course, far more
complex. In particular, there may be several competitive
reactions producing and degrading the same constituents but
following different intermediate pathways. For these cases, a
more appropriate form of the equations would be
dx
i
dt
= F
i
x
1
, , x
n
=
L
i
n=1
α
ni
N
ni
m=1
x
p
nim
m
−
M
i
n=1
β
ni
N
ni
m=1
x
q
nim
m
,
(2)
known as the law of generalized mass action (GMA).
Here L
i
, M
i
are the numbers of concurrent reactions of
production and degradation, α
ni
, β
ni
are the matrices of
rates, and p
nim
, q
nim
are the tensors of stoichiometric coef-
ficients. However, in principle, this more complex system is
reducible to form (1) by appropriate redefinition of chemical
constituents [40]. Even more important is the fact that
any nonlinear dynamical system, after a certain chain of
transformations, may be represented in the form (1); for this
reason this form is sometimes called “a canonical nonlinear
form” (see [32], and also [41, 42]). At last, as it has been
recently shown in [37], in the vicinity of equilibrium, a wide
class of nonlinear systems is topologically isomorphic to the
canonical S-system (Appendix A).
Simple algebra allows for transformation of (1)toamore
universal and analytically tractable form:
dz
i
dt
= F
i
t
; z
1
, , z
N
=
v
i
e
U
i
(t
)
−e
V
i
(t
)
,(3)
where t
is the rescaled time, U
i
(t
) =
N
m
=1
P
im
z
m
(t
),
V
i
(t
) =
N
m=1
P
im
z
m
(t
), P
im
= p
im
− δ
im
, Q
im
= q
im
−
δ
im
,andv
i
= v
i
(α
1
, , α
N
; β
1
, , β
N
) is the set of con-
stants characterizing constituent-specific rates of chemical
transformations (see [30, 43]andAppendix B for definitions
and technical details; for simplicity of notation, t
is further
replaced by t).
It is easy to see now that the fixed point of (3)islocated
in the origin of coordinates and that the Jacobian matrix in
its vicinity is simply
J
im
= ν
i
p
im
−q
im
. (4)
No simplifications have been made for the derivation of (3).
This means that these equations are quite general and may be
always derived for any given sets of rates and stoichiometric
coefficients.
3. Structure of The Solution in The Vicinity
of Equilibrium
Equations in (3) may be simultaneously viewed as renor-
malized equations of chemical kinetics derived from and
governed by the laws of nonequilibrium thermodynamics,
and also as the equations of an abstract dynamical sys-
tem, whether originating in chemistry or not. There is a
fundamental difference between the dynamic equilibrium
resulting from the conditions dz
i
/dt = 0, i = 1, , N,
and the thermodynamic equilibrium expressed in the LMA
in chemical kinetics [44]. The latter assumes, in addition
to the fact that the fixed point is the equilibrium point,
existence of the detailed balance, that is, full compensation
of each chemical reaction by the reverse one. For an
arbitrary dynamical system, there are no first principles
that would impose any limitations on the structure of the
Jacobian matrix, J, in the vicinity of the fixed point. This
means, in turn, that J is just a matrix of general form
having the eigenvalues with both positive and negative real
parts. Consequently, there are no reasons to assume that
the macroscopic law of motion for such systems, that is,
dx/dt
= F(x), is stable. Although the assumption of stability
is frequently introduced in the context of genetic regulation,
in fact, it refers to a highly specific condition which is hardly
possible in an unsupervised multidimensional system with
many thousands of independent governing parameters.
4 EURASIP Journal on Bioinformatics and Systems Biology
In this context, it is useful to recall some fundamental
results pertaining to stability of nonlinear systems. According
to the theorem by Lyapunov, the matrix J is stable if and
only if the equation J
V + VJ =−I has a solution, V,and
thissolutionisapositive definite matrix [45]. Matrix V ,if
exists, is a complicated function of all the stoichiometric
coefficients and kinetic rates characterizing the network.
Thus, the Lyapunov criterion would impose a set of very
stringent constraints of high algebraic order on the struc-
ture of dynamically stable biochemical networks. Another
classical approach to stability consists of the application of
the Routh-Hurwitz criterion [45]. In this approach, one
first calculates the characteristic polynomial of the Jacobian
matrix, and then builds the sequence of the so-called Hurwitz
determinants from its coefficients. The system is stable if
and only if all the Hurwitz determinants are positive. Again,
the Routh-Hurwitz criterion imposes a set of very complex
constraints on the global structure of a biochemical network.
As argued above, apart from the principle of detailed balance
(PDB), there are no other first principles and/or general laws
governing stability of biochemical systems, and neither the
Lyapunov nor the Routh-Hurwitz criteria are the corollaries
of PDB. As shown in [43], the Jacobian matrix of an
arbitrary biochemical system may have comparable numbers
of eigenvalues with negative and positive real parts. This
property holds under widely varying assumptions regarding
kinetic rates and stoichiometric coefficients. Therefore, gen-
erally, high-dimensional biochemical networks which are not
purposefully designed and/or dynamically stabilized (e.g., as
in the reactors for biochemical synthesis [46]) are reasonably
presumed to be unstable. Considerable efforts have been
undertaken to infer global properties of large biochemical
networks far from thermodynamical equilibrium from the
first principles; many notable approaches have been devel-
oped up to date. Among them are the chemical reaction
network theory [47], stoichiometric network theory [48],
thermodynamically feasible models [49], imposing con-
straints of microscopic reversibility [50], minimal reaction
scheme [51],tonamejustafew.However,inthemajorityof
these approaches, stability, either dynamical or stochastic, is
presumed a priori and serves as a starting point for further
considerations. These theories neither question the existence
of such stability nor explain why a big biochemical network
should necessarily be stable.
4. Stochastic Cooperativity and Probabilistic
Structure of Burstiness
The term cooperativity is widely used in biology for describ-
ing multistep joint actions of biomolecular constituents to
produce a singular step in intracellular regulation [52, 53].
In intracellular regulatory dynamics, the term cooperativity
reflects the fact that an individual act of gene expression
is not possible until all the gene-specific coactivators are
accumulated in the quantities sufficient for triggering the
transcription machinery. In ODE terms, this means that
dz/dt in (3) may noticeably deviate from zero only when the
majority of arguments in U
i
and V
i
come to “cooperation”
Time
0 200 400 600 800 1000
x(t)
−2
0
2
(a)
Time
0 200 400 600 800 1000
y(t)
−2
0
2
(b)
Time
0 200 400 600 800 1000
exp[1.5
∗
x(t)] −exp[1.5
∗
y(t)]
−50
0
50
(c)
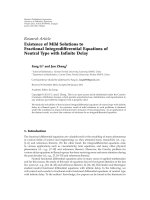
Figure 1: Illustration of the notion of burstiness.
Kurtosis = 27.5; degrees of freedom = 1.13
−20 2
0
0.2
0.4
0.6
0.8
1
1.2
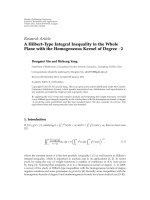
Figure 2: Histogram of the process depicted in Figure 1.The
distribution is close to the Student’s t with number of degrees of
freedom 1.13. This is an indicator of “heavy tails.” Solid line belongs
to the standard normal distribution, N(0, 1).
by simultaneously reaching vicinities of their respective
maxima. This notion is illustrated by the following simple
example. Let us assume that x(t)andy(t)arerandom,
not necessarily Gaussian, processes with identical statistical
characteristics, and consider the behavior of the process,
dz/dt
= F(t) = exp[σx(t)] − exp[σy(t)]. The pattern of
thisbehaviorisseeninFigure 1 whereby F(t)fluctuates
in the vicinity of zero most of the time, thus making no
contribution to the variations of z(t). However, sometimes
F(t) makes large excursions in either direction causing fast
sporadic changes in z(t). As shown in Figure 2, the distri-
bution of F(t) is approximately symmetric. This means that
positive excursions are generally balanced by negative ones.
This observation helps us to understand how it happens
EURASIP Journal on Bioinformatics and Systems Biology 5
Time
0 50 100 150 200
Individual exp (ar1)
z = exp(y)
0
5
10
15
20
(a)
Time
0 50 100 150 200
Sums of auto & cross-correlated lognormals
z
10
20
30
40
(b)
Figure 3: Convergence of the sums of lognormal processes (a) to
approximate normality (b).
that an inherently unstable system nevertheless behaves
decently and does not explode or implode as prescribed
by its linear instability. In simplified terms, the reason
is that sporadic deviations of concentrations in positive
directions are followed, sooner or later, by the balancing
responses in degradation, thus maintaining approximate
equilibrium.
In order to envision stochastic structure of the solution
to (3), we make use of three fundamental results from the
theory of stochastic processes, namely, (i) central limit theo-
rem (CLT) under the strong mixing conditions (SMC) [54];
(ii) asymptotic distribution of level-crossings by stationary
stochastic processes [55], and (iii) probabilistic structure of
heavy-tailed (also known as bursting) processes [56]. We first
notice that the arguments of F
i
(t, z)in(3) are combined into
two linear forms,
U
i
(t) =
N
m=1
P
im
z
m
, V
i
(t) =
N
m=1
Q
im
z
m
,(5)
in which only n
N terms are nonzeros, where n is the
typical number of transcriptional coactivators facilitating
gene expression; as mentioned above, this number may
be of order from several dozens to hundreds. Generally,
these collections of transcription factors are gene-specific,
and there is no explicit correlation between transcription
rates and transcription stoichiometry. According to the CLT
under the SMC, the sums of weakly dependent random
variables are asymptotically normal. Validity of the SMC,
as applied to U
i
(t)and V
i
(t), is easy to demonstrate by
simulation. Importantly, the sums (5) are asymptotically
normal even when the processes z
i
(t) are nonGaussian.
Figures 3 and 4 provide an illustration of convergence
to normality. In this example, individual time series z
i
(t)
are selected drastically nonnormal, namely lognormal, and
average cross-correlation between z
i
(t) is selected on the
level 0.15. Nevertheless, summation of only 80 series, z
i
(t),
results in the stochastic processes, U
i
(t)and V
i
(t)which
are fairly close to Gaussian. Thus, we conclude that U
i
(t)
and V
i
(t) are approximately Gaussian (see [30]formore
detail). Therefore, the processes exp[U
i
(t)] and exp[V
i
(t)]
are lognormally distributed; their expectations and variances
are, respectively,
M
i
= exp
μ
i
(·)+
θ
2
i
(·)
2
;
Θ
2
i
= exp
2μ
i
(·)+θ
2
i
(·)
exp
θ
2
i
(·)
−
1
,
(6)
where dot stands for P or Q.Thecorrelationcoefficient
between two exponentials is
ρ
ij
(P, Q) =
exp
Λ
ij
(P,Q)
−1
exp
θ
2
i
(P)
−1
exp
θ
2
j
(Q)
−1
−1/2
.
(7)
The right-hand side in (3) is the difference of two lognormal
random variables. Exact probabilistic distribution of this
difference is unknown. We have found by simulation that
these distributions may be reasonably well approximated by
the generalized Pareto distribution (GPD):
G
ξ,β
(x) = 1 −
1+
ξx
β
−1/ξ
, ξ
/
= 0,
G
ξ,β
(x) = 1 −exp
−
x
β
, ξ = 0.
(8)
More specifically, the tail distributions of
h
σ
(x) =
exp(σx) −exp(σy)
(9)
may be accurately represented through (8) with appropri-
ately selected parameters ξ
= ξ(σ)andβ = β(σ). These
dependencies are shown in Figure 5. Furthermore, very
accurate analytical approximations are available for ξ and β.
It turns out that ξ
= ξ(σ) is nearly linear:
ξ(σ)
= u + vσ + wσ
2
,
u
=
π/2 −2
π −2
=−0.376, v = 0.745, w =−0.088
(10)
and β
= β(σ)isnearlyexponential:
β(σ)
=
ϕ
p + q
exp(pσ) −exp(−qσ)
,
p
= 1.162, q = 2.753, ϕ =
√
π
π −2
= 1.553.
(11)
Although the primary goal for these approximations is
to accurately capture only the tail distributions of h
σ
(x),
nevertheless within the interval 0.1
≤ σ ≤ 2.75 approxi-
mations (10)-(11) are found to be quite satisfactory down to
6 EURASIP Journal on Bioinformatics and Systems Biology
ss = 240000 av = 1.62; sd = 2.12;
sk
= 6.18; kt = 106;
−4 −20 2 4
0
0.2
0.4
0.6
0.8
1
1.2
Original lognormal
(a)
ss = 3000 av = 14.7; sd = 6.23;
sk
= 1.15; kt = 1.95;
−4 −20 2 4
0
0.1
0.2
0.3
0.4
Sums of auto &
cross-correlated lognormals
(b)
Figure 4: Illustration of convergence to normality. The histograms belong to processes shown in Figure 3. (a) Lognormal processes
(skeweness 6.2, kurtosis 106). (b) Distribution of sums of 80 lognormals (skeweness 1.2, kurtosis 2). In both cases, solid lines belong to
standard normal.
SG
01234
ξ
0
0.5
1
1.5
ξ of GPD versus “sglog”
(a)
SG
01234
β
0
10
20
30
40
β of GPD versus “sglog”
(b)
Figure 5: Parameters of GPD expressed through the standard deviation, σ. Dots are the parameters obtained by fitting the GPD to the
simulated h
σ
=|exp(σx) − exp(σy)|; solid lines are the parameters obtained through the analytical approximations (10)-(11).
0.1-quantile. Essentially, this means that GPD may serve as a
very good representation for h
σ
(x) as a whole, not just for the
tails. Figure 6 shows an example of fitting the GPD to h
σ
(x).
The histogram in Figure 6(b) depicts empirical distribution
of h
σ
(x) resulting from the Monte Carlo simulation; a solid
envelopeline belongs to the theoretical density of GPD with
parameters ξ(σ)andβ(σ) obtained from (10)-(11).
The fact that h
σ
(t) is representable through the heavy-
tailed GPD is significant. As well known from the literature
[56], stochastic processes with heavy-tailed distribution
usually possess the property of burstiness. This property
means that a substantial amount of spectral energy of
such processes is contained in exceedances, that is, in
the short sporadic pulses beyond the certain predefined
EURASIP Journal on Bioinformatics and Systems Biology 7
Theoretical quant
20 40 60 80 100
Empir quant
20
40
60
80
100
Approximate quantiles
SG
= 1.8; ξ = 0.675; β = 3.169
(a)
Leng = 9994449 mean = 7.55; stdv = 21.6;
min
= 2.96e − 010; max = 492
020406080
0
0.05
0.1
0.15
0.2
0.25
0.3
Distr. of abs diffr. lognormals
Solid line is theoretical density GPD
(b)
Figure 6: Example of approximation of the difference of two lognormals by the GPD. (a) QQ-plot of theoretical GPD versus empirical
h
σ
(t) = [σx(t)] −exp[σy(t)]; (b) empirical histogram of h
σ
(t) versus theoretical GPD density.
bounds. Figure 7 illustrates this concept. Figure 7(a) depicts
the stochastic process
h
σ
(t) = exp
σx(t)
−
exp
σy(t)
, (12)
where x(t)andy(t) are standardized independent Gaussian
processes. Figure 7(b) shows the process of exceedances,
h
σ
(t), defined as the part of h
σ
(t) jumping outside the
interval 0.025
≤ Prob(h
σ
) ≤ 0.975. Although
h
σ
(t) spends
only 5% of all the available time outside this interval, its
variance is overwhelmingly greater than that of difference,
d
σ
(t) = h
σ
(t) −
h
σ
(t) (resp., 183 and 7698). On this basis,
we may regard d
σ
(t) as a small background noise which only
slightly distorts the strong signal provided by
h
σ
(t). If we
ignore this noise, then (12) acquires a familiar form of the
Langevin equation
dz
i
dt
= F
i
(t) = v
i
L
i
k=1
μ
ik
δ
t −t
ik
, (13)
where μ
ik
is the matrix of random Pareto-distributed
amplitudes and t
ik
is the set of random point processes
coinciding with the events of bursting. Transition from
(3)to(13) signifies replacement of purely deterministic
dynamics by the pseudostochastic process similar to shot
noise. We emphasize again that no assumptions have been
made regarding extrinsic noise of any nature which may be
present in a dynamical system and which is frequently used
as a vehicle for introducing a stochastic element into the
system’s behavior [17, 57]. The point we make is that even
in the absence of such an external source of stochasticity,
a multidimensional system itself generates a very complex
behavior which for all practical purposes may be regarded
as a stochastic process. Formally, this type of stochasticity
may be regarded as a case of chaotic dynamics, but it is
fundamentally differentfromwhatisusuallyassumedunder
the terms chaos or chaotic maps in the literature. As known
from the literature, chaotic behavior may appear even in
a low-dimensional system with a very simple structure of
nonlinearity, such as in the celebrated example of Lorenz
attractor [58]. Usually in such systems, the bifurcations with
transition to chaos appear under highly peculiar conditions
expressed in a precise combination of the parameters govern-
ing the system. In this sense, chaos is not something typical
of low-dimensional nonlinear systems, but rather is a rare
and coincidental exclusion from the majority of smoothly
behaving systems with a similar algebraic structure. On the
contrary, in the model proposed in this work, stochasticity
emerges under very general and quite natural conditions
without any special requirements imposed on the governing
parameters. In this sense, this kind of stochasticity may be
regarded as a highly typical all-pervading pattern in the
behavior of high-dimensional highly nonlinear dynamical
systems.
These heuristic considerations are supported by simu-
lation. Temporal locations of pulses, t
ik
, are those corre-
sponding to local maxima of U
i
(t)andV
i
(t). We compare
their probabilistic properties of their exceedances with those
known from the theory of genuinely stochastic processes.
It is a well-known result from the theory of level-crossing
processes [55] that the sequence of such events in the interval
8 EURASIP Journal on Bioinformatics and Systems Biology
(0, t]asymptotically,a
→∞, converges to a Poisson process
with the parameter
ζ
=
1
2πτ
0
exp
−
a
2
2θ
2
, (14)
where a
→∞is the threshold of excursion; and τ
0
and
θ
2
are the correlation radius and variance of the generat-
ing Gaussian processes, respectively. On the basis of this
asymptotic result, it may be reasonably assumed that for a
finite, but sufficiently large a, the sequences, t
ik
, may also
form a set of Poisson processes with appropriately selected
parameters. Figure 8 shows an example of simulation where
the threshold, a, is not big at all, it is only slightly greater
than the standard deviation, a
= 1.35θ. The QQ-plot
and histogram of waiting times, Δt
k
= t
k+1
− t
k
,clearly
follow exponential distribution, which is an indication
that the sequence t
k
forms a Poisson process. It is also
worth mentioning that in this simulation the number of
peaks in the interval (0, T
= 100000] predicted from the
asymptotic theory, 703, is fairly close to the number of peaks
actually found, 696. These two findings indicate that (14)
is practically applicable under much milder conditions than
a
→∞.
5. Fokker-Plank Equation and Global Behavior
Having the Langevin equation (12) in place, we may now
derive the corresponding Fokker-Plank equation (FPE). For
this purpose, we compute increments,
z
i
(T) −z
i
(0) = ν
i
T
0
dt
e
U
i
(t)
−e
V
i
(t)
, (15)
over the period of time, T, encompassing many excursion
events. Since E[z
i
(T) − z
i
(0)] = 0, we have the following
equation for the variances of increments.
var
z
i
(T) −z
i
(0)
=
ν
2
i
T
0
dt
T
0
dt
E
e
U
i
(t)
−e
V
i
(t)
e
U
i
(t
)
−e
V
i
(t
)
.
(16)
Denoting
R
i
t −t
=
E
e
U
i
(t)
−e
V
i
(t)
e
U
i
(t
)
−e
V
i
(t
)
, (17)
and using the standard Dirichlet technique, we find
var
z
i
(T) −z
i
(0)
=
2ν
2
i
T
0
R
i
(τ)(T −τ)dτ. (18)
By definition, the diffusion coefficient is
D
i
=
∂ var
z
i
(T) −z
i
(0)
∂T
= 2ν
2
i
T
0
R
i
(τ)dτ.
(19)
0 2000 4000 6000 8000 10000
Untruncated: std
= 88.781
−2000
2000
(a)
0 2000 4000 6000 8000 10000
Exceedance beyond [0.025, 0.975] interval; std
= 87.744
−2000
2000
(b)
0 2000 4000 6000 8000 10000
Background noise; std
= 13.531
−60
0
40
(c)
0 2000 4000 6000 8000 10000
Cumulative sums
−8000
−2000
(d)
Figure 7: (a) Process h
σ
(t). (b) Process of exceedances
h
σ
(t).
(c) Residual noise, d
σ
(t) = h
σ
(t) −
h
σ
(t). (d) Trajectory of the
random walk generated by
h
σ
(t). Note that the variance of residual
noise, var [d
σ
(t)], is only 2.3% of total variance var [h
σ
(t)], despite
the fact that exceedances,
h
σ
(t), occupy only 5% of the probability
space.
Since the correlation radius is much smaller than the
interevent time, in the above integral T may be extended to
∞. Therefore,
D
i
= 2ν
2
i
∞
0
R
i
(τ)dτ. (20)
Integrand in the expression (20), after some inessential
simplifications, may be reduced to
R
i
(τ) = exp
2λ
k
E
z
k
+ λ
k
var
z
k
·
exp
λ
k
var
z
k
r
k
(τ)
−
1
,
(21)
where λ
= n/N (see Appendix C for details). In (21), r
k
(τ)
are the autocorrelation functions of individual series z
k
(t).
Applying the saddle point approximation to the integral
(21), we come to the following expression for the diffusion
coefficient (see Appendix D).
D
i
=
1
2
π
λ
ν
2
i
exp
2λz
G
T
G
Θ
G
exp
2λΘ
2
G
, (22)
where Θ
2
G
=
k
var (z
k
) denotes the network-wide variance
of fluctuations and T
2
G
= Θ
2
G
/[
k
var (z
k
)/τ
2
k
] is the network-
wide square of relaxation time. Equation (22)revealsimpor-
tant details of multidimensional diffusion in the ADNS
EURASIP Journal on Bioinformatics and Systems Biology 9
qq.exp
0 5 10 15 20 25 30
qq.dif
5
10
15
20
N
= 100 000
(a)
dif
0102030
0
0.02
0.04
0.06
0.08
0.1
0.12
st.dev
= 1, threshhold = 1.36
(b)
Figure 8: Evidence that the exceedances form a Poisson process: waiting times are exponentially distributed. The number of peaks predicted
from asymptotic theory is 703; the number actually found in simulation is 695.
network. First, there is a common factor created by the entire
network (T
G
/Θ
G
)exp(2λz
G
+2λΘ
2
G
) which acts uniformly
upon all the individual constituents. But also there are
individual motilities characterized by the factors ν
2
i
.Equation
(22) means that all the constituent-specific concentrations,
after being rescaled by their kinetic rates, Z
i
(t) = z
i
(t)ν
−1
i
,
have the same diffusion coefficient,
D
G
=
1
2
π
λ
T
G
Θ
G
exp
2λ
z
G
+ Θ
2
G
, (23)
and therefore, satisfy the same univariate FPE. It is natural
to assume that correlation times, τ
k
, are of the same
order of magnitude as the corresponding times of chemical
relaxation, ν
−1
k
, because both introduce characteristic time
scales into the individual chemical reactions. Therefore, the
entire system may be stratified by only one set of parameters,
the kinetic rates, ν
k
.
Generally, the probabilistic state of a biochemical net-
work may be characterized by joint distribution, P(z, t)of
all the chemical constituents which satisfies the multivariate
FPE [59]. However, in light of the above simplifications,
such a detailed description would be redundant. Instead, we
introduce a collection of N identical univariate probability
distributions, P(Z, t), where Z is any of the Z
i
= z
i
ν
−1
i
,each
satisfying the same FPE with the coefficient of diffusion (22).
This self-similarity grossly simplifies analytical treatment
of the problem. First, it means that variances, var (z
i
),
are directly proportional to the squares of correspond-
ing kinetic rates. Since z
i
= ln(y
i
), we conclude that
var [ln(y
i
)] ∼ ν
2
i
, that is, in stationary fluctuations, the
variances of logarithms of concentrations are proportional
to the squares of kinetic rates. This is a testable property
of all the large-scale biochemical networks; it may serve
as a basis for experimental validation. Furthermore, since
{ν
i
} is the only set of constituent-specific temporal scaling
parameters in the network, it is natural to surmise that
the times of correlation, τ
i
, are directly proportional to
the corresponding times of chemical relaxation, ν
−1
i
. This
is another macroscopically observable property suitable for
experimental validation.
Due to random partitioning and stochasticity of tran-
scription initiation [60, 61], initial conditions for the system’s
evolution are considered as random. Starting with these
initial conditions, the system is predominantly driven by
the sequence of sporadic events of stochastic cooperativity.
Although each event produces a noticeable momentary shift
in the system’s evolution, the multitude of such events makes
its overall behavior quite smooth. This behavior is illustrated
in Figure 7(d). Smoothness of the trajectories, in practical
sense, may be regarded as macroscopic stability, whereas the
deviations from these smooth trajectories may be seen as
“noise.”
As a side note, it is worth mentioning that in this
paper, the Pareto representation of exceedances has been
derived from the assumption that U
i
(t)andV
i
(t)are
approximately Gaussian processes, and, therefore, exp[U
i
(t)]
and exp[V
i
(t)] are approximately lognormally distributed.
We have justified this closeness to normality of U
i
(t)and
V
i
(t) by the CLT. This assumption, however, only served
to simplify the analysis; it may be substantially relaxed
at the expense of increased complexity of calculations.
Conceptually, all the major ideas leading to the notion of
stochastic cooperativity would stay in place even without
transition to asymptotic normality. Let us assume again, as
we did in the examples in Figures 3-4, that
{U(t), V(t)}=
{
P, Q}z(t), where {z
i
(t)}are lognormal processes. This time,
10 EURASIP Journal on Bioinformatics and Systems Biology
however, it is not assumed that the number of nonzero
elements in these sums is sufficiently large to equate the
distributions of sums to their asymptotic limits. This would
reflect the situation when the number of transcription factors
in GRN is comparatively small. Generally, exact analytical
expressions for the distributions of sums of lognormals are
unknown, but there is a consensus in the literature that such
sums themselves may be accurately modeled as lognormally-
distributed [62]. We have performed a simulation for
studying the probabilistic structure of the exceedances
with lognormal
{U(t), V(t)}. It is rather remarkable that
the GPD turns out to be a good approximation in this
drastically nonnormal case as well; the only reservation
should be made that simple parameterization (10)-(11)is
no longer valid and should be replaced by a more complex
one.
Summarizing all these findings, we conclude that inher-
ent dynamical instability of the system considered as deter-
ministic directly translates into heavy-tailness and burstiness
in stochastic description. Sequence of events of stochastic
cooperativity serves as a link between deterministic and
stochastic paradigms.
6. Summary
We have outlined the mechanism by which a multidi-
mensional autonomous nonlinear system, despite being
dynamically unstable, nevertheless may be stationary, that is,
may reside in a state of stochastic fluctuations obeying the
probabilistic laws of random walk. Importantly, in this mech-
anism, the transition from the deterministic to probabilistic
laws of motion does not require any assumptions regarding
the presence of extraneous random noise; stochastic-like
behavior is produced by the system itself. An important
role in forming this type of fluctuative motion belongs to
inherent burstiness of the system associated with the events
of stochastic cooperativity. Unlike the classical Langevin
approach, macroscopic laws of motion of the system are not
required to be dynamically stable.
In this work, we have selected the S-systems to be an
example of a nonlinear system. Three motivations justified
this selection. First, the S-systems are structured after the
equations of chemical kinetics, thus being a natural tool
for description of high-dimensional biochemical networks.
Second, many other nonlinear systems may be represented
through the S-systems in the vicinity of fixed point. Third,
despite generality, the S-systems have an advantage of
being analytically tractable. However, many results regard-
ing stochastic cooperativity and burstiness may be readily
extended to other multidimensional nonlinear systems. In
such a system, short pulses during the events of stochastic
cooperativity may be described in terms of “shot” noise
with subsequent derivation of the Fokker-Plank equation. As
proposed in this paper, it is possible to indicate some general
experimentally verifiable predictions regarding the behavior
of this type of system, such as distribution of intensities of
fluctuations and distribution of temporal autocorrelations
among individual units of the system.
Appendices
A. Replacement of an Arbitrary Nonlinear
Dynamics by The S-Dynamics
In this section, we follow the methodology outlined in [37]
adapting the formulae and notation to the specific goals of
this work. We consider the nonlinear system
dx
i
dt
= Φ
i
x
1
, , x
N
=
exp
F
i
U
i
−exp
G
i
V
i
,
U
i
(t) =
k
P
ik
x
k
(t), V
i
(t) =
k
Q
ik
x
k
(t),
(A.1)
where
{F
i
} and {G
i
} are monotonic functions, and P
ik
and
Q
ik
are the matrices with positive elements. We first select an
arbitrary point x
0
and expand Φ in the Taylor series in its
vicinity
Φ
i
(t) = exp
F
i
U
0
i
+
∂F
i
∂U
i
x
0
k
P
ik
x
k
−x
0
k
−
exp
G
i
V
0
i
+
∂G
i
∂U
i
x
0
k
Q
ik
x
k
−x
0
k
,
(A.2)
where
U
0
(t) = Px
0
(t), V
0
(t) = Qx
0
(t). (A.3)
We den ote
α
0
i
= α
i
x
0
=
exp
F
i
U
0
i
−
∂F
i
∂U
i
x
0
k
P
ik
x
0
k
,
β
0
i
= β
i
x
0
= exp
G
i
V
0
i
−
∂G
i
∂V
i
x
0
k
Q
ik
x
0
k
,
(A.4)
ξ
0
i
= ξ
i
x
0
=
∂F
i
∂U
i
x
0
, η
0
i
= η
i
x
0
=
∂G
i
∂V
i
x
0
(A.5)
With definitions (A.5), (A.4)mayberewrittenas
α
0
i
= exp
F
i
U
0
i
−ξ
0
i
U
0
i
,
β
0
i
= exp
G
i
V
0
i
−
η
0
i
V
0
i
,
(A.6)
thus bringing (A.1) to the standard form of S-system
Φ
i
t | x
0
=
α
0
i
exp
k
ξ
0
i
P
ik
x
k
−
β
0
i
exp
k
η
0
i
Q
ik
x
k
.
(A.7)
with the parameters dependent on x
0
.
The “tangential” system (A.7) has a unique fixed point,
x
1
. To find it, we require that
ln
β
0
i
α
0
i
=
k
ξ
0
i
P
ik
−η
0
i
Q
ik
x
1
k
, i = 1, , N. (A.8)
EURASIP Journal on Bioinformatics and Systems Biology 11
Denoting temporarily Λ
ik
= ξ
i
P
ik
−η
i
Q
ik
.
ln
β
i
α
i
=
k
Λ
ik
x
1
k
;
i
Λ
−1
ji
ln
β
i
α
i
=
i
Λ
−1
ji
k
Λ
ik
x
1
k
= x
1
j
,
(A.9)
we find the equilibrium point conditional on x
0
x
1
i
x
0
=
k
Λ
−1
ik
ln
β
k
α
k
=
k
ξ
0
i
P
ik
−η
0
i
Q
ik
−1
ln
β
0
k
α
0
k
=
Ψ
i
x
0
.
(A.10)
We introduce the map, Ψ(x), and rewrite (A.10)asx
1
=
Ψ(x
0
) .
We may now select the point x
1
as a new starting point,
and deduce
x
2
= Ψ
x
1
=
Ψ
2
x
0
; ; x
n
=Ψ
n
x
0
. (A.11)
Tournier [37] proved that the point x
= X whichisthefixed
point of Ψ, that is, Ψ(X)
= X, is also the fixed point of
the (A.1), that is, Φ(X)
= 0, and that the sequence Ψ
n
(x
0
)
converges to this point when n
→∞. Therefore, we may
conclude that in the vicinity of the fixed point, whether stable
or unstable, general equations (A.1)mayberewritteninthe
form
dx
i
dt
= α
i
exp
k
ξ
i
P
ik
x
k
−
β
i
exp
k
η
i
Q
ik
x
k
. (A.12)
Formally, these equations may be seen as a system of equation
of chemical kinetics with α
i
and β
i
being the rates, ξ
i
and η
i
being stoichiometric coefficients, and exp(x
k
) being chemical
constituents. It is not out of place to mention again, that
since F and G are arbitrary vector functions, then there is no
special symmetry in the Jacobian matrix of the system in the
vicinity of fixed point. Therefore, there is no reason to expect
that its eigenvalues have only negative real parts, that is, that
the fixed point is stable.
B. Derivation of (3)
Following the standard procedures in nonlinear dynamics
[63], we first search for the state of dynamical equilibrium,
{x
0
m
}, commonly referred to as a fixed point, that is, the
point where all the time derivatives turn to zero, and which
therefore satisfy
α
i
N
m=1
x
0
m
p
im
= β
i
N
m=1
x
0
m
q
im
. (B.1)
Taking logarithms of both sides and solving the linear
equations, we obtain the vector of solutions:
x
0
i
= exp
N
m=1
p
im
−q
im
−1
ln
β
m
α
m
. (B.2)
Note that stoichiometric coefficients p
im
and q
im
cannot be
identical in all the direct and inverse reactions simultane-
ously, therefore, the matrix p
im
−q
im
is always invertible.
It is convenient to introduce relative quantities, y
i
=
x
i
/x
0
i
, and then, after denoting
U
= (p −I)(p −q)
−1
, V = (q −I)(p −q)
−1
,(B.3)
we obtain the equations
dy
i
dt
= A
i
N
m=1
y
p
im
m
−B
i
N
m=1
y
q
im
m
,(B.4)
where
A
i
= α
i
exp
N
m=1
U
im
ln
β
m
α
m
,
B
i
= β
i
exp
N
m=1
V
im
ln
β
m
α
m
.
(B.5)
Since we are interested only in positive solutions, we replace
y
i
= exp(z
i
) and obtain
dz
i
dt
= A
i
exp
N
m=1
P
im
z
m
−
B
i
exp
N
m=1
Q
im
z
m
,(B.6)
where P
im
= p
im
−δ
im
,andQ
im
= q
im
−δ
im
.
We note further that
B
i
A
i
=
β
i
α
i
exp
N
m=1
V
im
−U
im
ln
β
m
α
m
,(B.7)
and because V
−U = (q −p)(p −q)
−1
=−I, we find that
B
i
= A
i
, therefore,
dz
i
dt
= A
i
exp
N
m=1
P
im
z
m
−
exp
N
m=1
Q
im
z
m
. (B.8)
After introducing a more appropriate time scale t
A = t
,
where
A = N
−1
N
i=1
A
i
,werewrite(B.8)as
dz
i
dt
= F
i
(z)
= v
i
exp
N
m=1
P
im
z
m
−
exp
N
m=1
Q
im
z
m
,
(B.9)
where ν
i
= A
i
/ A with an important property that ν
i
= 1. It
is easy to see that now the fixed point is located in the origin
of coordinates and that the Jacobian matrix in the vicinity of
this point is
J
im
= ν
i
(p
im
−q
im
). (B.10)
C. Derivation of The Autocorrelation Function
By definition
R
i
(τ) = exp
2E
U
i
+var[U]
exp
cov
U(0), U(τ)
−
exp
cov [U(0), V(τ)]
.
(C.1)
12 EURASIP Journal on Bioinformatics and Systems Biology
We have further,
var (U
| P) =
k,m
p
k
p
m
cov
z
k
, z
m
,
var (U)
= λ
k
var
z
k
+ λ
2
k,m
cov
z
k
, z
m
.
(C.2)
Similarly,
cov
U(0), U(τ)
| P
=
k,m
p
k
p
m
cov
z
k
(0), z
m
(τ)
,
cov
U(0), U(τ)
=
λ
k
cov
z
k
(0), z
k
(τ)
+ λ
2
k,m
cov
z
k
(0), z
m
(τ)
.
(C.3)
At last,
cov
U(0), V(τ)
| P, Q
=
k,m
p
k
q
m
cov
z
k
(0), z
m
(τ)
,
cov
U(0), V(τ)
=
λ
2
k,m
cov
z
k
(0), z
m
(τ)
.
(C.4)
Putting everything together,
R
i
(τ) = exp
2E
U
i
+
λ
k
var
z
k
+ λ
2
k,m
cov
z
k
, z
m
+ λ
2
k,m
cov
z
k
(0), z
m
(τ)
·
exp
λ
k
cov
z
k
(0), z
k
(τ)
−1
.
(C.5)
The terms λ
2
k,m
cov (z
k
, z
m
)+λ
2
k,m
cov (z
k
(0), z
m
(τ)) are
small compared to λ
k
var (z
k
), first, because λ 1, and
second, because the double sums here are of the same order
of magnitude as the sums of variances. We, therefore, reduce
(C.5)to
R
i
(τ) = exp
2E
U
i
+ λ
k
var
z
k
·
exp
λ
k
var
z
k
r
k
(τ)
−
1
.
(C.6)
D. Derivation of The Diffusion Coefficient
Using The Saddle Point Approximation
Let R(τ) be a decreasing function of τ such that: R(0)
1; R(∞) = 0; R
(0) = 0. Then,
J
=
∞
0
exp
R(τ)
−
1
dτ
≈
∞
0
exp
R(0) + τR
(0) +
τ
2
2
R
(0)
−
1
dτ.
(D.1)
Denoting σ
2
=−1/R
(0), we find that exp[R(0) −τ
2
/(2σ
2
)]
is a good representation of the integrand in (D.1) both in the
vicinity of zero and at infinity. Therefore,
J
= exp R(0)
∞
0
exp
−
τ
2
2σ
2
dτ
=
√
π
2
σe
R(0)
=
1
2
π
−R
(0)
e
R(0)
.
(D.2)
Introducing Λ
i
= exp[2E(U
i
)+λ
k
var (z
k
)], and R(τ) =
λ
k
var (z
k
)r
k
(τ), we obtain
R
i
(τ) = Λ
i
·exp
R(τ) −1
. (D.3)
Denoting τ
−2
k
=−
¨
r
k
(0), we get σ
−2
= λ
k
[var (z
k
)/τ
2
k
].
Therefore,
D
i
=ν
2
i
exp
2E
U
i
+λ
k
var
z
k
√
π
2
exp
λ
k
var
z
k
λ
k
var
z
k
/τ
2
k
.
(D.4)
Introducing the parameters
Θ
2
G
=
k
var
z
k
;
T
2
G
=
k
var
z
k
/
k
var
z
k
/τ
2
k
,
(D.5)
we finally obtain
D
i
=
1
2
π
λ
T
G
Θ
G
exp
2λΘ
2
G
ν
2
i
exp
2E
U
i
. (D.6)
References
[1] T. Schlitt and A. Brazma, “Modelling gene networks at
different organisational levels,” FEBS Letters, vol. 579, no. 8,
pp. 1859–1866, 2005.
[2] P. Bork, L. J. Jensen, C. von Mering, A. K. Ramani, I. Lee, and
E. M. Marcotte, “Protein interaction networks from yeast to
human,” Current Opinion in Structural Biology, vol. 14, no. 3,
pp. 292–299, 2004.
[3] O. Fiehn, “Metabolomics—the link between genotypes and
phenotypes,” Plant Molecular Biology, vol. 48, no. 1-2, pp. 155–
171, 2002.
[4] R. Raman, S. Raguram, G. Venkataraman, J. C. Paulson, and R.
Sasisekharan, “Glycomics: an integrated systems approach to
structure-function relationships of glycans,” Nature Methods,
vol. 2, no. 11, pp. 817–824, 2005.
[5] G. Krauss, Biochemistry of Signal Transduction and Regulation,
Wiley-VCH, New York, NY, USA, 1999.
[6]R.M.May,“Willalargecomplexsystembestable?”Nature,
vol. 238, no. 5364, pp. 413–414, 1972.
[7] I. Golding and E. C. Cox, “RNA dynamics in live Escherichia
coli cells,” Proceedings of the National Academy of Sciences of the
United States of America, vol. 101, no. 31, pp. 11310–11315,
2004.
[8] I. Golding, J. Paulsson, S. M. Zawilski, and E. C. Cox, “Real-
time kinetics of gene activity in individual bacteria,” Cell, vol.
123, no. 6, pp. 1025–1036, 2005.
EURASIP Journal on Bioinformatics and Systems Biology 13
[9] M. Kærn, M. Menzinger, and A. Hunding, “A chemical flow
system mimics waves of gene expression during segmenta-
tion,” Biophysical Chemist ry, vol. 87, no. 2-3, pp. 121–126,
2000.
[10] J. Yu, J. Xiao, X. Ren, K. Lao, and X. S. Xie, “Probing gene
expression in live cells, one protein molecule at a time,”
Science, vol. 311, no. 5767, pp. 1600–1603, 2006.
[11] J. Paulsson, “Summing up the noise in gene networks,” Nature,
vol. 427, no. 6973, pp. 415–418, 2004.
[12] J. Paulsson, “Prime movers of noisy gene expression,” Nature
Genetics, vol. 37, no. 9, pp. 925–926, 2005.
[13] A. Goldbeter, “Complex oscillatory phenomena, including
multiple oscillations, in regulated biochemical systems,”
Biomedica Biochimica Acta, vol. 44, no. 6, pp. 881–889, 1985.
[14] A. Goldbeter, “Computational approaches to cellular
rhythms,” Nature, vol. 420, no. 6912, pp. 238–245, 2002.
[15] T. B. Kepler and T. C. Elston, “Stochasticity in transcriptional
regulation: origins, consequences, and mathematical repre-
sentations,” Biophysical Journal, vol. 81, no. 6, pp. 3116–3136,
2001.
[16] J. M. Raser and E. K. O’Shea, “Noise in gene expression:
origins, consequences, and control,” Science, vol. 309, no.
5743, pp. 2010–2013, 2005.
[17] L. Arnold, “Qualitative theory of stochastic non-linear sys-
tems,” in Stochastic Nonlinear Systems,L.ArnoldandR.
Lefever, Eds., pp. 86–99, Springer, Berlin, Germany, 1981.
[18] T. G. Kurtz, “The relationship between stochastic and deter-
ministic models for chemical reactions,” The Journal of
Chemical Physics, vol. 57, no. 7, pp. 2976–2978, 1972.
[19] T. G. Kurtz, “Solutions of ordinary differential equations as
limits of pure jump Markov processes,” Journal of Applied
Probability, vol. 7, no. 1, pp. 49–58, 1972.
[20] P. K. Pollett and A. Vassallo, “Diffusion approximation for
some simple chemical reaction schemes,” Advances in Applied
Probability, vol. 24, no. 4, pp. 875–893, 1992.
[21] A. Hoffmann, A. Levchenko, M. L. Scott, and D. Baltimore,
“The IκB-NF-κB signaling module: temporal control and
selective gene activation,” Science, vol. 298, no. 5596, pp. 1241–
1245, 2002.
[22] H. de Jong, J. Geiselmann, C. Hernandez, and M. Page,
“Genetic network analyzer: qualitative simulation of genetic
regulatory networks,” Bioinformatics, vol. 19, no. 3, pp. 336–
344, 2003.
[23] P. Mendes, “GEPASI: a software package for modelling the
dynamics, steady states and control of biochemical and other
systems,” Computer Applications in the Biosciences, vol. 9, no.
5, pp. 563–571, 1993.
[24] E. O. Voit, Computational Analysis of Biochemical Systems:
A Practical Guide for Biochemists and Molecular Biologists,
Cambridge University Press, Cambridge, UK, 2000.
[25] A L. Barab
´
asi and Z. N. Oltvai, “Network biology: under-
standing the cell’s functional organization,” Nature Reviews
Genetics, vol. 5, no. 2, pp. 101–113, 2004.
[26]W.Just,H.Kantz,C.Rodenbeck,andM.Helm,“Stochastic
modeling: replacing fast degrees of freedom,” Journal of Physics
A, vol. 34, no. 15, pp. 3199–3213, 2001.
[27] W. Just, K. Gelfert, N. Baba, A. Riegert, and H. Kantz,
“Elimination of fast chaotic degrees of freedom: on the
accuracy of the born approximation,” Journal of Statistical
Physics, vol. 112, no. 1-2, pp. 277–292, 2003.
[28] H. Mori, H. Fujisaka, and H. Shigematsu, “A new expansion
of the master equation,” Progress in Theoretical Physics, vol. 51,
no. 1, pp. 109–122, 1974.
[29] R. Zwanzig, “Ensemble method in the theory of Irreversibil-
ity,” The Journal of Chemical Physics, vol. 33, no. 5, pp. 1338–
1341, 1960.
[30] S. Rosenfeld, “Stochastic cooperativity in non-linear dynamics
of genetic regulatory networks,” Mathematical Biosciences, vol.
210, no. 1, pp. 121–142, 2007.
[31] M. A. Savageau, “Biochemical systems analysis I. Some
mathematical properties of the rate law for the component
enzymatic reactions,” Journal of Theoretical Biology, vol. 25,
no. 3, pp. 365–369, 1969.
[32] M. A. Savageau and E. O. Voit, “Recasting nonlinear differ-
ential equations as S-systems: a canonical nonlinear form,”
Mathematical Biosciences, vol. 87, no. 1, pp. 83–115, 1987.
[33] E. O. Voit, Canonical Nonlinear Modeling. S-System Approach
to Understanding Complexity, Van Nostrand Reinhold, New
York, NY, USA, 1991.
[34] M. A. Savageau, “Biochemical systems analysis III. Dynamic
solutions using a power-law approximation,” Journal of Theo-
retical Biology, vol. 26, no. 2, pp. 215–226, 1970.
[35] S. Kimura, K. Ide, A. Kashihara, et al., “Inference of S-
system models of genetic networks using a cooperative
coevolutionary algorithm,” Bioinformatics,vol.21,no.7,pp.
1154–1163, 2005.
[36] E. O. Voit and T. Radivoyevitch, “Biochemical systems analysis
of genome-wide expression data,” Bioinformatics, vol. 16, no.
11, pp. 1023–1037, 2000.
[37] L. Tournier, “Approximation of dynamical systems using S-
systems theory: application to biological systems,” in Proceed-
ings of the International Symposium on Symbolic and Algebraic
Computation (ISSAC ’05), pp. 317–324, Beijing, China, July
2005.
[38] J. T. Kadonaga, “Regulation of RNA polymerase II transcrip-
tion by sequence-specific DNA binding factors,” Cell, vol. 116,
no. 2, pp. 247–257, 2004.
[39] B. Lemon and R. Tjian, “Orchestrated response: a symphony
of transcription factors for gene control,” Genes and Develop-
ment, vol. 14, no. 20, pp. 2551–2569, 2000.
[40] A. Sorribas and M. A. Savageau, “Strategies for represent-
ing metabolic pathways within biochemical systems theory:
reversible pathways,” Mathematical Biosciences, vol. 94, no. 2,
pp. 239–269, 1989.
[41] L. Brenig, “Complete factorisation and analytic solutions of
generalized Lotka-Volterra equations,” Physics Letters A, vol.
133, no. 7-8, pp. 378–382, 1988.
[42] L. Brenig and A. Goriely, “Universal canonical forms for time-
continuous dynamical systems,” Physical Rev iew A, vol. 40, no.
7, pp. 4119–4122, 1989.
[43] S. Rosenfeld, “Stochastic oscillations in genetic regulatory
networks: application to microarray experiments,” EURASIP
Journal on Bioinformatics and Systems Biology, vol. 2006,
Article ID 59526, 12 pages, 2006.
[44] S. Zumdahl, Chemical Principles,HoughtonMifflin, New
York, NY, USA, 2005.
[45] F. R. Gantmacher, Applications of the Theory of Matrices,
Wiley-Interscience, New York, NY, USA, 1959.
[46] P. I. Nikolaev and D. P. Sokolov, “Selection of an optimal
biochemical reactor for microbiological synthesis,” Chemical
and Petroleum Engineering, vol. 16, no. 12, pp. 707–710, 1980.
[47] M. Feinberg, “The existence and uniqueness of steady states
for a class of chemical reaction networks,” Archive for Rational
Mechanics and Analysis, vol. 132, no. 4, pp. 311–370, 1995.
14 EURASIP Journal on Bioinformatics and Systems Biology
[48] H. Qian, D. A. Beard, and S D. Liang, “Stoichiometric
network theory for nonequilibrium biochemical systems,”
European Journal of Biochemistry, vol. 270, no. 3, pp. 415–421,
2003.
[49] M. Ederer and E. D. Gilles, “Thermodynamically feasible
kinetic models of reaction networks,” Biophysical Journal, vol.
92, no. 6, pp. 1846–1857, 2007.
[50] D. Colquhoun, K. A. Dowsland, M. Beato, and A. J. R. Plested,
“How to impose microscopic reversibility in complex reaction
mechanisms,” Biophysical Journal, vol. 86, no. 6, pp. 3510–
3518, 2004.
[51] J. Yang, W. J. Bruno, W. S. Hlavacek, and J. E. Pearson, “On
imposing detailed balance in complex reaction mechanisms,”
Biophysical Journal, vol. 91, no. 3, pp. 1136–1141, 2006.
[52] S. P. Bell, R. M. Learned, H. M. Jantzen, and R. Tjian,
“Functional cooperativity between transcription factors UBF1
and SL1 mediates human ribosomal RNA synthesis,” Science,
vol. 241, no. 4870, pp. 1192–1197, 1988.
[53] M. Ptashne, “Regulated recruitment and cooperativity in
the design of biological regulatory systems,” Philosophical
Transactions of the Royal Society A, vol. 361, no. 1807, pp.
1223–1234, 2003.
[54] R. Bradley, “Basic properties of strong mixing conditions. A
survey and some open questions,” Probability Surveys, vol. 2,
pp. 107–144, 2005.
[55] H. Cramer and R. Leadbetter, Stationary and Related Stochastic
Processes, John Wiley & Sons, New York, NY, USA, 1967.
[56] A. McNeil, R. Frey, and P. Embrechts, Quantitative Risk
Management, Princeton University Press, Princeton, NJ, USA,
2005.
[57] N. G. Van Kampen, Stochastic Processes in Physics and Chem-
istry, North Holland, Amsterdam, The Netherlands, 2006.
[58] E. N. Lorenz, “Deterministic nonperiodic flow,” Journal of the
Atmospheric Sciences, vol. 20, no. 2, pp. 130–141, 2006.
[59] C. W. Gardiner, Handbook of Stochastic Methods: For Physics,
Chemistry,andtheNaturalSciences, Springer, Berlin, Ger-
many, 1983.
[60] H. H. McAdams and A. Arkin, “Stochastic mechanisms in
gene expression,” Proceedings of the National Academy of
Sciences of the United States of America, vol. 94, no. 3, pp. 814–
819, 1997.
[61] H. H. McAdams and A. Arkin, “It’s a noisy business! Genetic
regulation at the nanomolar scale,” Trends in Genetics, vol. 15,
no. 2, pp. 65–69, 1999.
[62] J. Wu, N. B. Mehta, and J. Zhang, “A flexible lognormal sum
approximation method,” in Proceedings of the IEEE Global
Telecommunications Conference (GLOBECOM ’05), vol. 6,
pp. 3413–3417, Mitsubishi Electric Research Laboratories, St.
Louis, Mo, USA, November-December 2005.
[63] L. Perko, Differential Equations and Dynamical Systems,
Springer, Berlin, Germany, 2001.