Báo cáo hóa học: " Research Article Online Personalization of Hearing Instruments" pdf
Bạn đang xem bản rút gọn của tài liệu. Xem và tải ngay bản đầy đủ của tài liệu tại đây (1.59 MB, 14 trang )
Hindawi Publishing Corporation
EURASIP Journal on Audio, Speech, and Music Processing
Volume 2008, Article ID 183456, 14 pages
doi:10.1155/2008/183456
Research Article
Online Personalization of Hearing Instruments
Alexander Ypma,
1
Job G eurts,
1
Serkan
¨
Ozer,
1, 2
Erik van der Werf,
1
and B ert de Vries
1, 2
1
GN ReSound Research, GN ReSound A/S, Horsten 1, 5612 AX Eindhoven, The Netherlands
2
Signal Processing Syste ms Group, Electrical Engineering Department, Eindhoven University of Technology,
Den Dolech 2, 5612 AZ Eindhoven, The Netherlands
Correspondence should be addressed to Alexander Ypma,
Received 27 December 2007; Revised 21 April 2008; Accepted 11 June 2008
Recommended by Woon-Seng Gan
Online personalization of hearing instruments refers to learning preferred tuning parameter values from user feedback through
a control wheel (or remote control), during normal operation of the hearing aid. We perform hearing aid parameter steering by
applying a linear map from acoustic features to tuning parameters. We formulate personalization of the steering parameters as the
maximization of an expected utility function. A sparse Bayesian approach is then investigated for its suitability to find efficient
feature representations. The feasibility of our approach is demonstrated in an application to online personalization of a noise
reduction algorithm. A patient trial indicates that the acoustic features chosen for learning noise control are meaningful, that
environmental steering of noise reduction makes sense, and that our personalization algorithm learns proper values for tuning
parameters.
Copyright © 2008 Alexander Ypma et al. This is an open access article distributed under the Creative Commons Attribution
License, which permits unrestricted use, distribution, and reproduction in any medium, provided the original work is properly
cited.
1. INTRODUCTION
Modern digital hearing aids contain advanced signal process-
ing algorithms with many tuning parameters. These are set
to values that ideally match the needs and preferences of the
user. Because of the large dimensionality of the parameter
space and unknown determinants of user satisfaction, the
tuning procedure becomes a complex task. Some of the
tuning parameters are set by the hearing aid dispenser based
on the nature of the hearing loss. Other parameters may be
tuned on the basis of the models for loudness perception,
for example [1]. But, not every individual user preference
can be put into the hearing aid beforehand because some
particularities of the user may be hard to represent into
the algorithm, and the user’s typical acoustic environments
may be very different from the sounds that are played
to the user in a clinical fitting session. Moreover, sound
preferences may be changing with continued wear of a
hearing aid. Thus, users sometimes return to the clinic soon
after the initial fitting for further adjustment [2]. In order
to cope with the various problems for tuning parameters
prior to device usage, we present in this paper a method to
personalize the hearing aid algorithm during usage to actual
user preferences.
We consider the personalization problem as linear
regression from acoustic features to tuning parameters, and
formulate learning in this model as the maximization of
an expected utility function. An online learning algorithm
is then presented that is able to learn preferred parameter
values from control operations of a user during usage.
Furthermore, when a patient leaves the clinic with a fitted
hearing aid, it is not completely known which features
are relevant for explaining the patient’s preference. Taking
“just every interesting feature” into account may lead
to high-dimensional feature vectors, containing irrelevant
and redundant features that make online computations
expensive and hinder generalization of the model. Irrelevant
features do not contribute to predicting the output, whereas
redundancy refers to features that are correlated with other
features which do not contribute to the output when the
correlated features are also present. We therefore study a
Bayesian feature selection scheme that can learn a sparse
and well-generalizing model for observed preference data.
The behavior of the Bayesian feature selection scheme is
validated with synthetic data, and we conclude that this
scheme is suitable for the analysis of hearing aid preference
data. An analysis of preference data from a listening test
2 EURASIP Journal on Audio, Speech, and Music Processing
reveals a relevant set of acoustic features for personalized
noise reduction.
Based on these features, a learning noise control algo-
rithm was implemented on an experimental hearing aid. In
a patient trial, 10 hearing impaired subjects were asked to
use the experimental hearing aid in their daily life for six
weeks. The noise reduction preferences showed quite some
variation over subjects, and most of the subjects learned a
preference that showed a significant dependency on acoustic
environment. In a post hoc sound quality analysis, each
patient had to choose between the learned hearing aid
settings and a (reasonable) default setting of the instrument.
In this blind laboratory test, 80% of the subjects preferred the
learned settings.
This paper is organized as follows. In Section 2, the
model for hearing aid personalization is described, including
algorithms for both offline and online training of tuning
parameters. In Section 3, the Bayesian feature selection
algorithm is quickly reviewed along with two fast heuristic
feature selection methods. In addition, the methods are
validated experimentally. In Section 4, we analyze a dataset
with noise reduction preferences from an offline data
collection experiment in order to obtain a reduced set of
features for online usage. A clinical trial to validate our online
personalization model is presented in Section 5. Section 6
discusses the experimental results, and we conclude in
Section 7.
2. A MODEL FOR HEARING AID PERSONALIZATION
Consider a hearing aid (HA) algorithm y(t)
= H(x(t), θ),
where x(t)andy(t) are the input and output signals,
respectively, and θ is a vector of tuning parameters, such as
time constants and thresholds. HA algorithms are by design
compact in order to save energy consumption. Still, we want
that H performs well for all environmental conditions. As
a result, good values for the tuning parameters are often
dependent on the environmental context, like being in a
car, a restaurant setting, or at the office. This will require a
tuning vector θ(t) that varies with time (as well as context).
Many hearing aids are equipped with a so-called control
wheel (CW), which is often used by the patient to adjust
the output volume (cf. Figure 1). Online user control of a
tuning parameter does not need to be limited to the volume
parameter. In principle, the value of any component from
the tuning parameter vector could be controlled through
manipulation of the CW. In this paper, we will denote by
θ(t)ascalar tuning parameter that is manually controlled
through the CW.
2.1. Learning from explicit consent
An important issue concerns how and when to collect
training data. When a user is not busy manipulating the CW,
we have no information about his satisfaction level. After all,
the patient might not be wearing the instrument. When a
patient starts with a CW manipulation, it seems reasonable
to assume that he is not happy with the performance of his
instrument. This moment is tagged as a dissent moment.
Figure 1: Volume control at the ReSound Azure hearing aid (photo
from GN ReSound website).
x
H
y
EVC
v
×
Σ
θ
φ
m
CW
Figure 2: System flow diagram for online control of a hearing aid
algorithm.
Right after the patient has finished turning the CW, we
assume that the patient is satisfied with the new setting.
This moment is identified as a consent moment. Dissent and
consent moments identify situations for collecting training
data that relate to low and high satisfaction levels. In this
paper, we will only learn from consent moments.
Consider the system flow diagram of Figure 2. The tuning
parameter value θ(t) is determined by two terms. The user
can manipulate the value of θ(t) directly through turning
acontrolwheel.Thecontributiontoθ(t) from the CW is
called m (for “manual”). We are interested however in learn-
ing separate settings for θ(t) under different environment
conditions. For this purpose, we use an EnVironment Coder
(EVC) that computes a d-dimensional feature vector v(t)
=
v(x(t)) based on the input signal x(t). The feature vector
may consist of acoustic descriptors like input power level
and speech probability. We then combine the environmental
features linearly through v
T
(t)φ, and add this term to the
manual control term, yielding
θ(t)
= v
T
(t)φ + m(t). (1)
We will tune the “environmental steering” parameters φ
based on data obtained at consent moments. We need to be
careful with respect to the index notation. Assume that the
kthconsentmomentisdetectedatt
= t
k
; that is, the value
of the feature vector v at the kth consent moment is given by
v(t
k
). Since our updates only take place right after detecting
the consent moments, it is useful to define a new time series
as
v
k
= v
t
k
=
t
v(t)δ
t −t
k
,(2)
as well as similar definitions for converting θ(t
k
)toθ
k
.
The new sequence, indexed by k rather than t, only selects
Alexander Ypma et al. 3
samples at consent moments from the original time series.
Note the difference between v
k+1
and v(t
k
+1). Thelatter(t =
t
k
+ 1) refers to one sample (e.g., 1/f
s
= 1/16 millisecond)
after the consent moment t
= t
k
,whereasv
k+1
was measured
at the (k + 1)th consent moment, which may be hours after
t
= t
k
.
Again, patients are instructed to use the control wheel to
tune their hearing instrument at any time to their liking. Just
τ seconds before consent moment k, the user experiences an
output y(t
k
− τ) that is based on a tuning parameter θ(t
k
−
τ) = v(t
k
−τ)
T
φ
k−1
.Notationφ
k−1
refers to the value for φ
prior to the kth user action. Since τ is considered small with
respect to typical periods between consent times and since we
assume that features v(t) are determined at a time scale that
is relatively large with respect to τ, we make the additional
assumption that v(t
k
− τ) = v(t
k
). Hence, adjusted settings
at time t
k
are found as
θ
k
= θ
t
k
−τ
+ m
k
= v
T
k
φ
k−1
+ m
k
.
(3)
The values of the tuning parameter θ(t) and the features v(t)
are recorded at all K registered consent moments, leading to
the preference dataset
D
=
v
k
, θ
k
| k = 1, , K
. (4)
2.2. Model
We assume that the user generates tuning parameter values
θ
k
at consent times via adjustments m
k
, according to a
preferred steering function
θ
k
= v
T
k
φ
k
,(5)
where
φ
k
are the steering parameter values that are pre-
ferred by the user, and
θ
k
are the preferred (environment-
dependent) tuning parameter values. Due to dexterity issues,
inherent uncertainty on the patient’s part, and other dis-
turbing influences, the adjustment that is provided by the
user will contain noise. We model this as an additive white
Gaussian “adjustment noise” contribution ε
k
∼ N (0, σ
2
θ
)
to the “ideal adjustment” λ
k
=
θ
k
− θ(t
k
− τ)(and with
∼ N (μ, Σ) we mean a variable that is distributed as a normal
distribution with mean μ and covariance matrix Σ). Hence,
our model for the user adjustment is
m
k
= λ
k
+ ε
k
=
θ
k
−θ
t
k
−τ
+ ε
k
= v
T
k
·
φ
k
−φ
k−1
+ ε
k
.
(6)
Consequently, our preference data is generated as
θ
k
= v
T
k
φ
k
+ ε
k
, ε
k
∼ N
0, σ
2
θ
. (7)
Since the preferred steering vector φ
k
is unknown and we
want to predict future values for the tuning parameter θ
k
,
we introduce stochastic variables φ
k
and θ
k
and propose the
following probabilistic generative model for the preference
data:
θ
k
= v
T
k
φ
k
+ ε
k
, ε
k
∼ N
0, σ
2
θ
. (8)
According to (8), the probability of observing variable θ
k
is
conditionally Gaussian:
p
θ
k
φ
k
, v
k
=
N
v
T
k
φ
k
, σ
2
θ
. (9)
We now postulate that minimization of the expected adjust-
ment noise will lead to increased user satisfaction since
predicted values for the tuning parameter variable θ
k
will be
more reflecting the desired values. Hence, we define a utilit y
function for the personalization problem:
U(v, θ, φ)
=−
θ − v
T
φ
2
, (10)
where steering parameters φ are now also used as utility
parameters. We find personalized tuning parameters θ
∗
by
setting them to the value that maximizes the expected utility
EU(v, θ) for the user:
θ
∗
(v) = argmax
θ
EU(v, θ)
= argmax
θ
p(φ|D)U(v, θ, φ)dφ
= argmin
θ
p(φ|D)
θ − v
T
φ
2
dφ.
(11)
The maximum expected utility is reached when we set
θ
∗
(v) = v
T
φ, (12)
where
φ is the posterior mean of the utility parameters:
φ = E[φ|D] =
φp(φ|D)dφ. (13)
The goal is therefore to infer the posterior over the utility
parameters given a preference dataset D. During online
processing, we find the optimal tuning parameters as
θ
∗
v(t)
= v
T
(t)
φ. (14)
The value for
φ can be learned either offline or online. In the
latter case, we will make recursive estimates of
φ
k
, and apply
those instead of
φ.
Our personalization method is shown schematically in
Figure 3, where we represent the uncertainty in the user
action θ as a behav ioral model B that links utilities to actions
by applying an exponentiation to the utilities.
2.3. Offline training
If we perform offline training, we let the patient walk around
with the HA (or present acoustic signals in a clinical setting),
and let him manipulate the control wheel to his liking in
order to collect an offline dataset D as in (4). To emphasize
the time-invariant nature of φ in an offline setting, we will
4 EURASIP Journal on Audio, Speech, and Music Processing
y
H
x
m
θ
EVC
v
+
×
φ
p(φ
|θ)
arg max
EU
θ
z
−1
Bayes
p(θ
|φ)
BU
v
p(φ)
Figure 3: System flow diagram for online personalization of a
hearing aid algorithm.
omit the index k from φ
k
. Our goal is then to infer the
posterior over the utility parameters φ given dataset D:
p
φ|D, σ
2
θ
, σ
2
φ
; v
∝
p
D|φ, σ
2
θ
; v
p
φ|σ
2
φ
; v
, (15)
where prior p(φ
|σ
2
φ
; v)isdefinedas
p
φ|σ
2
φ
=
N
0, σ
2
φ
I
, (16)
and the likelihood term equals
p
D|φ, σ
2
θ
; v
=
K
k=1
N
θ
k
|v
T
k
φ, σ
2
θ
. (17)
Then, the maximum a posteriori solution for φ is
φ
MAP
=
V
T
V + σ
−2
φ
I
−1
V
T
Θ, (18)
and coincides with the MMSE solution. Here, we defined
Θ
= [θ
1
, , θ
K
]
T
and the K × d-dimensional feature
matrix V
= [v
1
, , v
K
]
T
. By choosing a different prior
p(φ), one may, for example, emphasize sparsity in the utility
parameters. In Section 3, we will evaluate a method for
offline regression that uses a marginal prior that is more
peaked than a Gaussian one, and hence it performs sound
feature selection and fitting of utility parameters at the same
time. Such an offline feature selection stage is not strictly
necessary, but it can make the consecutive online learning
stage in the field more (computationally) efficient.
2.4. Online training
During online training, the parameters φ are updated after
every consent moment k. The issue is then how to update
φ
k−1
on the basis of the new data {v
k
, θ
k
}.Wewillnow
present a recursive algorithm for computing the optimal
steering vector φ
∗
, that is, enabling online updating of φ
k
.
We leave open the possibility that user preferences change
over time, and allow the steering vector to “drift” with some
white Gaussian (state) noise ξ
k
. Hence, we define observation
vector θ
k
and state vector φ
k
as stochastic variables with
conditional probabilities p(θ
k
|φ
k
, v
k
) = N (v
T
k
φ
k
, σ
2
θ
k
)and
p(φ
k
|φ
k−1
) = N (φ
k−1
, σ
2
φ
k
I), respectively. In addition, we
specify a prior distribution p(φ
0
) = N (μ
0
, σ
2
φ
0
I). This leads
to the following state space model for online preference data:
φ
k
= φ
k−1
+ ξ
k
, ξ
k
∼ N
0, σ
2
φ
k
I
,
θ
k
= v
T
k
φ
k
+ ε
k
, ε
k
∼ N
0, σ
2
θ
k
.
(19)
We can recursively estimate the posterior probability of φ
k
given new user feedback θ
k
:
p(φ
k
|θ
1
, , θ
k
) = N (
φ
k
, Σ
k
) (20)
according to the Kalman filter [3]:
Σ
k|k−1
= Σ
k−1
+ σ
2
φ
k
I,
K
k
= Σ
k|k−1
v
k
v
T
k
Σ
k|k−1
v
k
+ σ
2
θ
k
−1
,
φ
k
=
φ
k−1
+ K
k
θ
k
−v
T
k
φ
k−1
,
Σ
k
=
I − K
k
v
T
k
Σ
k|k−1
,
(21)
where σ
2
φ
k
and σ
2
θ
k
are (time-varying) state and observation
noise variances. The rate of learning in this algorithm
depends on these noise variances. Online estimates of the
noise variances can be made by the Jazwinski method [4]
or by using recursive EM. The state noise can become high
when a transition to a new dynamic regime is experienced.
The observation noise measures the inconsistency in the user
response. The more consistently the user operates the control
wheel, the less the estimated observation noise and the higher
the learning rate will be.
In summary, after detecting the kth consent, we update φ
according to
φ
k
=
φ
k−1
+ K
k
θ
k
−v
T
k
φ
k−1
=
φ
k−1
+ Δφ
k
.
(22)
2.5. Leaving the user in control
As mentioned before, we use the posterior mean
φ
k
to
update steering vector φ with a factor of Δφ
k
. By itself,
an update would cause a shift v
T
k
Δφ
k
in the perceived
value for tuning parameter θ
k
. In order to compensate
for this undesired effect, the value of the control wheel
register m
k
is decreased by the same amount. The complete
online algorithm (excluding Kalman intricacies) is shown
in Figure 4. In our algorithm, we update the posterior over
the steering parameters immediately after each user control
action, but the effect of the updating becomes clear to the
user only when he enters a different environment (which
will lead to very different acoustical features v(t)). Further,
the “optimal” environmental steering θ
∗
(t) = v
T
(t)
φ
k
(i.e.,
without the residual m(t)) is applied to the user at a much
larger time scale. This ensures that the learning part of the
algorithm (lines (5)–(7)) leads to proper parameter updates,
whereas the steering part (line (3)) does not suffer from
sudden changes in the perceived sounds due to a parameter
update. We say that “the user remains in control” of the
steering at all times.
Alexander Ypma et al. 5
(1) t = 0, k = 0,
φ
0
= 0
(2) repeat
(3) θ(t)
= v
T
(t)
φ
k
+ m(t)
(4) if DetectExplicitConsent
= TRUE then
(5) k
= k +1
(6) θ
k
= v
T
k
φ
k−1
+ m
k
(7) Δφ
k
= Kalman update
θ
k
, φ
k−1
(8)
φ
k
=
φ
k−1
+ Δφ
k
(9) m
k
= m
k
−v
T
k
Δφ
k
(10) end if
(11) t
= t +1
(12) until forever
Figure 4: Online parameter learning algorithm.
By maximizing the expected utility function in (10), we
focus purely on user consent; we consider a new user action
m
k
as “just” the generation of a new target value θ
k
.We
have not (yet) modeled the fact that the user will react on
updated settings for φ, for example, because these settings
lead to unwanted distortions or invalid predictions for θ
in acoustic environments for which no consent was given.
The assumption is that any induced distortions will lead to
additional user feedback, which can be handled in the same
manner as before.
Note that by avoiding a sense of being out of control,
we effectively make the perceived distortion part of the
optimization strategy. In general, a more elaborate model
would fully close the loop between hearing aid and user by
taking expected future user actions into account. We could
then maximize an expected “closed-loop” utility function
U
CL
= U + U
D
+ U
A
,whereU is shorthand for the earlier
utility function of (10), utility term U
D
expresses other
perceived distortions, and utility term U
A
reflects the cost of
making (too many) future adjustments.
2.6. Example: a simulated learning volume control
We performed a simulation of a learning volume control
(LVC), where we made illustrative online regression of
broadband gain (volume
= θ(t)) at input power level (log
of smoothed RMS value of the input signal
= v(t)). As
input, we used a music excerpt that was preprocessed to
give one-dimensional log-RMS feature values. This was fed
to a simulated user who was supposed to have a (one-
dimensional) preferred steering vector φ
∗
(t). During the
simulation, noisy corrections m
t
were fed back from the user
to the LVC in order to make the estimate φ
k
resemble the
preferred steering vector φ
∗
(t). We simulated a user who has
time-varying preferences. The preferred φ
∗
(t) value changed
throughout the input that was played to the user, according
to consecutive preference modes φ
∗
1
= 3, φ
∗
2
=−2, φ
∗
3
=
0, and φ
∗
4
= 1. With φ
∗
l
, we mean the preferred value
during mode l. A mode refers to a preferred value during
a consecutive set of time samples when playing the signal.
Further, feature values v(t) are negative in this example.
Therefore a ne gative value of φ
∗
(t)leadstoaneffective
amplification, and vice versa for positive φ
∗
(t).
0.40.350.30.250.20.150.10.050
s
Desired
Output
−10
10
y(t)
log RMS of output signal
(a)
0.40.350.30.250.20.150.10.050
s
Desired
Learned
−5
5
φ(t)
Steering parameter
(b)
0.40.350.30.250.20.150.10.050
s
−5
5
m(t)
User-applied control actions
(c)
Figure 5: Volume control simulation without learning. (a) Realized
output signal y(t) (in log RMS) versus desired signal y
∗
(t). (b)
Desired steering parameter φ
∗
(t)versus
φ(t). (c) Noisy volume
adjustments m(t) applied by the virtual user.
Moreover, the artificial user experiences a threshold on
his annoyance, which will determine if he will make an
actual adjustment. When the updated value comes close to
the desired value φ
∗
(t) at the corresponding time, the user
stops making adjustments. Here we predefined a threshold
on the difference
|φ
∗
(t) − φ
k−1
| to quantify “closeness.”
In the simulation, the threshold was put to 0.02; this will
lead to many user adjustments for the nonlearning volume
control situation. Increasing this threshold value will lead to
less difference in the amount of user adjustments between
learned and nonlearned cases. When the difference between
updated and desired values exceeds the threshold, the user
will feed back a correction value m
k
proportional to the
difference (φ
∗
(t) − φ
k−1
), to which Gaussian adjustment
noise is added. The variance of the noise changed throughout
the simulation according to a set of “consistency modes.”
Finally, we omitted the discount operation in this example
since we merely use this example to illustrate the behavior of
inconsistent users with changing preferences.
We analyzed the behavior when the LVC was part of
the loop, and compared this to the situation without an
LVC. In the latter case, user preferences are not captured in
updated values for φ, and the user annoyance (as measured
by the number of user actions) will be high throughout the
simulation. In Figure 5(a), we show the (smoothed) log-RMS
value of the desired output signal y(t) in blue. The desired
6 EURASIP Journal on Audio, Speech, and Music Processing
0.40.350.30.250.20.150.10.050
s
Desired
Output
−10
0
10
y(t)
log RMS of output signal
(a)
0.40.350.30.250.20.150.10.050
s
Desired
Learned
−5
0
5
φ(t)
Steering parameter
(b)
0.40.350.30.250.20.150.10.050
s
−5
0
5
m(t)
User-applied control actions
(c)
Figure 6: Learning volume control; graphs as in Figure 5.
output signal is computed as y
∗
(t) = f (φ
∗
(t)v(t))·x(t),
where v(t) is the smoothed log-RMS value of input signal
x(t), and f (
·) is some fixed function that determines how
the predicted hearing aid parameter is used to modify the
incoming sound. The log-RMS of the realized output signal
y(t)
= f (m(t))·x(t) is plotted in red. The value for φ(t)is
fixed to zero in this simulation (see Figure 5(b)). Any noise
in the adjustments will be picked up in the output unless
the value for φ
∗
(t) happens to be close to the fixed value
φ(t)
= 0. We see in Figure 5 that the red curve resembles
a noisy version of the blue (target) curve, but this comes
at the expense of many user actions. Any nonzero value
in Figure 5(c) reflects one noisy user adjustment. When
we compare this to Figure 6, we see that by using an LVC
we achieve a less noisy output realization (see Figure 6(a))
and proper tracking of the four preference modes (see
Figure 6(b)) by a relatively small number of user adjustments
(see Figure 6(c)). Note that the horizontal axis in the former
figures is in seconds, demonstrating that this simulation is in
no way realistic of real-world personalization. It is included
to illustrate that in a highly artificial setup an LVC may
diminish the number of adjustments when the noise in the
adjustments is high and the user preference changes with
time. We study the real-world benefits of an algorithm for
learning control in Section 5.
3. ACOUSTIC FEATURE SELECTION
We now turn to the problem of finding a relevant (and
nonredundant) set of acoustic features v(t)inanoffline
setting. Since user preferences are expected to change mainly
over long-term usage, the coefficients φ are considered
stationary for a certain data collection experiment. In
this section, three methods for sparse linear regression
are reviewed that aim to select the most relevant input
features in a set of precollected preference data. The first
method, Bayesian backfitting, has a great reputation for
accurately pruning large-dimensional feature vectors, but
it is computationally demanding [5]. We also present two
fast heuristic feature selection methods, namely, forward
selection and backward elimination. In this section, both
of the Bayesian and heuristic feature selection methods are
quickly reviewed, and experimental evaluation results are
presented. To emphasize the offline nature, we will index
samples with i rather than with t or k in the remainder of
this section, or drop the index when the context is clear.
3.1. Bayesian backfitting regression
Backfitting [6] is a method for estimating the coefficients φ
of linear models of the form
θ
=
d
m=1
φ
m
v
m
(x)+ε, ε ∼ N (0, Σ). (23)
Backfitting decomposes the statistical estimation problem
into d individual estimation problems by creating “hidden
targets” z
m
for each term φ
m
v
m
(x) (see Figure 7). It decouples
the inference in each dimension, and can be solved with
an efficient expectation-maximization (EM) algorithm that
avoids matrix inversion. This can be a very lucrative option
if the input dimensionality is large. A probabilistic version
of backfitting has been derived in [5], and in addition it is
possible to assign prior probabilities to the coefficients φ.For
instance, if we choose
p(φ
|α) =
m
N
0,
1
α
m
,
p(α)
=
m
Gamma(λ
m
, ν)
(24)
as (conditional) priors for φ and α, then it can be shown
[7] that the marginal prior p(φ)
=
p(φ|α)p(α)dα over the
coefficients is a multidimensional Student’s t-distribution,
which places most of its probability mass along the axial
ridges of the space. At these ridges, the magnitude of only
one of the parameters is large; hence this choice of prior
tends to select only a few relevant features. Because of this so-
called automatic relevance determination (ARD) mechanism,
irrelevant or redundant components will have a posterior
mean
α
m
→∞; so the posterior distribution over the
corresponding coefficient φ
m
will be narrow around zero.
Hence, the coefficients that correspond to irrelevant or
redundant input features become zero. Effectively, Bayesian
backfitting accomplishes feature selection and coefficient
optimization in the same inference framework.
We have implemented the Bayesian backfitting procedure
by the variational EM algorithm [5, 8],whichisageneral-
ization of the maximum likelihood-based EM method. The
Alexander Ypma et al. 7
complexity of the full variational EM algorithm is linear in
the input dimensionality d (but scales less favorably with
sample size). Variational Bayesian (VB) backfitting is a fully
automatic regression and feature selection method, where
the only remaining hyperparameters are the initial values
for the noise variances and the convergence criteria for the
variational EM loop.
3.2. Fast heuristic feature selection
For comparison, we present two fast greedy heuristic feature
selection algorithms specifically tailored for the task of linear
regression. The algorithms apply (1) forward selection (FW)
and (3) backward elimination (BW), which are known to be
computationally attractive strategies that are robust against
overfitting [9]. Forward selection repetitively expands a set
of features by always adding the most promising unused
feature. Starting from an empty set, features are added one
at a time. Once, selected features have been never removed.
Backward elimination employs the reverse strategy of FW.
Starting from the complete set of features, it generates an
ordering at each time taking out the least promising feature.
In our implementation, both algorithms apply the following
general procedure.
(1) Preprocessing
For all features and outputs, subtract the mean and scale to
unit variance. Remove features without variance. Precalcu-
late second-order statistics on full data.
(2) Ten-fold cross-validation
Repeat 10 times.
(a) Split dataset: randomly take out 10% of the samples
for validation. The statistics of the remaining 90% are
used to generate the ranking.
(b) Heuristically rank the features (see below).
(c) Evaluate the ranking to find the number of features k
that minimizes the validation error.
(3) Wrap-up
From all 10 values k (found at 2c), select the median k
m
.
Then, for all rankings, count the occurrences of a feature in
the top k
m
to select the k
m
most popular features, and finally
optimize their weights on the full dataset.
The difference between the two algorithms lies in the
ranking strategy used at step 2b. To identify the most promis-
ing feature, FW investigates each (unused) feature, directly
calculating training errors using (B.5)ofAppendix B.In
principle, the procedure can provide a complete ordering
of all features. The complexity, however, is dominated by
the largest sets; so needlessly generating them is rather
inefficient. FW therefore stops the search early when the
minimal validation error has not decreased for at least
10 runs. To identify the least promising feature, our BW
φ
1
φ
2
φ
M
v
1
v
2
v
M
z
1
z
2
z
M
K
θ
Figure 7: Graphical model for probabilistic backfitting. Each circle
or square represents a variable. The values of the shaded circles
are observed. Unshaded circles represent hidden (unobserved)
variables, and the unshaded squares are for variables that we need
to choose.
algorithm investigates each feature still being a part of the
set and removes the one that provides the largest reduction
(or smallest increase) of the criterion in (B.5). Since BW
spends most of the time at the start, when the feature set is
still large, not much can be gained using an early stopping
criterion. Hence, in contrast to FW, BW always generates a
complete ordering of all features. Much of the computational
efficiency in the benchmark feature selection methods comes
from a custom-designed precomputation of data statistics
(see Appendix B).
3.3. Feature selection experiments
We compared the Bayesian feature selection method to the
benchmark methods with respect to the ability to detect irrel-
evant and redundant features. For this purpose, we generated
artificial regression data according to the procedure outlined
in Appendix A. We denote the total number of features in
a dataset by d, and the number of irrelevant features by d
ir
.
The number of redundant features is d
red
, and the number of
relevant features is d
rel
. The aim in the next two experiments
is to find a value for k (the number of selected features) that
is equal to the number of relevant features d
rel
in the data.
3.3.1. Detecting irrelevant features
In a first experiment, the number of relevant features is
d
rel
= d − d
ir
and d
ir
= 10. Specifically, the first and
the last five input features were irrelevant for predicting
the output, and all other features were relevant. We varied
the number of samples N as [50, 100, 500, 1000, 10000],
and studied two different dimensionalities d
= [15, 50].
We repeated 10 runs of each feature selection experiment
(each time with a new draw of the data), and trained both
Bayesian and heuristic feature selection methods on the
8 EURASIP Journal on Audio, Speech, and Music Processing
43.532.521.51
log sample size
VB
FW
BW
0
0.1
0.2
0.3
0.4
d = 15
Classification error
(a)
43.532.521.51
log sample size
VB
FW
BW
0
0.2
0.4
0.6
0.8
1
d = 50
(b)
Figure 8: Mean classification error versus log sample size; (a) is for
dimensionality d
= 15, and (b) is for d = 50.
data. The Bayesian method was trained for 200.000 cycles
at maximum or when the likelihood improved less than 1e-
4 per iteration, and we computed the classification error for
each of the three methods. A misclassification is a feature that
is classified as relevant by the feature selection procedure,
whereas it is irrelevant or redundant according to the data
generation procedure, and v.v. The classification error is the
total number of misclassifications in 10 runs normalized
by the total number of features present in 10 runs. The
mean classification results over 10 repetitions (the result
for (d, N)
= (50, 10000) is based on 5 runs) are shown in
Figure 8. We see that for both 15 and 50 features and for
moderate to high sample sizes (where we define moderate
sample size as N
= [100, , 1000] for d = 15 and N =
[1000, , 10000] for d = 50), VB outperforms FW and
performs similar to BW. For small sample sizes, FW and BW
outperform VB.
3.3.2. Detecting redundant features
In a second experiment, we added redundant features
to the data; that is, we included optional step 4 in the
data generation procedure of Appendix B.Thenumberof
redundant features is d
red
= (d − d
ir
)/2, and equals the
number of relevant features d
rel
= d
red
. In this experiment,
d was varied and the output SNR was fixed to 10. The role of
relevant and redundant features may be interchanged, since
4.543.532.521.51
log sample size
VB
FW
BW
0
5
10
15
20
25
30
35
40
Mean size of redundant subset
Figure 9: Estimated d
red
versus log sample size. Upper, middle, and
lower graphs are for d
= 50, 30,20 and d
red
= 20, 10,5.
a rotated set of relevant features may be considered by a
feature selection method as more relevant than the original
ones. In this case, the originals become the redundant ones.
Therefore, we determined the size of the redundant subset
in each run (which should equal d
red
= [5, 10, 20] for d =
[20, 30, 50], resp.). In Figure 9, we plot the mean size of the
redundant subset over 10 runs for different d, d
red
, including
one-standard-deviation error bars. For moderate sample sizes,
both VB and the benchmark methods detect the redundant
subset (though they are biased to somewhat larger values),
but accuracy of the VB estimate drops with small or large
sample sizes (for explanation, see [8]). We conclude that VB
is able to detect both irrelevant and redundant features in
a reliable manner for dimensionalities up to 50 (which was
the maximum dimensionality studied) and moderate sample
sizes. The benchmark methods seem to be more robust to
small sample problems.
4. FEATURE SELECTION IN PREFERENCE DATA
We implemented a hearing aid algorithm on a real-time
platform, and turned the maximum amount of noise
attenuation in an algorithm for spectral subtraction into an
online modifiable parameter. To be precise, when performing
speech enhancement based on spectral subtraction (see, e.g.,
[10]), one observes noisy speech x(t)
= s(t)+n(t), and
assumes that speech s(t) and noise n(t) are additive and
uncorrelated. Therefore, the power spectrum P
X
(ω)ofthe
noisy signal is also additive: P
X
(ω) = P
S
(ω)+P
N
(ω).
In order to enhance the noisy speech, one applies a gain
function G(ω)infrequencybinω, to compute the enhanced
signal spectrum as Y(ω)
= G(ω)X(ω). This requires an
estimate of the power spectrum of the desired signal
P
Z
(ω)
since, for example, the power spectral subtraction gain is
Alexander Ypma et al. 9
computed as G(ω) =
P
Z
(ω)/P
X
(ω). If we choose the
clean speech spectrum P
S
(ω) as our desired signal, an
attempt is made to remove all the background noise from
the signal. This is often unwanted since it leads to audible
distortions and loss of environmental awareness. Therefore,
one can also choose
P
Z
(ω) =
P
S
(ω)+κ
P
N
(ω), where
0
≤ κ ≤ 1 is a parameter that controls the remaining
noise floor. The optimal setting of gain depth parameter κ
is expected to be user- and environment-dependent. In the
experiments with learning noise control, we therefore let
the user personalize an environment-dependent gain depth
parameter.
Six normal hearing subjects were exposed in a lab trial
to an acoustic stimulus that consisted of several speech and
noise snapshots picked from a database (each snapshot is
typically in the order of 10 seconds), which were combined
in several ratios and appended. This led to one long stream
of signal/noise episodes with different types of signals
and noise in different ratios. The subjects were asked to
listen to this stream several times in a row and to adjust
the noise reduction parameter as desired. Each time an
adjustment was made, the acoustic input vector and the
desired noise reduction parameter were stored. At the end
of an experiment, a set of input-output pairs was obtained
from which a regression model was inferred using offline
training.
We postulated that two types of features are relevant for
predicting noise reduction preferences. First, a feature that
codes for speech intelligibility is likely to explain some of the
underlying variance in the regression. We proposed three
different “speech intelligibility indices:” speech probability
(PS), signal-to-noise ratio (SNR), and weighted signal-to-
noise ratio (WSNR). The PS feature measures the probability
that speech is present in the current acoustic environment.
Speech detection occurs with an attack time of 2.5 seconds
and a release time of 10 seconds. These time windows refer
to the period during which speech probability increases from
0 to 1 (attack), or decreases from 1 to 0 (release). PS is
therefore a smoothed indicator of the probability that speech
is present in the current acoustic scene, not related to the
time scales (of milliseconds) at which a voice activity detector
would operate. The SNR feature is an estimate of the average
signal-to-noise ratio in the past couple of seconds. The
WSNR feature is a signal-to-noise ratio as well, but instead
of performing plain averaging of the signal-to-noise ratios
in different frequency bands, we now weight each band with
the so-called “band importance function” [11] for speech.
This is a function that puts higher weight to bands where
speech has usually more power. The rationale is that speech
intelligibility will be more dependent on the SNR in bands
where speech is prevalent. Since each of the features PS, SNR
and WSNR codes for “speech presence,” we expect them to
be correlated.
Second, a feature that codes for perceived loudness may
explain some of the underlying variance. Increasing the
amount of noise reduction may influence the loudness of
the sound. We proposed broadband power (Power)asa
“loudness index,” which is likely to be uncorrelated with
the intelligibility indices. The features WSNR, SNR, and
Power were computed at time scales of 1, 2, 3.5, 5, 7.5, and 10
seconds, respectively. Since PS was computed at only one set
of (attack and release) time scales, this led to 3
× 6+1= 19
features. The number of adjustments for each of the subjects
was [43, 275, 703, 262, 99,1020]. This means that we are in the
realm of moderate sample size and moderate dime nsionality,
for which VB is accurate (see Section 3.3).
We then trained VB on the six datasets. In Figure 10,
we show for four of the subjects a Hinton diagram of the
posterior mean values for the variance (i.e., 1/
α
m
). Since
the PS feature is determined at a different time scale than
the other features, we plotted the value of 1/
α
m
that was
obtained for PS on all positions of the time scale axis.
Subjects 3 and 6 adjust the hearing aid parameter primarily
based on feature types: Power and WSNR.Subjects1and5
only used the Power feature, whereas subject 4 used all feature
types (to some extent). Subject 2 data could not be fit reliably
(noise variances ψ
zm
were high for all components). No
evidence was found for a particular time scale since relevant
features are scattered throughout all scales. Based on these
results, broadband power and weighted SNR were selected as
features for a subsequent clinical trial. Results are described
in the next section.
5. HEARING AID PERSONALIZATION
IN PRACTICE
To investigate the relevance of the online learning model
and the previously selected acoustic features, we set up
a patient trial. We implemented an experimental learning
noise control on a hearing aid, where we used the previously
selected features for prediction of the maximum amount of
attenuation in a method for spectral subtraction. During
the trial, 10 hearing impaired patients were fit with these
experimental hearing aids. Subjects were uninformed about
the fact that it was a learning control, but only that
manipulating the control would influence the amount of
noise in the sound. The full trial consisted of a field trial,
a first lab test halfway through the field trial, and a second
lab test after the field trial. During the first fitting of
the hearing instruments (just before the start of the field
trial), a speech perception in noise task was given to each
subject to determine the speech reception threshold in noise
[12], that is, the SNR needed for an intelligibility score of
50%.
5.1. Lab test 1
In the first lab test, a predefined set of acoustic stimuli in a
signal-to-noise ratio range of [
−10 dB, 10 dB] and a sound
power level range of [50 dB, 80 dB] SPL was played to the
subjects. SPL refers to sound pressure level (in dB) which is
defined as 20 log(p
sound
/p
ref
), where p
sound
is the pressure of
the sound that is measured and p
ref
is the sound pressure that
corresponds to the hearing threshold (and no A-weighting
was applied to the stimuli). The subjects were randomly
10 EURASIP Journal on Audio, Speech, and Music Processing
107.553.521
Time scale (seconds)
SNR
WSNR
Power
PS
Feature name
(a)
107.553.521
Time scale (seconds)
SNR
WSNR
Power
PS
Feature name
(b)
107.553.521
Time scale (seconds)
SNR
WSNR
Power
PS
Feature name
(c)
107.553.521
Time scale (seconds)
SNR
WSNR
Power
PS
Feature name
(d)
Figure 10: ARD-based selection of hearing aid features. Shown is a Hinton diagram of 1/α
m
, computed from preference data. Clockwise,
starting from (a) subjects nos. 3, 6, 4, and 1. For each diagram (horizontally (from left to right)), there is a time scale (in seconds) at which
a feature is computed. Vertically (from top to bottom): name of the feature. Box size denotes relevance.
divided into two test groups, A and B, in a cross-over design.
Both groups started with a first training phase, and they
were requested to manipulate the hearing instrument on a
set of training stimuli during 10 minutes in order to make the
sound more pleasant. This training phase modified the initial
(default) setting of 8 dB noise reduction into more preferred
one. Then, a test phase contained a placebo part and a test
part. Group A started with the placebo part followed by
the test part, and group B used the reversed order. In the
placebo part, we played another set of sound stimuli during
5 minutes, where we started with default noise reduction
settings and again requested to manipulate the instrument.
In the test part of the test phase, the same stimulus as in
the placebo part was played but training continued from the
learned settings from the training session. Analysis of the
learned coefficients in the different phases revealed that more
learning leads to a higher spread in the coefficients over the
subjects.
5.2. Field trial
In the field trial part, the subjects used the experimental
hearing instruments in their daily life for 6 weeks. They
were requested to manipulate the instruments at will in
order to maximize pleasantness of the listening experience.
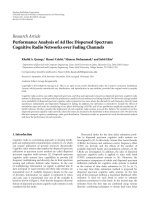
In Figure 11, we give an example of the (right ear) preference
that is learned for subject 12. We visualize the learned
coefficients by computing the noise reduction parameter that
would result from steering by sounds with SNRs in the range
of
−10 to 20 dB and power in the range of 50 to 90 dB.
The color coding and the vertical axis of the learned surface
correspond to the noise reduction parameter that would
be predicted for a certain input sound. Because there is a
nonlinear relation between computed SNR and power (in
the features) and SNR and power of acoustic stimuli, the
surface plot is slightly nonlinear as well. It can be seen that for
high power and high SNR, a noise reduction of about 1 dB
Alexander Ypma et al. 11
−10
−5
0
5
10
15
20
SNR (dB)
90
80
70
60
50
Power (dB)
1
2
3
4
5
6
7
Noise reduction (dB)
1.5
2
2.5
3
3.5
4
4.5
5
5.5
6
6.5
Learned surface for right ear subject 12
Figure 11: Noise reduction preference surface for subject 12.
is obtained, which means that noise reduction is virtually
inactive. For low power and low SNR, the noise reduction is
almost equal to 7 dB, which means moderate noise reduction
activity. The learned coefficients (and therefore also the noise
reduction surfaces) show quite some variation among the
subjects. Some are perfectly symmetric over the ears; others
are quite asymmetric.
To assess this variation, we computed an estimate of
the perceived “average noise reduction” over sounds ranging
from SNR
−10 to 20 dB and power ranging from 50 to
90 dB. Sounds in this range will be particularly relevant to
the hearing impaired since below SNR of
−10 dB virtually
no intelligibility is left, and above 20 dB there is not much
noise to suppress. Similarly, sounds with power below
50 dB will be almost inaudible to the hearing impaired.
We call this estimate the “effective offset”—an estimate of
the environment-independent part of the preferred noise
reduction in the relevant acoustic range. The estimate was
obtained by sampling the learned surface uniformly over
the relevant acoustic range and computing the mean noise
reduction parameter. This was done separately for each ear
of each subject. The effective offset for left and right ears
of all subjects is shown in the scatter plot of Figure 12.For
example, subject 12 has an effective offset of approximately
4 dB in the right ear. This is visible in Figure 11 as a center of
gravity of 4 dB.
From Figure 12, most subjects exhibit more or less
symmetric noise reduction preference. However, subjects 8
and 10 (and to a lesser extent subjects 7 and 12) show a fair
amount of asymmetry, and all these four subjects preferred
learned settings over default noise reduction in lab trial 2.
The need for personalization becomes clear from Figure 12
as well since the learned average parameter preferences cover
almost the full range of the noise reduction parameter.
5.3. Lab test 2
Subjects from group A listened to 5 minutes of acoustic
stimuli using hearing instruments containing the noise
reduction settings that were learned in the field trial. The
sounds were a subset of the sounds in the first lab test
which exhibited large transitions in SNR and SPL, but they
are reflective of typical hearing conditions. The same sound
14121086420
Offset in left ear
s1
s3
s4
s6
s7
s8
s9
s10
s12
s13
0
2
4
6
8
10
12
14
Offset in right ear
Learned effective offset (dB)
Figure 12: Scatter plot of right (vertical) to left (horizontal)
effective offsets for different subjects. Each combination of color
and symbol (see legend) corresponds to one subject in the trial.
Each subject had been trained on left and right hearing aids, and
the position of a symbol denotes the effective offsets learned in
both aids. Most subjects have learned relatively symmetric settings,
with four exceptions (subjects 7, 8, 10, and 12). Noise reduction
preferences are very different among the subjects.
file was played again with default noise reduction settings
of 8 dB in all environments to compare sound quality and
speech perception. Group B did the same in opposite order.
Subjects did not know when default or learned settings were
administered. The subjects were asked which of the two
situations led to the most preferred sound experience. Two
out of ten subjects did not have a preference, three had a
small preference for the learned noise reduction settings,
and five had a large preference for learned noise reduction
settings (so 80% of the subjects had an overall preference for
the learned settings). All subjects in the “majority group” in
our trial judged the sound quality of the learned settings as
“better” (e.g., “warmer sound” or “less effort to listen to it”),
and seven out of eight felt that speech perception was better
with learned settings. Nobody reported any artifacts of using
the learning algorithm.
When looking more closely into the learned surfaces of
all subjects, more than half of the subjects who preferred
learned over default settings experienced a significantly
sloping surface over the relevant acoustic range. The black
dots on the surface of Figure 11 denote the sounds that have
been used in the stimulus of the second lab test. From the
position of these dots, we observe that during the second lab
test, subject 12 experienced a noise reduction that changed
considerably with the type of sound. We conjecture that the
preference with respect to the default noise reduction setting
12 EURASIP Journal on Audio, Speech, and Music Processing
is partly caused by the personalized environmental steering of
the gain depth parameter.
By comparing the results of a final speech perception in
noise task to those of the initial speech perception task in
the initial fitting, it was concluded that the learned settings
have no negative effect on conversational speech perception
in noise. In fact, a lower speech reception threshold in noise
was found with learned settings. However, a confounding
factor is the prolonged use of new hearing instruments which
may explain part of the improved intelligibility with learned
settings.
6. DISCUSSION
In our approach to online personalization, an optional offline
feature selection stage is included to enable more efficient
learning during hearing aid use. From our feature selection
experiments on synthetic data, we conclude that variational
backfitting (VB) is a useful method for doing accurate
regression and feature selection at the same time, provided
that sample sizes are moderate to high and computation time
is not an issue. Based on our preference data experiment, we
selected the features of Power and WSNR for an experimental
online learning algorithm. For one of the users, either the
sample size was too low, his preference was too noisy, or the
linearity assumption of the model might not hold. In our
approach, we expect model mismatch (e.g., departure from
linearity of the user’s internal preference model) to show up
as increased adjustment noise. Hence, a user who will never
be fully satisfied with the linear mapping between features
and noise reduction parameters because of model mismatch
is expected to end up with a low learning rate (in the limit of
many ongoing adjustments).
Our online learning algorithm can be looked upon as
an interactive regression procedure. In the past, work on
interactive curve fitting has been reported (e.g., see [13]).
However, this work has limited value for hearing aid appli-
cation since it requires an expensive library optimization
procedure (like Nelder-Mead optimization) and probing of
the user for ranking of parameter settings. In online settings,
the user chooses the next listening experiment (the next
parameter-feature setting for which a consent is given) rather
than the learning algorithm. However, in the same spirit as
this method, one may want to interpret a consent moment as
a “ranking” of a certain parameter-feature setting at consent
over a different setting at the preceding dissent moment. The
challenge is then to absorb such rankings in an incremental,
computationally efficient, and robust fashion. Indeed, we
think that our approach to learning control can be adopted to
other protocols (like learning from explicit dissent) and other
user interfaces. Our aim is to embed the problem in a general
framework for optimal Bayesian incremental fitting [14, 15],
where a ranking of parameter values is used to incrementally
train a user preference model.
In our second lab test, 80% of the subjects preferred
learned over default settings. This is consistent with the
findings by Zakis [2] who performed (semi-) online person-
alization of compressor gains using a standard least-squares
method. Subjects had to confirm adjustments to a hearing
aid as explicit training data, and after at least 50 “votes” an
update to the gains was computed and applied. In two trials,
subjects were asked to compare two settings of the aid during
their daily life, where one setting was “some good initial
setting” and the other was the “learned setting.” The majority
of the subjects preferred learned settings (70% of the subjects
in the first trial, 80% in the second).
In recent work [16], Zakis et al. extended their per-
sonalization method to include noise suppression. Using
the same semi-on-line learning protocol as before, a linear
regression from sound pressure level and modulation depth
to gain was performed. This was done for three different
frequency (compression) bands separately by letting the
control wheel operate in three different modes, in a cyclical
manner. Modulation depth is used as an SNR estimate in
each band, and by letting the gain in a band be steered with
SNR, a trainable noise suppression can be obtained. Zakis et
al. concluded that the provision of trained noise suppression
did not have a significant additional effect on the preference
for trained settings.
Although their work clearly demonstrates the potential of
online hearing aid personalization, there are some issues that
may prevent a successful practical application. First, their
noise suppression personalization comes about by making
per-band gains depend on per-band SNR. This requires a
“looping mode implementation” of their learning control,
where different bands are trained one after the other. This
limits the amount of spectral resolution of the trainable
noise suppression gain curve. In our approach, a 17-band
gain curve is determined by a noise reduction method
based on spectral subtraction, and we merely personalize
an “aggressiveness” handle as a function of input power
and weighted SNR. Apparently, a perceptual benefit may be
obtained from such a learning noise control.
Furthermore, the explicit voting action and the looping
mode of the gain control in [16] can make acceptance in the
real world more difficult. We designed our learning control
in such a way that it can be trained by using the hearing
aid in the same way as a conventional hearing aid with
control wheel. Further, in [16] environmental features have
to be logged for at least 50 user actions, and additional
updating requires a history of 50 to 256 votes, which
limits the practicality of the method. Many users operate a
control wheel for only a couple of times per day; so real-
world learning with these settings may require considerable
time before convergence is reached. In our approach, we
learn incrementally from every user action, allowing fast
convergence to preferred settings and low computational
complexity. This is important for motivating subjects to
operate the wheel for a brief period of time and then “set
it and forget it” for the remainder of the usage. The faster
reaction time of our algorithm comes at the expense of more
uncertainty during each update, and by using a consistency
tracker we avoid large updates when the user response
contains a lot of uncertainty.
Interestingly, Zakis et al. found several large asymmetries
between trained left and right steering coefficients, which
they attribute to symmetric gain adjustments with highly
asymmetric SPL estimates. We also found some asymmetric
Alexander Ypma et al. 13
preferences in noise reduction. It is an open question
whether these asymmetries are an artifact of the asymmetries
in left and right sound fields or they reflect an actual
preference for asymmetric settings with the user.
7. CONCLUSIONS
We described a new approach to online personalization
of hearing instruments. Based on a linear mapping from
acoustic features to user preferences, we investigated efficient
feature selection methods and formulated the learning
problem as the online maximization of the expected user
utility. We then implemented an algorithm for online
personalization on an experimental hearing aid, where we
made use of the features that were selected in an earlier
listening test. In a patient trial, we asked 10 hearing impaired
subjects to use the experimental hearing aid in their daily life
for six weeks. We then asked each patient to choose between
the learned hearing aid settings and a (reasonable) default
setting of the instrument. In this blind laboratory test, 80% of
the subjects chose the learned settings, and nobody reported
any artifacts of using the learning algorithm.
APPENDICES
A. DATA GENERATION
For evaluation of the feature selection methods, we generated
artificial regression data according to the following proce-
dure.
(1) Choose total number of features d and number
of irrelevant features d
ir
. The number of relevant
features is d
rel
= d −d
ir
.
(2) Generate N samples from a normal distribution of
dimension d
− d
ir
/2. Pad the input vector with d
ir
/2
zero dimensions.
(3) Regression coefficients b
m
, m = 1, , d were drawn
from a normal distribution, and coefficients with
value
|b
m
| < 0.5wereclippedto|0.5|. The first d
ir
/2
coefficients were put to zero.
(4) (Optional) Choose number of redundant features
d
red
= (d − d
ir
)/2. The number of relevant features
is now d
rel
= d
red
. Take the relevant features [d
ir
/2+
1, , d
ir
/2+d
rel
], rotate them with a random rotation
matrix, and add them as redundant features by
substituting features [d
ir
/2+d
rel
+1, , d
ir
/2+d
rel
+
d
red
].
(5) Outputs were generated according to the model;
Gaussian noise was added at an SNR of 10.
(6) An independent test set was generated in the same
manner, but the output noise was zero in this case
(i.e., an infinite output SNR).
(7) In all experiments, inputs and outputs were scaled to
zero mean and unit variance after the data generation
procedure. Unnormalized weights were found by
inversely transforming the weights found by the
algorithms. The noise variance parameters ψ
zm
and
ψ
y
were initialized to 0.5/(d + 1), thus assuming a
total output noise variance that is 0.5 initially. We
noticed that initializing the noise variances to large
values led to slow convergence with large sample
sizes. Initializing to 0.5/(d+1) alleviated this problem.
B. EFFICIENT PRECOMPUTATION
The standard least-squares error of a linear predictor, using
weight vector b and ignoring a constant term for the output
variance, is calculated by
J
= b
T
Rb −2r
T
b,(B.1)
where R is the autocorrelation matrix defined as
R
=
i
x
i
x
T
i
(B.2)
and r is the cross-correlation vector defined as
r
=
i
y
i
x
i
. (B.3)
Finding the optimal weights for b, using standard least-
squares fitting, requires a well-conditioned invertible matrix
R, which we ensure using a custom-designed regularization
technique of adding a small fraction λ
∝ 10
−N/k
to the
diagonal elements of the correlation matrix. Here, N refers
to the number of samples and k refers to the number of
selected features in the dataset. Since the regularized matrix R
is a nonsingular symmetrical positive definite matrix, we can
use a Choleski factorization, providing an upper triangular
matrix C satisfying the relation C
T
C = R,toefficiently
compute the least-squares solution
b
= R
−1
r = C
−1
C
−1
T
r. (B.4)
Moreover, since intermediate solutions of actual weight
values are often unnecessary because it sufficestohavean
error measure for a particular subset s (with auto- and cross-
correlations R
s
and r
s
obtained by selecting corresponding
rows and columns of R and r,withC
s
being the correspond-
ing Choleski factorization), we can directly insert (B.4) into
(B.1)toefficiently obtain the error on the training set using
J
s
=−
C
−1
s
r
s
T
C
−1
s
r
s
. (B.5)
Obtaining a Choleski factorization from scratch, to test a
selection of k features, requires a computational complexity
of O(k
3
), and the subsequent matrix division then only
requires O(k
2
). The total effective complexity of the algo-
rithm is O(d
×k
3
).
ACKNOWLEDGMENTS
The authors would like to thank Tjeerd Dijkstra for prepa-
ration of the sound stimuli, and they are grateful to him,
AlmervandenBerg,JosLeenenandRobdeVriesforuseful
discussions. They would also like to thank Judith Verberne
for assistance with the patient trials. All collaborators are
affiliated with GN ReSound Group.
14 EURASIP Journal on Audio, Speech, and Music Processing
REFERENCES
[1] S. Launer and B. C. J. Moore, “Use of a loudness model for
hearing aid fitting—V: on-line gain control in a digital hearing
aid,” International Journal of Audiology, vol. 42, no. 5, pp. 262–
273, 2003.
[2] J.A.Zakis,A trainable hearing aid, Ph.D. thesis, University of
Melbourne, Melbourne, Australia, 2003.
[3] T. Minka, “From hidden Markov models to linear dynamical
systems,” Tech. Rep. 531, Department of Electrical Engineer-
ing and Computer Science, MIT, Cambridge, Mass, USA,
1999.
[4]A.H.Jazwinski,Stochastic Processes and Filtering Theory,
Academic Press, New York, NY, USA, 1970.
[5] A. A. D’Souza, Towards tractable parameter-free statistical
learning, Ph.D. thesis, University of Southern California, Los
Angeles, Calif, USA, 2004.
[6] T. J. Hastie and R. J. Tibshirani, Generalized Additive Models,
Chapman & Hall/CRC, Boca Raton, Fla, USA, 1990.
[7] M. E. Tipping, “Bayesian inference: an introduction to
principles and practice in machine learning,” in Advanced
Lectures on Machine Learning, pp. 41–62, Springer, New York,
NY, USA, 2003.
[8] A. Ypma, S.
¨
Ozer, E. van der Werf, and B. de Vries,
“Bayesian feature selection for hearing aid personalization,” in
Proceedings of the 17th IEEE Workshop on Machine Learning
for Signal Processing (MLSP ’07), pp. 425–430, Thessaloniki,
Greece, August 2007.
[9]I.GuyonandA.Elisseeff, “An introduction to variable and
feature selection,” The Journal of Machine Learning Research,
vol. 3, pp. 1157–1182, 2003.
[10] J. M. Kates, Digital Hearing Aids, Plural Publishing, San Diego,
Calif, USA, 2008.
[11] C. V. Pavlovic, “Band importance functions for audiological
applications,” Ear and Hearing, vol. 15, no. 1, pp. 100–104,
1994.
[12] R. Plomp and A. M. Mimpen, “Improving the reliability
of testing the speech reception threshold for sentences,”
International Journal of Audiology, vol. 18, no. 1, pp. 43–52,
1979.
[13] J. E. Dennis and D. J. Woods, “Interactive graphics for curve-
tailoring,” in New Computing Environments: Microcomputers
in Large-Scale Computing, pp. 123–129, SIAM, Philadelphia,
Pa, USA, 1987.
[14] T. Heskes and B. de Vries, “Incremental utility elicitation for
adaptive personalization,” in Proceedings of the 17th Belgium-
Netherlands Conference on Artificial Intelligence (BNAIC ’05),
pp. 127–134, Brussels, Belgium, October 2005.
[15] T. M. H. Dijkstra, A. Ypma, B. de Vries, and J. R. G. M.
Leenen, “The learning hearing aid: common-sense reasoning
in hearing aid circuits,” The Hearing Review, pp. 40–51,
October 2007.
[16] J. A. Zakis, H. Dillon, and H. J. McDermott, “The design
and evaluation of a hearing aid with trainable amplification
parameters,” Ear and Hearing, vol. 28, no. 6, pp. 812–830,
2007.