Báo cáo hóa học: "Research Article Segmentation of Killer Whale Vocalizations Using the Hilbert-Huang Transform" potx
Bạn đang xem bản rút gọn của tài liệu. Xem và tải ngay bản đầy đủ của tài liệu tại đây (1.63 MB, 10 trang )
Hindawi Publishing Corporation
EURASIP Journal on Advances in Signal Processing
Volume 2008, Article ID 245936, 10 pages
doi:10.1155/2008/245936
Research Article
Segmentation of Killer Whale Vocalizations Using
the Hilbert-Huang Transform
Olivier Adam
Laboratorie d’Images, Signaux et Systemes Intelligents (LiSSi - iSnS), Universit
´
e de Paris 12, 61 avenue de Gaulle,
94010 Creteil Cedex, France
Correspondence should be addressed to Olivier Adam,
Received 1 September 2007; Revised 3 March 2008; Accepted 14 April 2008
Recommended by Daniel Bentil
The study of cetacean vocalizations is usually based on spectrogram analysis. The feature extraction is obtained from 2D methods
like the edge detection algorithm. Difficulties appear when signal-to-noise ratios are weak or when more than one vocalization is
simultaneously emitted. This is the case for acoustic observations in a natural environment and especially for the killer whales
which swim in groups. To resolve this problem, we propose the use of the Hilbert-Huang transform. First, we illustrate how few
modes (5) are satisfactory for the analysis of these calls. Then, we detail our approach which consists of combining the modes
for extracting the time-varying frequencies of the vocalizations. This combination takes advantage of one of the empirical mode
decomposition properties which is that the successive IMFs represent the original data broken down into frequency components
from highest to lowest frequency. To evaluate the performance, our method is first applied on the simulated chirp signals. This
approach allows us to link one chirp to one mode. Then we apply it on real signals emitted by killer whales. The results confirm
that this method is a favorable alternative for the automatic extraction of killer whale vocalizations.
Copyright © 2008 Olivier Adam. This is an open access article distributed under the Creative Commons Attribution License,
which permits unrestricted use, distribution, and reproduction in any medium, provided the original work is properly cited.
1. INTRODUCTION
Marine mammals show a vast diversity of vocalizations from
one species to another and from one individual to another
within a species. This can be problematic in analyzing
vocalizations. The Fourier spectrogram remains today the
classical time-frequency tool used by cetologists [1–3]—
and sometimes the only one proposed—for use with typical
software dedicated to bioacoustic sound analysis, such as
MobySoft Ishmael, RainbowClick, Raven, Avisoft, and XBat,
respectively, developed by [4–8].
In general, when analyzing bioacoustic sounds, posttreat-
ment consists of binarizing the spectrogram by comparing
the frequency energy to a manually fixed threshold [4, 9].
Then, feature extraction of the detected vocalizations is
carried out using 2D methods specific to image processing.
These algorithms, like the edge detection algorithm, are
applied on the time-frequency representations [4, 5, 10].
Though the Fourier transform provides satisfactory
results as far as cetologists are concerned, all hypotheses are
not consistently verified. This is particularly true for the
analysis of continuous recordings when signals and noises
are varying in time and frequency [11]. Moreover, these
time-frequency representations have interference structures,
especially for the type 1 Cohen’s class (e.g., as the Wigner-
Ville distribution) [12]. In addition, the uniform time-
frequency resolution of the spectrogram has drawbacks for
nonstationary signal analysis [13].
To overcome these difficulties, the following approaches
have been recently proposed: parametric linear models
such as autoregressive filters, Schur algorithm, and wavelet
transform [14–17]. A comparative study of these approaches
can be found in [16]. All of these methods are based on
specific functions for providing the decomposition of the
original signals. These functions can present a bias in the
results proving a disadvantage in analyzing a large set of
different signals, such as killer whale vocalizations. Also,
concerning the wavelet transform, it should be noted that,
in general, bioacoustic signals are never decomposed using
the same wavelet family. For example, in analyzing the sperm
whale regular clicks, authors have presented the Mexican hat
wavelet, the wavelet package, and the Daubechies wavelet,
2 EURASIP Journal on Advances in Signal Processing
and so forth [15, 16, 18–20]. It seems that the choice to use
one specific wavelet family is influenced less by the shape of
the sperm whale click than by the global performance on the
complete dataset used by the authors in their application.
Introduced as the generalization of the wavelet transform
[21], the chirplet transform appears a possible solution in
our application because of the specific shape of certain killer
whale vocalizations (e.g., chirps). However, this method has
some disadvantages. First, it requires the presegmentation
of the signals (unnecessary in our method). Second, it is
known that the computation time of the chirplet transform
is lengthy and the proposed method to compensate for this
drawback limits the analysis to one single chirp per preseg-
ment [21, 22]. This is not feasible for our approach because
more than one vocalization is likely to be simultaneously
present in the recordings.
This paper endeavors to adapt the Hilbert-Huang trans-
form (HHT) to the killer whale vocalization detection and
analysis. We introduce the HHT because it is well suited for
nonlinear nonstationary signals analysis [12]. This transform
is used as a reliable alternative to the wavelet transform for
many applications [23, 24], including underwater acoustic
sounds [25, 26]. The detailed advantages are promising for
detecting underwater biological signals even if they have a
wide diversity, as mentioned above. In our previous work,
we have confirmed positive results for the analysis of sperm
whale clicks using the HHT [27, 28].
In these articles, we demonstrated how to detect these
transient signals emitted by sperm whales. The modes
obtained from the HHT were used for extracting and
characterizing sperm whale clicks, as detailed in [29]. We
compared results from different approaches to obtain the
best time resolution. First, this allowed us to characterize the
shape of the emitted sounds (evaluation of the size of the
sperm whale head with precision). Second, we optimized the
computation of time delays for arrivals of the same sound
on different hydrophones to minimize the error margin on
the sperm whale localization. In conclusion, the HHT was
presented as the alternative to the spectrograms.
Also, in these articles, we did not discuss the role of
each mode obtained from the HHT and we did not present
the method based on the combined modes as we do in this
article. Considering that our current work is not only aimed
at illustrating a new application of the HHT but also, through
our application dedicated to killer whale vocalizations, we
introduce an original method based on the combined modes
detailed in the following section.
2. METHOD
Proposed by Huang et al. in 1998 [12], the Hilbert-Huang
transform is based on the following two consecutive steps:
(1) the empirical mode decomposition (EMD) extracts
modes from the original signal. These modes are also referred
to as intrinsic mode functions (IMFs), and (2) by applying
the Hilbert transform on each mode, it is possible to provide
time-frequency representation of the original signal. It is
important to note that (1) the EMD is not defined by
mathematical formalism; the algorithm can be found in [12],
and (2) the second step is optional. Some authors limit their
application solely to the use of the EMD [30, 31].
The use of these modes can be compared to a filter bank
[32]. At time k, the decreasing frequencies are placed in
successive modes, from first to last. Our method takes advan-
tage of this characteristic. Our contribution is an original
process for the segmentation/combination of these modes.
The objective is to link a single killer whale vocalization to a
single mode.
2.1. Brief theory of the HHT
The EMD is applied on the original signal. This decompo-
sition is one of the advantages of this method because no a
priori functions are required: no function has to be chosen,
and consequently, no bias results from this.
The EMD is based on the extraction of the upper
and lower envelopes of the original signal (by extrema
interpolation). The mode is extracted when (1) the number
of the extrema and the number of zero crossings are equal
to or differ at most by one, and (2) the mean of these two
envelopes is equal to zero.
The original sampled signal s(t)is
s(t)
=
M
i=1
c
i
(t)+R
M
(t), (1)
with t, i, M
∈ N. t = 1,2, , T,whereT is the length of the
signal s. M is the number of modes extracted from the signal
using EMD. c
i
is the ith IMF and R
M
the residue. c
i
and R
M
are 1-dimension signals with T samples.
We note that the EMD could be applied on any nonzero-
mean signal. However, each mode is a zero-mean signal. It
is important to note that all the modes are monocomponent
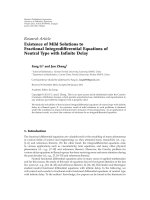
time-variant signals. The algorithm is shown in Figure 1.
The time-frequency representation is provided after
computation of the Hilbert transform on each mode,
c
Hi
(t) = HT(c
i
) = c
i
(t) ⊗
1
πt
,(2)
where
⊗ is the convolution.
From the analytic mode c
Ai
(t) = c
i
(t)+jc
Hi
(t), also
written c
A
i
(t) = a
i
(t)e
jθ
i
(t)
, we define the instantaneous
amplitude response and the instantaneous phase. For each
mode, the instantaneous frequency is obtained by
f
c
i
(t) =
1
2π
dθ
c
i
(t)
dt
. (3)
Lastly, the time variations of the instantaneous frequencies of
each mode correspond to the time-frequency representation.
2.2. Segmentation and combination of the modes
For cetologists, the acoustic observations of a specific
marine zone consist of detecting sounds emitted by marine
mammals. Once achieved, a feature extraction is carried out
to identify the species.
It is possible to use the HHT in performing the emitted
sound detection. We assume that the original zero-mean
Olivier Adam 3
Initialization step:
δ
= value of the stop criterion threshold
i
= 1
residual signal: r
j−1
= s
Sifting process: extraction of c
i
1.j= 1
2. ctmp
i,j−1
= r
i−1
3. Extraction of the local extrema of ctmp
i,j−1
4. Interpolation of the minima and the maxima
to obtain the lower L
i,j−1
and upper U
i,j−1
envelopes
5. Mean of these envelopes: m
i,j−1
= 0.5x(U
i,j−1
+ L
i,j−1
)
6. ctmp
i,j
= ctmp
i,j−1
−m
i,j−1
7. Stop criterion: SD
j
= sum(((|ctmp
i,j−1
−ctmp
i,j
|)
2
)/(ctmp
i,j−1
)
2
)
j
= j +1
N
SD
j
<δ
Y
Saving step:
save the ith IMF: c
i
= ctmp
i,j
Update:
residual signal: r
i
= (r
i−1
−ctmp
i,j
)
n
r
= number of the local extrema of r
i
i = i +1
N
n
r
< 2
Y
End
Figure 1: Algorithm for the IMF extraction from the original signal s.
real signal has not been previously segmented by means of
another technique. The EMD provides a limited number
of modes (IMFs) resulting from this original signal. Note
that each mode is the same length as the original signal
(same number of samples). In any application, the challenge
in using the HHT is in interpreting the contents of each
mode as all signal components are divided between all the
IMFs according to their instantaneous frequency [12]. For
this reason, we propose the segmentation of the modes
in order to link a part of this information to one single
mode. Our method allows for segmentation to be based
on the strong variations of the mode frequencies: these
variations can be used to distinguish the presence of different
chirps (cf. the example detailed in Section 3.1)ordifferent
vocalizations (cf. Section 3.2). Our segmentation is based on
the three following rules: (1) all the modes are composed
by the same number of segments, (2) the jth segments
of all the modes have the same length, and (3) different
segments of one single mode could be different lengths. To
perform this segmentation, we could have used a criterion
based on the discontinuities of the instantaneous amplitude.
But vocalizations show a continuous fundamental frequency
(signal with a constant or time-varying frequency) in their
complete duration (time between two silences like that which
the human ear can hear). Also, for our purposes, we have
chosen to work with variations of the frequencies because
we want to track killer whale vocalizations. Moreover,
tracking the frequency variations for extracting the killer
whale vocalizations is possible because these frequencies
are much higher in pitch than the underwater ambient
noise.
The detection of the frequency variations helps us
identify the exact beginning and end of each vocalization.
For the detection approach, our criterion is based on
the derivative of the instantaneous frequency. But it is
important to keep in mind that the phase is a local
parameter. To avoid fluctuations due mainly to ambient
noise, Cexus et al. have recently proposed the use of the
Teager-Kaiser operator [33]. But this seemingly promising
operator has not been evaluated for our application. Up to
now, we calculate the derivative of the mean instantaneous
frequency for establishing the limits of all segments for one
mode,
g
c
i
(t) =
d f
c
i
(t)
dt
,(4)
where
f
c
i
is the mean of the successive instantaneous
frequencies. This step is added for attenuating the variations
4 EURASIP Journal on Advances in Signal Processing
of these instantaneous frequencies. f
c
i
is the median of
f
c
i
:
f
c
i
(t) =
1
T
w
T
w
/2
k=−T
w
/2
f
c
i
(t −k). (5)
The length T
w
of the time window for providing this
mean depends on the application. In this paper, the T
w
value is empirically established from the study of our
dataset.
The idea of our detection approach is to track the signal
via analysis of the functions g
c
i
. These functions correspond
to the frequency variations of each monocomponent IMF.
Strong variations in these IMFs which indicate the presence
of signal information (start or end of one vocalization)
provoke notable changes in the functions g
c
i
, hypothesis H
0
.
Otherwise, these functions are nearly constant, hypothesis
H
1
. The functions d
c
i
are given by
d
c
i
(t) =
g
c
i
(t) −g
c
i
(t −1)
2
H
1
≷
H
0
η,(6)
where η denotes the comparison threshold. For our applica-
tion, this value is constant (η
= 10%×max(d
c
i
)), but it could
be made adaptive.
When a new vocalization appears in the recordings,
the function g
c
i
calculated from the first mode is suddenly
varying. The value of the detection criterion d
c
i
is superior to
the threshold η.
Moreover, this function g
c
i
will have a positive maximum
and a negative maximum, respectively, for the start and the
end of one single vocalization as the vocalization frequencies
are currently higher than the low ambient noise frequencies.
Moreover, because two vocalizations have two different
main frequencies, g
c
i
will present discontinuities, which are
used for the vocalization segmentation.
Our criterion is successively applied on the first mode,
then the second mode, and so on. At the end of this process,
we obtain all the segments and we can determine their length.
The ith IMF is
c
i
=
c
1
i
|c
2
i
···|c
N
i
,(7)
with c
j
i
being the jth segment of c
i
defined by
c
j
i
=
c
i
(t
j−1
+1),c
i
(t
j−1
+2), c
i
(t
j
+1),c
i
(t
j
)
,(8)
where t
j−1
and t
j
are the time of the last sample of segments
c
j−1
i
and c
j
i
, respectively. Note that t
0
= 0andt
N
= T.
In our approach, we validate either the decreasing shift
or the permutation of the jth segments between two modes
c
i−1
and c
i
. These combinations allow us to link specific
information to one single IMF. Our objective is to track the
fundamental frequency and the harmonics of the killer whale
vocalizations (see Section 3). Each vocalization will be linked
to one mode.
The new mode m is the result of the combined previous
IMF,
m
i
=
c
1
k
|c
2
k
···|c
j
k
|···c
N
k
. (9)
The combination depends on the positive or negative
maximum of g
c
i
, when d
c
i
(t) >η.
(i) max(g
c
i
) > 0. This means that the instantaneous fre-
quency of the end of segment c
j
i
is less than the instantenous
frequency of the start of the next segment c
j+1
i
. Concerning
segment c
j
i
, the vocalization could continue on segment c
j+1
i+1
.
So, our process consists of switching this segment c
j
i
to the
new m
j
i+1
and putting zeros z
j
i
in the new m
j
i
,
z
j
i
=
0
z
i
(t
j−1
+1)
,0
z
i
(t
j−1
+2)
, ,0
z
i
(t
j
−1)
,0
z
i
(t
j
)
. (10)
We repeat this process on the segment of each following
mode: m
j
k+1
= c
j
k
with k ≥ i. Whereas segment c
j+1
i
is the
start of a new vocalization. Our process does not modify this
segment or those that follow.
(ii) max(g
c
i
) < 0. The instantaneous frequency of the end
of segment c
j
i
is higher than the instantenous frequency of
the start of the next segment c
j+1
i
. This means that segment
c
j
i
marks the end of the vocalization. This segment is not
modified. All the following segments c
l
k
(l ≥ j +1) of this
mode are switched to the next mode (k +1): m
l
k+1
= c
l
k
and
we replace the current segments with zeros z
l
k
.
This process is summarized in Ta bl e 1 .
This process of combining is done from the first to the
last IMF. Because the number of modes and the number of
segments are finite, the process ends on its own.
The new obtained signal is 1-dimensional with T samples
and is given by
u
=
M
i=1
m
1
i
M
i=1
m
2
i
···
M
i=1
m
N
i
. (11)
The following step is optional. We use a weighted factor (λ
j
i
∈
R)oneachsegment,
u
=
M
i=1
λ
1
i
m
1
i
M
i=1
λ
2
i
m
2
i
···
M
i=1
λ
N
i
m
N
i
. (12)
We diminish the role of each segment by using low values
of the weighted factors; we can even delete certain segments
by using λ
j
i
= 0. Consequently, this step allows us to am-
plify or attenuate one or more segments of the combined
IMF. The value of these weighted coefficients must be
chosen based on the objective of the application. In many
cases, it could be appropriate to fix a value dependent on
the signal frequencies. In our application, we amplify the
highest frequencies and attenuate the lowest frequencies in
relation to the killer whale vocalizations and the ambient
noise, respectively—we use our process like a filter. In other
applications, the objective could be to use a criterion based
on the signal energy, for example, to reduce high-energy
segments and amplify low-energy segments.
Equation (12) demonstrates the possibility of using the
new IMF for the selection of certain parts of the original
signal.
Olivier Adam 5
Table 1: Combination of segments; case 1: max(g
c
i
) > 0; case 2: max(g
c
i
) < 0 (the dotted line is the separation of 2 successive segments).
Cases
1.
f
ci
c
j
i
c
j+1
i
g
ci
2.
f
ci
c
j
i
c
j+1
i
g
ci
Actions (k i, l j +1)
Segments m
j
k
z
j
i
m
j
i
c
j
i
m
j
i+1
c
j
i+1
m
j
i+2
c
j
i+2
m
j
i+3
.
.
.
Segments m
l
k
No change
Segments m
j
k
No change
Segments m
l
k
z
l
i
m
l
i
c
l
i
m
l
i+1
c
l
i+1
m
l
i+2
c
l
i+2
m
l
i+3
.
.
.
Remarks
segment c
j
i+1
could be the continuation
of segment c
j+1
i
(possible parts of
the same vocalization)
Segment c
j
i+1
is the last part of
the vocalization
All segments c
l
k
are switched to
the segments c
l
k+1
3. RESULTS
Our research team is involved in a scientific project based
on the detection and localization of marine mammals using
passive acoustics. We have already used the HHT for different
kinds of bioacoustic transient signals, particularly sperm
whale clicks [27]. Now, we are applying the method on har-
monic signals. In this section, we show the results obtained
on simulated chirps, then we illustrate its performance on
killer whale vocalizations.
3.1. Analysis of the simulated three chirps signal
To present our method in detail, we have generated a
simulated signal composed of the three chirps with varying
frequencies (linear, convex, or concave) (Figure 2(A)).
The normalized frequencies of the first chirp s
1
vary
from 0.062 to 0.022. s
2
is the second chirp having a concave
variation of the normalized frequency from 0.016 to 0.08.
s
3
is the third chirp containing the linear variation of the
normalized frequency from 0.008 to 0.012.
In this example, we use normalized frequency as it is
important to know the frequencies of the chirps rather than
the value of the sampling frequency.
The spectrogram is provided in Figure 2(B).
The first step of our approach involves performing the
EMD (Figure 2(C)). We note that the three first modes
present all the frequency variations of the three chirps.
Providing the time-frequency representation of all these
modes will reveal the frequencies of each chirp. With the
EMD, these frequencies are hierarchically allocated to each
mode, meaning that at each moment, the first mode has the
highest frequency and the last mode, the lowest frequency.
Figure 2(D) shows that the IMFs have frequencies orig-
inating from all three chirps. Therefore, IMF 1 successively
contains the frequencies from chirp s
3
, then from s
1
, then
from s
2
, and then from s
3
again. Similarly, IMF 2 is composed
of frequencies from s
3
, then s
2
,ands
3
again. Finally, IMF 3
contains only a short part of the frequency of s
3
.
Feature extraction from the time-frequency representa-
tion (Figure 2(B)) requires 2D algorithms, such as the edge
detection algorithm, for example. Our goal allows us to avoid
using these algorithms so common in image processing.
In our simulated signal analysis, the work results in
linking one complete chirp to one single IMF. The point of
using the new combined IMF is that the new IMF 1 receives
its frequency solely from chirp s
1
.NewIMF2andIMF3will,
respectively, receive frequencies solely from s
2
and s
3
(6).
To segment these IMFs, we monitor the variations of
the g
c
i
parameter (Figure 2(E)). In our example, the five
segments are obtained from this parameter (Figure 2(F)).
Note that to avoid the side effects resulting from the
segmentation process, we force the segments to start and end
at zero by applying the Tukey window [34].
Then, the IMFs are combined (see (6)andFigure 2(G)).
We provide the time-frequency representation. The Hilbert
transform is applied on these new combined IMFs. Thus,
the obtained figure confirms that the new IMFs have the
frequencies of the original chirps.
If one of these chirps is considered a source of noise, we
could discard this chirp by using the weighted coefficients
equal to zero. For example, we can delete m
3
by applying λ
j
3
=
0.
The advantage is that we can use a 1D algorithm to
extract the frequency from each new IMF (in our case, the
interpolation could be done by using a simple 1-order or
6 EURASIP Journal on Advances in Signal Processing
Time domain
Relative amplitude
Signal
(A)
Step 1:
EMD
Time-frequency domain
Normalized frequency
Hilbert
transform
(B)
of the
mode 1
of the
mode 2
of the
mode 3
Spectrogram
c
1
c
2
c
3
c
4
c
5
(C)
.
.
.
.
.
.
.
.
.
0.5
0.4
0.3
0.2
0.1
0
0.06
0.04
0.02
0
0.06
0.04
0.02
0
0.06
0.04
0.02
0
(D)
(a) Decomposition of the original simulated signal; (A) original signal with the three chirps, (B) spectrogram, (C) EMD
decomposition, (D) Hilbert transform of each IMF
Relative amplitude
Step 2 : segmentation
(F)
c
1
c
2
c
3
c
1
1
c
1
2
c
1
3
c
2
1
c
2
2
c
2
3
c
3
1
c
3
2
c
3
3
c
4
1
c
4
2
c
4
3
c
5
1
c
5
2
c
5
3
(D)
g
c
1
0
d
c
1
10%x
max (d
c
1
)
0
g
c
2
0
d
c
2
10%x
max (d
c
2
)
0
g
c
3
0
d
c
3
10x
max (d
c
3
)
0
0.06
0.04
0.02
0
0.06
0.04
0.02
0
0.06
0.04
0.02
0
(E)
(b) Segmentation of the IMFs; (D) Hilbert transform of each IMF, (E) computation of g
c
i
and d
c
i
, (F) segmentation of the IMFs
Olivier Adam 7
Time domain
Relative amplitude
Time-frequency domain
Normalized frequency
Hilbert
transform
(H)
of the new
mode 1
of the new
mode 2
of the new
mode 3
(F)
Step 3: combination
c
1
c
2
c
3
c
1
1
c
1
2
c
1
3
c
2
1
c
2
2
c
2
3
c
3
1
c
3
2
c
3
3
c
4
1
c
4
2
c
4
3
c
5
1
c
5
2
c
5
3
m
1
m
2
m
3
z
1
1
z
1
2
c
1
1
c
2
1
z
2
2
c
2
2
c
3
1
c
3
2
c
3
3
z
4
1
c
4
1
c
4
2
(G)
z
5
1
z
5
2
c
5
1
.
.
.
.
.
.
.
.
.
.
.
.
.
.
.
.
.
.
Time
0.06
0.04
0.02
0
0.06
0.04
0.02
0
0.06
0.04
0.02
0
Time
(c) Combination of the IMFs; (F) segmentation of the IMFs, (G) new combined IMFs, (H) Hilbert transform applied on these
new IMFs
Figure 2
Relative amplitude
Relative amplitude
Relative amplitude
Relative amplitude
Hilbert
transform
Hilbert
transform
(c)
EMD
EMD
Frequency (kHz)
Frequency (kHz)
(b)
Time (s)
Time (s)
Time (s)
Time (s)
Time (s)
Time (s)
00.5
00.5
00.5
00.5
00.5
00.5
(a)
5
4
3
2
1
0
5
4
3
2
1
0
c
1
c
2
c
3
c
4
c
5
.
.
.
.
.
.
.
.
.
c
1
c
2
c
3
c
4
c
5
.
.
.
.
.
.
.
.
.
.
.
.
.
.
.
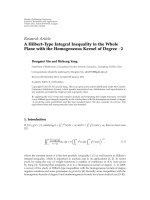
Figure 3: Decomposition of two harmonic killer whale vocalizations; (a) original signal, (b) EMD, (c) Hilbert transform of each new IMF.
2-order polynomial regression). We do not have to employ
2D algorithms.
In conclusion, we have linked one chirp to one single new
IMF. We have shown too that it is possible to filter the signal
through this method.
3.2. Analysis of killer whale vocalizations
Killer whales emit vocalizations with various time and fre-
quency characteristics (short, long, with or without harmon-
ics, etc.). Killer whales live and evolve in social groups, so it is
very rare to have recordings from only one individual, unless
we consider the animals in the aquarium. Therefore, in these
recordings, it is current to find more than one vocalization
at the same time. This complicates the detection of these
vocalizations. Another challenge is to find one complete
vocalization. At times, a single complete vocalization is
segmented into many components. This depends on the
method used to provide the time-frequency representation.
When the signal-to-noise ratio is weak, it is common that the
binarized spectrogram separately extracts different parts of
one single vocalization. To prevent this, other methods have
been proposed like the chirplet transform and the wavelet
transform [16, 21, 25].
In our dataset, the vocalizations have been recorded from
a group of killer whales in their natural environment. Vocal-
ization segmentation is commonly accomplished by apply-
ing the spectrogram. The analysis of this time-frequency
8 EURASIP Journal on Advances in Signal Processing
Table 2: Detection of vocalizations; % of detection of complete
vocalizations, % of detection of simultaneous vocalizations.
Detection of
vocalizations
Spectrogram Chirplet transform Combined IMFs
Complete
76.9 95 95
Simultaneous
78 31.7 92.7
representation is executed with the aid of a threshold to
binarize the spectrogram, or of an edge detector [4, 5].
The performance depends on (1) the signal-to-noise ratio
which is varying during all the recordings, and (2) the
simultaneous presence of more than one vocalization. Our
method was introduced as a solution to overcome these two
obstacles. First, the ambient noise has lower frequencies than
the vocalizations. So it is coded by the last IMFs. Second,
each vocalization is linked to a single combined IMF. This
facilitates feature extraction (duration of the vocalization,
start and end frequencies, and shape).
In our application, we do not take into account the
last IMFs. In our previous work [27], we defined a per-
formance/complexity criterion based on the contribution
of each mode for obtaining the complete original signal.
Applied on this dataset, this criterion shows that only the
firstfiveIMFsaresufficient for extracting killer whale
vocalizations. This low number of IMFs is coherent with the
results obtained by Wang et al. [25]. Considering only the
first five IMFs contributes to minimize the execution time of
this approach.
In the second step of the process, the modes are com-
bined following our algorithm to link one vocalization to one
mode.
We have compared the detection performance of the
three methods: the spectrogram, the chirplet transform, and
our approach based on the combined IMFs. Results appear in
Ta bl e 2. We consider our detection to be accurate when the
vocalization is determined in its full length. The segmented
vocalization is considered to be falsely detected.
When using the spectrogram, detection quality depends
mainly on the threshold value. In this application, we have
used a fixed threshold for the complete dataset in spite of
the presence of the varying ambient noise. The consequence
is that 25% of the vocalizations are segmented. Thus, the
spectrogram detector extracts many successive vocalizations
that are in fact all components of the same vocalization.
These results could be slightly improved by using an adaptive
threshold.
With the chirplet transform, the results decrease signifi-
cantly in the presence of simultaneous vocalizations. In these
cases, it seems that the algorithm extracts the vocalization
containing the greatest energy. Our method is more robust
because these different vocalizations are linked to different
combined modes. The detection process is done on each
mode.
Another advantage of our approach concerns vocaliza-
tions with harmonics. The presence of these harmonics
helps biologists characterize and classify sounds emitted by
animals. Our method equally enables linking one harmonic
Time (s)
Relative amplitude
0.6
0
−0.6
00.20.40.6
(a)
Time (s)
Normalized frequency
0.1
0.06
0
00.20.40.6
(b)
Time (s)
Normalized frequency
0.1
0.06
0
00.20.40.6
(c)
Figure 4: Extraction of the vocalization features; (a) original signal,
(b) Hilbert transform, (c) characterization of the vocalization.
to a single mode (as seen in Figure 3). Unlike in the previous
case, the vocalizations with harmonics are distinguishible
from simultanous vocalizations because all the harmonic
components have the same shape.
Another advantage of our method is that it allows us to
easily characterize each vocalization by applying the Hilbert
transform on each combined mode m
i
(duration, start and
end frequency, and shape). We employ a simple 1D function
to model the vocalizations. This is illustrated on a sample of
our dataset (Figure 4); we have extracted the start and the
end of the vocalization and the shape by applying a 3-order
polynomial regression.
Olivier Adam 9
4. CONCLUSION
After achieving promising results obtained on sperm whale
clicks (transient signals), our objective is to evaluate the
Hilbert-Huang transform on harmonic killer whale vocal-
izations. To this end, we propose a new method based on
an original combination of the intrinsic mode functions
obtained by the empirical mode decomposition. The advan-
tages of our method are (1) we filter the signal from the
new combined modes; (2) we link one vocalization (or one
harmonic) to one single mode; (3) we use a 1D algorithm to
characterize the vocalizations.
ACKNOWLEDGMENT
This work was supported by Association DIRAC (France).
REFERENCES
[1] J. Cirillo, S. Renner, and D. Todt, “Significance of context-
related changes in compositions and performances of group-
repertoires: evidence from the vocal accomplishments of
orcinus orca,” in Proceedings of the 20th Annual Conference
of the European Cetacean Society, pp. 70–71, Gdynia, Poland,
April 2006.
[2] A. Kumar, “Animal communication,” Current Science, vol. 85,
no. 10, pp. 1398–1400, 2003.
[3] W. A. Kuperman, G. L. D’Spain, and K. D. Heaney, “Long
range source localization from signal hydrophone spectro-
grams,” Journal of the Acoustical Society of America, vol. 109,
no. 5, pp. 1935–1943, 2001.
[4] D. Mellinger, “Automatic detection of regularly repeating
vocalizations,” Journal of the Acoustical Society of America, vol.
118, no. 3, p. 1940, 2005.
[5] D. Gillespie, “Detection and classification of right whale class
using an edge detector operating on smoothed spectrogram,”
Journal of the Canadian Acoustical Association, vol. 32, pp. 39–
47, 2004.
[6] R. A. Charif, D. W. Ponirakis, and T. P. Krein, “Raven Lite 1.0
User’s Guide,” Cornell Laboratory of Ornithology, Ithaca, NY,
USA, 2006.
[7] R. Specht, www.avisoft.de.
[8] H. Figueroa, “Acoustic tool development with XBAT,” in
Proceedings of the 2nd International Workshop on Detection and
Localization of Marine Mammals Using Passive Acoustics,p.53,
Monaco, France, November 2005.
[9] S. Jarvis, D. Moretti, R. Morrissey, and N. Dimarzio, “Passive
monitoring and localization of marine mammals in open
ocean environments using widely spaced bottom mounted
hydrophones,” Journal of the Acoustical Socie ty of America, vol.
114, no. 4, pp. 2405–2406, 2003.
[10] C. Hory, N. Martin, and A. Chehikian, “Spectrogram segmen-
tation by means of statistical features for non-stationary signal
interpretation,” IEEE Transactions on Signal Processing, vol. 50,
no. 12, pp. 2915–2925, 2002.
[11] C. Ioana and A. Quinquis, “On the use of time-frequency
warping operators for analysis of marine-mammal signals,”
in Proceedings of IEEE International Conference on Acoustics,
Speech and Signal Processing (ICASSP ’04), vol. 2, pp. 605–608,
Montreal, Canada, May 2004.
[12] N. E. Huang, Z. Shen, S. R. Long, et al., “The empirical
mode decomposition and the Hilbert transform spectrum for
nonlinear and non-stationary time series analysis,” Proceedings
of the Royal Society A, vol. 454, no. 1971, pp. 903–995, 1998.
[13] R. Tolimieri and M. An, Time-Frequency Representations,
Applied and Numerical Harmonic Analysis, Birkh
¨
auser,
Boston, Mass, USA, 1997.
[14] S H. Chang and F T. Wang, “Application of the robust
discrete wavelet transform to signal detection in underwater
sound,” International Journal of Electronics, vol. 90, no. 6, pp.
361–371, 2003.
[15] R. Huele and H. Udo de Haes, “Identification of individual
sperm whales by wavelet transform of the trailing edge of the
flukes,” Marine Mammal Science, vol. 14, no. 1, pp. 143–145,
1998.
[16] M. Lopatka, O. Adam, C. Laplanche, J. Zarzycki, and J
F. Motsch, “An attractive alternative for sperm whale click
detection using the wavelet transform in comparison to the
Fourier spectrogram,” Aquatic Mammals,vol.31,no.4,pp.
463–467, 2005.
[17] M. Lopatka, O. Adam, C. Laplanche, J. Zarzycki, and J
F. Mo ts ch , “ Effective analysis of non-stationary short-time
signals based on the adaptative schur filter,” Transactions on
Systems, Signals & Devices, vol. 1, no. 3, pp. 295–319, 2005.
[18] M. P. Fargues and R. Bennett, “Comparing wavelet transforms
and AR modelling as feature extraction tools for underwater
signal classification,” in Proceedings of the 29th Asilomar
Conference on Signals, Systems and Computers, vol. 2, pp. 915–
919, Pacific Grove, Calif, USA, October-November 1995.
[19] J. Ioup and G. Ioup, “Identifying individual sperm whales
acoustically using self-organizing maps,” JournaloftheAcous-
tical Soc iety of America, vol. 118, no. 3, p. 2001, 2005.
[20] M. van der Schaar, E. Delory, A. Catal
`
a, and M. Andr
´
e, “Neural
network-based sperm whale click classification,” Journal of the
Marine Biological Association of the UK,vol.87,no.1,pp.35–
38, 2007.
[21] S. Mann and S. Haykin, “The chirplet transform: physical
considerations,” IEEE Transactions on Signal Processing, vol.
43, no. 11, pp. 2745–2761, 1995.
[22] J. Cui, W. Wong, and S. Mann, “Time-frequency analysis of
visual evoked potentials using chirplet transform,” Electronics
Letters, vol. 41, no. 4, pp. 217–218, 2005.
[23] N. E. Huang, C. C. Chern, K. Huang, L. W. Salvino, S. R. Long,
and K. L. Fan, “A new spectral representation of earthquake
data: Hilbert spectral analysis of station TCU129, Chi-Chi,
Taiwan, 21 September 1999,” Bulletin of the Seismological
Society of America, vol. 91, no. 5, pp. 1310–1338, 2001.
[24] P. Hwang, J. Kaihatu, and D. Wang, “A comparison of the
energy flux computation of shoaling waves using Hilbert and
wavelet spectral analysis technique,” in Proceedings of the 7th
International Workshop on Wave Hindcasting and Forecasting,
Banff, Canada, October 2002.
[25] F T. Wang, S H. Chang, and J. C Y. Lee, “Signal detection in
underwater sound using the empirical mode decomposition,”
IEICE Transactions on Fundamentals of Electronics, Communi-
cations and Computer Sciences, vol. E89-A, no. 9, pp. 2415–
2421, 2006.
[26] A. D. Veltcheva and C. G. Soares, “Identification of the
components of wave spectra by the Hilbert-Huang transform
method,” Applied Ocean Research, vol. 26, no. 1-2, pp. 1–12,
2004.
[27] O. Adam, “The use of the Hilbert-Huang transform to analyze
transient signals emitted by sperm whales,” Applied Acoustics,
vol. 67, no. 11-12, pp. 1134–1143, 2006.
[28] O. Adam, “Advantages of the Hilbert-Huang transform for
marine mammals signals analysis,” Journal of the Acoustical
Society of America, vol. 120, no. 5, pp. 2965–2973, 2006.
10 EURASIP Journal on Advances in Signal Processing
[29] M. A. Chappell and S. J. Payne, “A method for the automated
detection of venous gas bubbles in humans using empirical
mode decomposition,” Annals of Biomedical Engineering, vol.
33, no. 10, pp. 1411–1421, 2005.
[30] P. J. Oonincx and J P. Hermand, “Empirical mode decompo-
sition of ocean acoustic data with constraint on the frequency
range,” in Proceedings of the 7th European Conference on
Underwater Acoustics, Delft, The Netherlands, July 2004.
[31] I. M. J
´
anosi and R. M
¨
uller, “Empirical mode decomposition
and correlation properties of long daily ozone records,”
Physical Review E, vol. 71, no. 5, Article ID 056126, 5 pages,
2005.
[32] P. Flandrin, G. Rilling, and P. Gonc¸alv
´
es, “Empirical mode
decomposition as a filter bank,” IEEE Signal Processing Letters,
vol. 11, no. 2, pp. 112–114, 2004.
[33] J. C. Cexus, A. O. Boudraa, L. Guillon, and A. Khenchaf,
“Sonar targets analysis by Huang Teager Transform (THT),”
Colloque Sea Tech Week, CMM 2006.
[34] R. B. Blackman and J. W. Tukey, The Measurement of Power
Spectra from the Point of View of Communication Engineering,
Dover, Mineola, NY, USA, 1958.