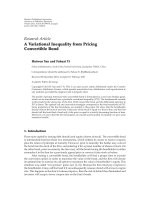
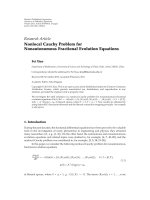
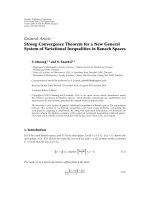
Báo cáo hóa học: " Research Article Distortion-Based Link Adaptation for Wireless Video Transmission" ppt
Bạn đang xem bản rút gọn của tài liệu. Xem và tải ngay bản đầy đủ của tài liệu tại đây (2.07 MB, 17 trang )
Hindawi Publishing Corporation
EURASIP Journal on Advances in Signal Processing
Volume 2008, Article ID 253706, 17 pages
doi:10.1155/2008/253706
Research Article
Distortion-Based Link Adaptation for Wireless
Video Transmission
Pierre Ferr
´
e,
1
James Chung-How,
2
David Bull,
1
and Andrew Nix
1
1
Centre for Communications Research, University of Bristol, Woodland Road, Bristol BS8 1UB, UK
2
ProVision Communication Technologies Limited, 3 Chapel Way, St. Anne’s, Bristol BS4 4EU, UK
Correspondence should be addressed to Pierre Ferr
´
e,
Received 15 October 2007; Accepted 10 March 2008
Recommended by F. Babich
Wireless local area networks (WLANs) such as IEEE 802.11a/g utilise numerous transmission modes, each providing different
throughputs and reliability levels. Most link adaptation algorithms proposed in the literature (i) maximise the error-free data
throughput, (ii) do not take into account the content of the data stream, and (iii) rely strongly on the use of ARQ. Low-latency
applications, such as real-time video transmission, do not permit large numbers of retransmission. In this paper, a novel link
adaptation scheme is presented that improves the quality of service (QoS) for video transmission. Rather than maximising the
error-free throughput, our scheme minimises the video distortion of the received sequence. With the use of simple and local rate
distortion measures and end-to-end distortion models at the video encoder, the proposed scheme estimates the received video
distortion at the current transmission rate, as well as on the adjacent lower and higher rates. This allows the system to select the
link-speed which offers the lowest distortion and to adapt to the channel conditions. Simulation results are presented using the
MPEG-4/AVC H.264 video compression standard over IEEE 802.11g. The results show that the proposed system closely follows
the optimum theoretic solution.
Copyright © 2008 Pierre Ferr
´
e et al. This is an open access article distributed under the Creative Commons Attribution License,
which permits unrestricted use, distribution, and reproduction in any medium, provided the original work is properly cited.
1. INTRODUCTION
Low-latency video transmission is highly demanding in
terms of the performance of all layers in the protocol
stack. Over the last decade, research has mainly focused
on enhancements to each individual layer without consid-
ering cross-layer interactions. Adapting the source coding
according to the channel and network conditions (and vice
versa)[1] via the cross-layer exchange of information has
only recently been investigated. In [2, 3], van der Schaar
et al. develop a cross-layer optimisation that combines
application layer forward error correction (FEC), adaptive
medium access control (MAC) retransmission and adaptive
packetisation for video transmission over an IEEE 802.11b
network. In [4], the authors discuss the challenges and prin-
ciples of cross-layer optimised multimedia transmission. The
choice of optimal modulation using Application/MAC/PHY
interactions for video over IEEE 802.11b [5] is discussed as
well as the choice of modulation scheme for optimal power
consumption. Moreover, the authors stress the fact that an
optimal solution for throughput may not be appropriate for
multimedia transmission. In [6], Setton et al. detail the basis
of a cross-layer framework where packet size is dynamically
adapted for a given link layer and channel condition. For
a given packet length, the proposed scheme optimises the
link layer parameters, such as the constellation and the
symbol rate, in order to optimise the throughput. In [7, 8],
the authors develop a hybrid link adaptation mechanism,
combining different link adaptation techniques and using
a cross-layering signalling system aimed at improving the
received video quality. In [9], a cross-layer architecture is
developed for MPEG-4/AVC H.264 [10] video over the
IEEE 802.11e [11] MAC layer by assigning priority values
to network abstraction layer (NAL) units that are then
converted into priority accesses, specific to the MAC layer.
However, with the exception of [3, 4, 7], adaptive link and
MAC layer techniques, involving coding rate and modulation
adaptation, are rarely considered in the design of cross-layer
systems.
This paper investigates a link adaptation mechanism
appropriate for the delivery of low-latency real-time video
without relying on retransmission. Distortion models are
2 EURASIP Journal on Advances in Signal Processing
10
−4
10
−3
10
−2
10
−1
10
0
PER
−5 0 5 101520253035 40
C/N (dB)
BPSK 1/2rate
BPSK 3/4rate
QPSK 1/2rate
QPSK 3/4rate
16QAM 1/2rate
16QAM 3/4rate
64QAM 3/4rate
Figure 1: IEEE 802.11a/g PER performance, ETSI, BRAN Channel
A[14], 825 byte packets.
developed and simulations are performed in order to
evaluate the proposed scheme. The algorithm presented uses
cross-layer exchange of information and is designed to opti-
mise perceptual video quality (by minimising the perceived
distortion) at the receiver. The paper is organised as follows.
Section 2 presents the principles of link adaptation in IEEE
802.11 WLANs and describes the existing algorithms. The
models used for the estimationof the distortion are described
and validated in Section 3. Section 4 details the proposed link
adaptation algorithms, and results are presented in Section 5.
Finally, Section 6 concludes the paper.
2. LINK ADAPTATION IN IEEE 802.11 WLANs
2.1. IEEE 802.11a/g PHY and MAC
The PHY layers of COFDM-based WLANs at 2.4 GHz and
5 GHz, such as IEEE 802.11g [12] and IEEE 802.11a [13],
respectively, offer numerous coding rates and modulation
schemes, each providing different throughputs and relia-
bility levels. Ta ble 1 summarises the different link-speeds
(commonly called operating modes) available for the IEEE
802.11a/g PHY layers. These range from BPSK 1/2 rate
(mode 1) which provides a nominal bit rate of 6 Mbps,
to 64QAM 3/4 rate (mode 7), with a nominal bit rate
of 54 Mbps. The BPSK 1/2 rate mode provides a more
reliable transmission link than the 64 QAM 3/4 rate mode
for a given received power level. Figure 1 shows the packet
error rate (PER) performance versus power level (carrier-
to-noise ratio (C/N)) for the 7 link-speeds available in IEEE
802.11a/g with a PHY packet length of 825 bytes (selected as a
compromise between PHY PER performance and MAC layer
throughput). Since the PER performance varies considerably
between modes, the choice of operating link-speed is crucial
to system performance. It should be noted that operating
modes and link-speeds are equivalent and, in the remainder
of this paper, both terms are used interchangeably.
Due to the range of operating modes available at the PHY
layer, the ability for a system to adapt to the fluctuations
of the environment (mobility, interference, and congestion)
is vital to optimise overall performance. This ability to
change link-speeds is used to control the reliability of the
system and provides the radio with the ability to switch to a
better configuration to improve the QoS of the transmission.
Many parameters can be varied at the MAC and PHY level;
examples include the maximum number of MAC level retries
(or automatic repeat requests (ARQ)), the packet size, the
operating mode (modulation, coding rate, link-speed), and
the type and number of antennas. Neither the IEEE 802.11
MAC [15] nor the IEEE 802.11a/g standards specifies an
algorithm for dynamic rate switching. The IEEE 802.11 MAC
only defines rules for the mode selection of the management
frames and declares dynamic rate selection for user data
beyond the scope of the specifications [8, 15, 16]. It is
therefore left to manufacturers to implement their own
switching algorithms and metrics, examples of these include
throughput, PER or delay.
2.2. Existing link adaptation algorithms
and related work
A simple link adaptation algorithm can be based on statistics
about the transmitted data. Such schemes are known as
Statistics-based automatic rate control algorithms [7, 8, 16].
These aim to provide the highest throughput [17, 18] since
the statistics are directly related to user-level throughput.
Other techniques use direct measurement of the link con-
ditions, based for example on power levels which are closely
related to the PER, and therefore to the throughput [7, 8].
2.2.1. Statistics-based control
(i) Throughput-based control: in these algorithms, a
constant (small) fraction of data (up to 10%) is sent
at two adjacent link-speeds (lower and higher than
the current rate). At the end of a decision window,
the transmitter computes the different throughputs
and a switch is made to the rate that provides the
highest throughput. In order to have meaningful
statistics, the decision window must be sufficiently
long (approximately one second [7, 8]).
(ii) PER-based control: in these algorithms, the PER of the
transmitted data is used to select the link-speed. The
PER can be determined by counting the ACKs of the
IEEE 802.11 MAC frame received at the transmitter
during a sliding decision window (a missing ACK
means that the corresponding packet has not been
received correctly). This approach was not designed
for video transmission, and optimises the PER to
achieve an improved throughput. It does not take
into account the nature of the content and its time-
bounded requirements.
(iii) Retry-based control: in these algorithms, the decision
metric used is the number of failed ARQs. If a
transmission is unsuccessful after a certain number of
Pierre Ferr
´
eetal. 3
Table 1: Mode-dependent parameters for IEEE 802.11a/g.
Operating mode Modulation Coding rate Link-Speed in Mbps Bit rate ratio with mode 1
1BPSK1/2 6 1
2 BPSK 3/4 9 3/2
3QPSK1/2 12 2
4QPSK3/4 18 3
516QAM1/2 24 4
616QAM3/4 36 6
764QAM3/4 54 9
retries, N
fail
, the link-speed is downscaled. Similarly,
upscaling would occur after a certain number of
successful contiguous transmissions, N
success
[19].
This method offers a very short response time to
channel changes. Upscaling can also be implemented
with a PER-based control scheme using a decision
window. This has been developed under the name
of AutoRate Fall Back (ARF) [20, 21] and has been
designed to optimise the application throughput
[19].
2.2.2. SNR-based control
In this method, the carrier-to-noise ratio (C/N), also known
as the signal-to-noise ratio (SNR), is used to determine the
transmission rate. The value of C/N is directly related to the
PER. The throughput at the PHY layer can be expressed as a
function of the PER and can be estimated as in [22–24]:
Throughput
= R × (1 − PER), (1)
where R is the operating link-speed (or nominal bit rate)
(see Ta bl e 1). Link adaptation based on SNR/throughput is
presented in Figure 2 foraMACpacketlengthof825bytes.
The crossing points of the curves define the switching
points (in terms of C/N) at which the system should up or
downscale. A simple SNR-based algorithm would employ a
look-up table (made available at the MAC) to obtain the
best throughput for a given C/N [25]. These tables could
theoretically be generated off-line for different packet lengths
for all modes, C/Ns and different channel conditions. It
should be noted that this assumes that ARQ is used for
retransmitting packets until the packet is received correctly,
or the maximum number of retries is reached (whichever
comes first). Data are therefore received error-free but delays
are incurred and the nature of the data is not taken into
account.
2.2.3. Other rate adaptation algorithms
Several rate adaptation algorithms have been presented
in the literature. A selection of these is presented here.
A good review of link adaptation design guidelines can
be found in [26], where the authors compare the merits
of the more common algorithms to derive a mechanism
overcoming their disadvantages. In [27], the authors develop
0
10
20
30
40
50
60
Throughput (Mbits/s)
−50 5 10152025303540
C/N (dB)
BPSK 1/2rate
BPSK 3/4rate
QPSK 1/2rate
QPSK 3/4rate
16QAM 1/2rate
16QAM 3/4rate
64QAM 3/4rate
Figure 2: Link adaptation based on throughput, IEEE 802.11a/g,
825 byte packets.
the minimum energy transmission strategy (MiSer)scheme,
which minimises the communication energy consumption
by combining the transport power control with the PHY
rate adaptation. In [28], the receiver-based autorate (R-
BAR) protocol is presented which optimises the application
throughput [19], where the choice of transmission rate is
made at the receiver based on its own stored statistics [21].
The information on the chosen rate is then transferred
back to the transmitter via the CTS frame of the hand-
shaking RTS/CTS. In [29, 30], the authors develop a hybrid
automatic rate controller, combining a throughput-based
rate controller with an SNR-based approach. By dynamically
adjusting RSSI-look up tables, the algorithm selects the most
appropriate rate. This scheme aims at improving throughput
as well as reducing delay and PER, but is also able to adjust
the transmitted video rate. A hardware solution is discussed
in [7], together with video results. In [31], the authors
derived an algorithm which allows differentiating packet loss
due to channel errors from packet collisions. Using the RTS
frame of IEEE 802.11 in an adaptive manner, the proposed
system is more likely to make the correct rate adaptation.
Variations of the above algorithms can be found in many
papers, among which [25, 32–35]arenotable.
4 EURASIP Journal on Advances in Signal Processing
Almost all the reported link adaptation algorithms
have been designed to provide throughput and/or PER
performance improvements [18] and/or to reduce the power
consumption. They do not take into account the nature of
the transmitted data or the low-delay requirements common
to real-time video applications. They strongly rely on the use
of retransmission and do not consider transmission delays.
Moreover, in the case of multimedia transmission, they also
do not optimise the perceived video quality [4].
2.3. Motivation
In our previous work [17, 36], we have shown that existing
algorithms are generally not suitable for low-latency video
applications as (i) they do not take into account the
nature of the transmitted data, and (ii) they are primarily
designed to provide the highest throughput without regard
for delay and retransmission. For video transmission where
a strong reliance on ARQ is not desirable, a completely
error-free communication is not essential when robust
video compression techniques are applied. For example, it
is possible to obtain an improved decoded video quality
using a higher link-speed but with some degree of error,
rather than an error-free video stream at a lower bit-
rate (using a lower link-speed). This is demonstrated in
Figure 3 for the foreman sequence (average peak-to-peak
signal-to-noise ratio (PSNR) over the whole sequence is
shown here) for the case with no ARQ. Each mode can
carry one video bit rate and, hence, higher modes support
better video quality if the PER is sufficiently low. The
overall quality of the received video sequence depends on
atradeoff between video bit-rate and error rate, as shown
in Figure 4.ForagivenC/Nof18dB,mode1provides
error-free transmission at low video bit rates (700 kbps
with a peak signal-to-noise ratio (PSNR) of 37.07 dB),
whereas mode 5 provides a transmission with a PER of
10
−2
with a higher video bit rate (4235 kbps). However,
Figure 4(b) shows better resolution and presents a better
PSNR (44.85 dB) than Figure 4(a) (37.07 dB). Impairments
due to errors are insignificant and can not be noticed
visually.
Whenever the MAC layer adapts its link-speed, the
application layer also adapts its encoding rate, based on the
following two assumptions:
(i) the ratios between the bit rates carried on each mode
follow the ratios of the link-speeds available at the
PHY layer for each mode, as shown in the last column
of Tab le 1.Inthisway,similarPHYresourcesareused
for each link-speed;
(ii) the maximum size of the video packet generated at
the encoder is not modified. A nonadaptive packet-
size assumption is the most realistic case for such a
system.
Therefore, if mode 1 is used to stream video at 500 kbps,
modes2,3,4,5,6,and7willcarryvideoencodedat
750, 1000, 1500, 2000, 3000, and 4500 kbps, respectively. As
the C/N increases, changing to higher link-speeds with a
15
20
25
30
35
40
45
50
Average PSNR (dB)
510152025303540455055
C/N (dB)
500 kbps with BPSK 1/2rate
750 kbps with BPSK 3/4rate
1000 kbps with QPSK 1/2rate
1500 kbps with QPSK 3/4rate
2000 kbps with 16QAM 1/2rate
3000 kbps with 16QAM 3/4rate
4500 kbps with 64QAM 3/4rate
Figure 3: Video quality-based algorithm, foreman, NAL unit max
size: 750 bytes.
higher bit rate provides a better PSNR. For example, the
best-video quality is obtained with QPSK 1/2 rate (mode
3) with 1000kbps at a C/N of 17 dB, with some degree of
error, whereas BPSK 1/2 rate with 500 kbps is error-free. A
natural and empirical switching point would therefore be
based on PSNR; effectively selecting the link-speed with the
highest PSNR at any time and for any C/N level. However,
in a realistic scenario, the decoder cannot derive PSNR
because it does not have access to the original video reference.
Moreover, PSNR performance depends on the content, the
video bit rate, the concealment algorithm, and the packet
length (amongst others).
A switching scheme using PER thresholds was presented
by the authors in [17]. Comparisons of this approach
with existing throughput-based solutions were made. The
principle is shown in Figure 5 where it can be seen that
switching occurs at lower PHY PERs for the video quality-
based algorithm. In [17], it was shown that parameters such
as packet size, video rate, and content had a strong influence
on the PER thresholds. A rigorous derivation of the PER
thresholds was therefore found difficult to establish, and a
practical design could not be proposed.
2.4. Proposed approach
Building on the preliminary work in [17], this paper
investigates a rigorous switching scheme based on the
received video distortion. The distortion measured here
is to the mean square error (MSE) between the received
and original pixels. This includes the encoding distortion
(due to the coding, transform, and motion compensation
operation of the encoder) as well as the end-to-end distortion
(due to error propagation and error concealment). The
Pierre Ferr
´
eetal. 5
(a) Mode 1, 700 kb, PER = 0, PSNR = 37.07 dB (b) Mode 5, 4235 kbps, PER = 0.04, PSNR = 44.85 dB
Figure 4: Foreman sequence, frame 30, C/N = 18 dB.
1
3
5
6
7
Mode
10
−6
10
−5
10
−4
10
−3
10
−2
10
−1
10
0
PER
Down-scaling
Up-scaling
(a) Video quality-based
1
3
5
6
7
Mode
10
−5
10
−4
10
−3
10
−2
10
−1
10
0
PER
Down-scaling
Up-scaling
(b) Throughput-based
Figure 5: Switching points comparison, foreman.
same assumptions remain, that is, the ratio between the
bit rates carried on each mode follows the ratio of the
link-speeds available at the PHY layer for each mode; and
the maximum size of the video packet generated at the
encoder is not modified. Rather than using PSNR as a
switching metric, the new scheme presented in this paper
uses an estimate of the video distortion. The decision to
switch from one link-speed to another is made upon the
distortion experienced on the current mode, as well as the
distortion on adjacent modes. For a given channel condition,
the mode offering the lowest distortion, that is, the best
video quality, is selected, as shown in Figure 6 (the average
distortion over the whole sequence is shown here). Clearly,
without a reference, the end-to-end distortions can not be
computed at the transmitter and need to be estimated.
A simple model to estimate the distortion at the current
mode and at the two adjacent has been developed and is
presented in the next section. The proposed approach oper-
ates on a group of pictures (GOP) basis, where distortions
are estimated and switching decisions are made for each
GOP.
3. VIDEO TRANSMISSION MODEL DESCRIPTION
To enable mode switching based on distortion we need
to estimate (i) the distortion of the received sequence
transmitted at the current rate, under the given channel
conditions, and (ii) the distortions of the received sequence
if transmitted at lower and higher rates, under their corre-
sponding channel conditions. To do so, we need to model (i)
the rate distortion curve of the sequence; and (ii) an end-
to-end distortion. The following discussion is based on the
H.264 standard [10] which is used throughout the paper.
3.1. Empirical rate distortion model
Several accurate RD models have been presented in the
literature [37–39]. However, these require trial encodings
in order to determine sequence-dependent parameters (and
hence cannot be used for practical systems), or they are
aimed at advanced rate control operation [40]. In this
section, we develop a simple empirical model aimed at
deriving a local estimation of the rate distortion curve in
6 EURASIP Journal on Advances in Signal Processing
10
0
10
1
10
2
10
3
Average MSE
5 10152025303540455055
C/N (dB)
500 kbps with BPSK 1/2rate
750 kbps with BPSK 3/4rate
1000 kbps with QPSK 1/2rate
1500 kbps with QPSK 3/4rate
2000 kbps with 16QAM 1/2rate
3000 kbps with 16QAM 3/4rate
4500 kbps with 64QAM 3/4rate
Figure 6: Distortion-based link adaptation, foreman, NAL unit max
size: 750 bytes.
order to approximate the distortion at lower and higher rates,
without relying on multiple encodings, that is, when only
one point on the curve is known. The distortion used here is
the MSE between the reconstructed and original pixels and
is only due to the motion compensation, quantisation and
transform operations of the encoder.
We first assume that a GOP has been encoded at the
current rate. The actual average coding distortion of the
GOP is therefore available, and we estimate the distortion
due to coding for the sequence encoded at higher and lower
rates. As stated in [41], in H.264, an increase of 6 in the
quantisation parameter (QP) approximately halves the bit
rate (equivalent to a decrease of 1 in the log
2
bit rate). A
simple linear relationship between the QP and the log
2
of the
bit rate can be adopted. As stated in [42], the quantisation
design of H.264 allows a local and linear relationship between
PSNR and the step-size control parameter QP. This can be
expressed mathematically as
log
2
(R) = a × QP + b,
PSNR
= c × QP + d,
(2)
which can be rewritten as
PSNR
=
c
a
× log
2
(R)+
d −
bc
a
. (3)
This linear relationship between PSNR and the base-two
of the logarithm of the bit rate has been verified by plotting
the actual PSNR versus log
2
(R) for all GOPs in the table
(Figure 7(a))andcoastguard (Figure 7(b)) sequences. Similar
curves have been obtained with other sequences and we can
thus assume that the curves are locally linear, that is, three
adjacent points are aligned.
To fully derive the parameters of this linear model,
several parallel encodings would be needed, but this is not
practical. From the encoding of the current GOP, the current
PSNR
c
(derived from the averaged MSE), the current rate
R
c
and the current average QP
c
are known. Using the fact
that an increase of 6 in QP halves the bit rate, we derive
a
=−1/6. Moreover, empirical studies for CIF sequences (a
similar constant can be obtained for sequences with others
resolutions and formats) have shown that trial encodings
with a QP of 6 leads to an almost constant luminance
PSNR of 55.68 dB (
±0.3 dB) for akiyo, coastguard, table,
and foreman sequences. We can now calculate the four
parameters a, b, c, and d as
a
=−
1
6
,
b
= log
2
R
c
+
QP
c
6
,
c
=
PSNR
c
− 55.68
QP
c
− 6
,
d
=
55.68 × QP
c
− 6 × PSNR
c
QP
c
− 6
.
(4)
To validate this model, video sequences (akiyo, fore-
man, table, and coastguard) were encoded at the following
rates 500 kbps, 750 kbps, 1000 kbps, 1500 kbps, 2000 kbps,
3000 kbps, and 4500 kbps. Figure 8(a) shows the estimation
of PSNR for the GOP number 10 of the table sequences at
1000 and 2000 kbps (the GOP is encoded at 1500 kbps). It
can be seen that the model follows a similar trend to the
actual curve. However, because the reference point (QP
= 6,
PSNR
= 55.68 dB) may be distant from the current operating
point, a mismatch can appear. We have found empirically
that weighting the parameter c by a scalar dependent on the
average QP improves the accuracy of the model. Figure 8(b)
shows similar performance trends with the GOP number 15
of foreman encoded at 3000 kbps when used to estimate the
PSNR at 2000 and 4500 kbps. Figure 9 shows a comparison
between the actual and estimated MSE at the lower and
higher rates for all the GOPs of table encoded at 1500 kbps
and foreman encoded at 750 kbps. Tables 2 and 3 provide
the mean and standard deviation of the estimation error
calculated over the GOPs, between the actual MSE and the
estimated MSEs, for each encoding rate of foreman and table,
respectively. It can be seen that the mean error is smaller
with the model with linear weighting (and it is below 10%).
Similarly, the standard deviation of the error is smaller when
linear weighting is applied and kept in the range from 1% to
9%. The proposed model employing weighting factors thus
offers an acceptable local estimate of encoding distortions for
the sequence at lower and higher bit rates.
The procedure to derive the distortion of the current
GOP of a sequence as if it was encoded at the lower and
higher local (adjacent) rates is summarised as follows.
(i) Derive rate R
c
,averageQP
c
,averageMSE
c
and
PSNR
c
= 10 × log
10
(255 × 255/MSE
c
) from the
encoding of the current GOP.
(ii) Derive a, b, c, and d using (4).
Pierre Ferr
´
eetal. 7
32
34
36
38
40
42
44
46
48
50
PSNR
18.51919.52020.52121.522 22.5
log
2
(bit rate)
(a) Ta bl e
28
30
32
34
36
38
40
42
44
46
PSNR
18.51919.52020.52121.52222.5
log
2
(bit rate)
(b) Coastguard
Figure 7: PSNR versus log
2
(Bit rate) performance for 25 GOPs.
Table 2: Mean and standard deviation (calculated over the GOPs) of the estimation error (in percent) between the actual and the estimated
MSE, foreman.
Mean of the estimation error Standard deviation of the estimation error
(percentage of difference) (percentage of difference)
Current encoding rate Estimation rate Linear model Linear model with weighting Linear model Linear model with weighting
500 kbps 750 kbps 18.2555 7.8208 7.0821 8.1238
750 kbps
500 kbps 25.7355 7.4049 10.7892 6.0400
1000 kbps 16.2241 6.3052 6.2538 3.7887
1000 kbps
750 kbps 21.3207 7.1663 8.8395 4.5493
1500 kbps 22.3845 6.8882 5.2796 3.0656
1500 kbps
1000 kbps 31.8273 8.8351 8.2769 4.1898
2000 kbps 17.0562 5.6035 4.2309 2.5047
2000 kbps
1500 kbps 21.2502 6.4256 6.0921 2.9674
3000 kbps 21.6382 5.0351 3.5749 2.7910
3000 kbps
2000 kbps 26.2032 4.8640 5.1767 3.0556
4500 kbps 14.5347 4.3805 4.0193 3.8371
4500 kbps 3000 kbps 16.4630 4.0723 5.4758 3.2906
Table 3: Mean and standard deviation (calculated over the GOPs) of the estimation error (in percent) between the actual and the estimated
MSE, table.
Mean of the percentage of difference Standard deviation of the percentage of difference
Current encoding rate Estimation rate Linear model Linear model with weighting Linear model Linear model with weighting
500 kbps 750kbps 14.4219 12.3402 8.2494 9.0454
750 kbit/s
500 kbps 19.7089 9.4528 12.6270 5.8535
1000 kbps 11.4824 4.9793 4.9201 3.5082
1000 kbps
750 kbps 14.9569 4.1785 6.2735 2.7079
1500 kbps 14.4776 9.9738 6.5595 7.1777
1500 kbps
1000 kbps 20.4458 6.6005 10.0650 5.1867
2000 kbps 14.6201 5.4923 5.6605 3.3561
2000 kbps
1500 kbps 20.1543 6.7503 9.0542 4.4030
3000 kbps 23.3229 10.9368 9.5719 5.7515
3000 kbps
2000 kbps 36.8940 15.6379 19.3450 8.7635
4500 kbps 21.8986 14.6120 12.8395 5.0332
4500 kbps 3000 kbps 26.7938 13.5277 17.3489 4.9546
8 EURASIP Journal on Advances in Signal Processing
36
37
38
39
40
41
42
43
PSNR
19.82020.220.420.620.82121.2
log
2
(rate)
Original
Estimated with linear model
Estimated with linear model+weighting
(a) Ta b le encoded at 1500 kbps, GOP number = 10; estimation of the
points for encoding at 1000 kbps and 2000 kbps
41
42
43
44
45
46
47
48
PSNR
20.82121.221.421.621.82222.2
log
2
(rate)
Original
Estimated with linear model
Estimated with linear model+weighting
(b) Foreman encoded at 3000 kbps, GOP number = 15; estimation of the
points for encoding at 2000 kbps and 4500 kbps
Figure 8: Model for the estimation of adjacent encoding points.
0
10
20
30
Average MSE
per GOP
0 5 10 15 20 25
GOP number
Actual 1000kbps
Estimated 1000 kbps with linear model
Estimated 1000 kbps with linear model+weighting
0
5
10
Average MSE
per GOP
0 5 10 15 20 25
GOP number
Actual 2000kbps
Estimated 2000 kbps with linear model
Estimated 2000 kbps with linear model+weighting
(a) Tab l e encoded at 1500kbps: actual and estimated lower rates
(1000 kbps, top figure); and actual and estimated higher (2000 kbps,
bottom figure) rates
10
20
30
40
50
60
Average MSE
per GOP
0 5 10 15 20 25
GOP number
Actual 500kbps
Estimated 500 kbps with linear model
Estimated 500 kbps with linear model+weighting
0
5
10
15
20
25
Average MSE
per GOP
0 5 10 15 20 25
GOP number
Actual 1000kbps
Estimated 1000 kbps with linear model
Estimated 1000 kbps with linear model+weighting
(b) Foreman encoded at 750 kbps: actual and estimated lower
rates (500 kbps, top figure); and actual and estimated higher rates
(1000 kbps, bottom figure)
Figure 9: MSE comparison: actual MSE and estimated adjacent MSE.
(iii) Derive PSNR
l
and PSNR
h
video quality using (2)
with the corresponding lower and higher rates R
l
and
R
h
,respectively.
(iv) Compute MSE
l
and MSE
h
from PSNR
l
and PSNR
h
.
3.2. End-to-end and transmission distortion model
To estimate the distortion of the received video, we use the
end-to-end distortion model developed in [38, 43]. We limit
the study to only one reference frame; however the model
remains valid with a larger number of reference frames.
We consider the previous frame copy (PFC) concealment
algorithm at the decoder, in which missing pixels due to
packet loss during transmission are replaced by the colocated
pixels in the previous reconstructed frame. We assume that
the probability of a packet loss is p
c
on the current rate. The
current end-to-end distortion for pixel i of frame n,noted
Dist
e2e,c
(n, i)
accounts for (a) the error propagation from
Pierre Ferr
´
eetal. 9
frame n − 1toframen, D
EP
(n, i); and (b) the PFC error
concealment, D
EC
(n, i). We therefore have
Dist
e2e,c
(n, i) =
1 − p
c
×
D
EP
(n, i)+p
c
× D
EC
(n, i). (5)
Readers are referred to [38, 43]forfulldetailsonhow
D
EP
(n, i)andD
EC
(n, i) are derived. Assuming that a pixel i
of frame n has been predicted from pixel j in frame n
− 1,
Dist
e2e,c
(n, i)
can be expressed as
Dist
e2e,c
(n, i) = (1 − p
c
) × Dist
e2e,c
(n − 1, j)+p
c
×
RMSE
c
(n − 1, n, i)+Dist
e2e,c
(n − 1, i)
.
(6)
RMSE
c
(n − 1,n, i) is the MSE between reconstructed
frames n and n
− 1 at pixel location i at the current rate. If
the pixel i belongs to an intra block, there is no distortion
due to error propagation but only due to error concealment;
and
Dist
e2e,c
(n, i)
is rewritten as
Dist
e2e,c
(n, i) = p
c
×
RMSE
c
(n − 1, n, i)
+Dist
e2e,c
(n − 1, i)
.
(7)
In order to compute the end-to-end distortion of the
sequence transmitted at lower and higher adjacent rates,
Dist
e2e,l
(n, i)andDist
e2e,h
(n, i), respectively, with a packet
loss of p
l
and p
h
, respectively, we assume that the motion
estimation is similar at all the rates and the difference in
quality between the reconstructed sequences is only due to
quantisation. Therefore, if pixel i in frame n is predicted
from pixel j in frame n
− 1 at the current rate, it will also be
predicted from the same pixel j in frame n
− 1atlowerand
higher rates. The two distortions at lower and higher rates
can then be expressed as
Dist
e2e,l
(n, i) =
1 − p
l
×
Dist
e2e,l
(n − 1, j)+p
l
×
RMSE
l
(n − 1, n, i)+Dist
e2e,l
(n − 1, i)
,
Dist
e2e,h
(n, i) = (1 − p
h
) × Dist
e2e,h
(n − 1, j)+p
h
×
RMSE
h
(n − 1, n, i)+Dist
e2e,h
(n − 1, i)
.
(8)
Dist
e2e,l
and Dist
e2e,h
only differ from Dist
e2e,c
by the
packet loss and the impact of the concealment algorithm,
that is, by RMSE
l
(n − 1, n, i)andRMSE
h
(n − 1, n, i). If we
consider the lower rate, RMSE
l
(n − 1, n, i)isgivenby
RMSE
l
(n, n − 1, i)
=
i
rec,l
(n) − i
rec,l
(n − 1)
2
=
i
rec,l
(n) − i
rec,c
(n)+i
rec,c
(n) − i
rec,l
(n − 1)
+i
rec,c
(n − 1) − i
rec,c
(n − 1)
2
=
i
rec,c
(n) − i
rec,c
(n − 1)
+
i
rec,l
(n) − i
rec,c
(n)
−
i
rec,l
(n − 1) − i
rec,c
(n − 1)
2
,
(9)
where i
rec,c
(n)andi
rec,l
(n) are the reconstructed pixels at
location i from frame n at the current and lower rates,
respectively. If we assume that the quality difference between
the two rates is evenly spread along the frames of a GOP, the
differences i
rec,l
(n) − i
rec,c
(n)andi
rec,l
(n − 1) − i
rec,c
(n − 1) are
cancelled. Equation (9) can therefore be rewritten as
RMSE
l
(n, n − 1, i) =
i
rec,c
(n) − i
rec,c
(n − 1)
2
= RMSE
c
(n, n − 1, i)
= RMSE
h
(n, n − 1, i).
(10)
The error concealment produces a similar contribution
to the end-to-end distortion for the current, lower and
higher rates. The overall average distortions for each GOP,
including the encoding distortion due to quantisation as well
as the end-to-end distortion due to error propagation and
error concealment, for the lower, current and higher rates,
can thus be estimated by
Dist
l
= Dist
e2e,l
+MSE
l
,
Dist
c
= Dist
e2e,c
+MSE
c
,
Dist
h
= Dist
e2e,h
+MSE
h
.
(11)
The end-to-end distortion model has been fully validated
in [38, 43]. Figure 10 confirms this by plotting a comparison
between the estimated received distortions and the actual
transmissions. Figure 10(a) shows the actual received distor-
tion along the GOPs of coastguard encoded at 1500 kbps,
with PER of 1%, against the estimated received distortion
of coastguard when encoded at 1500kbps (current rate), as
well as with the estimated received distortion of the higher
rate when encoded at 1000 kbps (from the lower rate) and of
the lower rate when encoded at 2000 kbps (from the higher
rate). Similar performance is shown in Figure 10(b) for table
encoded at 3000 kbps with a PER of 0.1%. Figure 11 shows
the estimated distortions on the current, lower and higher
rates compared to the actually received distortions for a C/N
of 23 and 22 dB for coastguard with the current mode being
5 and 4, respectively. From these figures, it can be seen that
the local estimates from our proposed model closely follow
the actual received distortion. It should be noted here that
the derivation of more complex (and hence accurate) models
would effectively provide better performance. However, this
is not the primary aim of this paper, and we believe that the
proposed models are suitable for our needs.
4. PROPOSAL FOR IMPROVED VIDEO TRANSMISSION
4.1. Algorithm
The proposed link adaptation scheme assumes that the ratios
between the bit rates carried on each mode follow the
ratios of the link-speeds available at the PHY layer for each
mode. Moreover, it requires that the maximum size of the
video packet generated at the encoder is not modified, so
that a single PER versus C/N lookup table can be used,
assuming a single channel type. It is aimed at low-latency
video transmission, without reliance on ARQ. The proposed
10 EURASIP Journal on Advances in Signal Processing
10
20
30
40
50
60
70
80
MSE distortion
0 5 10 15 20 25
GOP number
Actual transmission
Estimated transmission (current rate)
Estimated transmission (from lower rate)
Estimated transmission (from higher rate)
Actual lower rate
Actual higher rate
(a) Coastguard encoded at 1500 kbps, PER =0.01
0
2
4
6
8
10
12
14
MSE distortion
0 5 10 15 20 25
GOP number
Actual transmission
Estimated transmission (current rate)
Estimated transmission (from lower rate)
Estimated transmission (from higher rate)
Actual lower rate
Actual higher rate
(b) Ta bl e encoded at 3000 kbps, PER = 0.001
Figure 10: Estimated received distortion along the GOPs with fixed PER.
0
20
40
60
80
100
120
140
160
180
200
MSE distortion
0 5 10 15 20 25
GOP number
Actual Tx at current rate (mode 5): 2000kbps
Actual Tx at lower rate (mode 4): 1500 kbps
Actual Tx at higher rate (mode 6): 3000 kbps
Estimated Tx at current rate (mode 5): 2000kbps
Estimated Tx at lower rate (mode 4): 1500 kbps
Estimated Tx at higher rate (mode 6): 3000 kbps
(a) Coastguard, current rate: 2000 kbps, C/N = 23dB
5
10
15
20
25
30
35
40
45
50
55
MSE distortion
0 5 10 15 20 25
GOP number
Actual Tx at current rate (mode 4): 1500kbs
Actual Tx at lower rate (mode 3): 1000 kbs
Actual Tx at higher rate (mode 5): 2000 kbs
Estimated Tx at current rate (mode 4): 1500kbs
Estimated Tx at lower rate (mode 3): 1000 kbs
Estimated Tx at higher rate (mode 5): 2000 kbs
(b) Coastguard, current rate: 1500 kbps, C/N = 22dB
Figure 11: Comparison estimated and actual distortion for different power levels.
algorithm allows dynamic mode switching at each GOP and
operates as follows.
(i) Encode the current GOP at the specified bit rate on
the specified link-speed.
(ii) Extract the average QP, average MSE, then the average
PSNR and average rate R for the GOP.
(iii) Extract the PER from lookup tables using the average
received signal strength information (RSSI).
(iv) Derive the estimated distortion at the current,
lower and higher modes MSE
c
,MSE
l
,andMSE
h
as
described in Section 3.1.
(v) Compare the distortions:
–ifMSE
c
< MSE
l
and MSE
c
< MSE
h
: the distortion
estimated on the current mode is the lowest; stay in
the current mode;
–ifMSE
l
< MSE
c
and MSE
l
< MSE
h
: the distortion
estimated on the lower mode is the lowest; switch to
the lower mode, at a lower rate;
–ifMSE
h
< MSE
c
and MSE
h
< MSE
l
: the distortion
estimated on the higher mode is the lowest; switch to
the higher mode, at a higher rate.
Pierre Ferr
´
eetal. 11
10
0
10
1
10
2
10
3
Average distortion
5 10152025303540455055
C/N (dB)
125 kbps BPSK 1/2rate
187.5kbpsBPSK3/4rate
250 kbps QPSK 1/2rate
375 kbps QPSK 3/4rate
500 kbps 16QAM 1/2rate
750 kbps 16QAM 3/4rate
1125 kbps 64QAM 3/4rate
Figure 12: Optimum distortion-based link adaptation, foreman,
GOP number 8, Set (a).
10
0
10
1
10
2
10
3
Average distortion
5 101520253035404550 55
C/N (dB)
250 kbps BPSK 1/2rate
375 kbps BPSK 3/4rate
500 kbps QPSK 1/2rate
750 kbps QPSK 3/4rate
1000 kbps 16QAM 1/2rate
1500 kbps 16QAM 3/4rate
2250 kbps 64QAM 3/4rate
Figure 13: Optimum distortion-based link adaptation, coastguard,
GOP number 21, Set (b).
(vi) Update the video bit rate at the application layer,
update the link-speed at the link layer.
(vii) Proceed to the next GOP and go back to (i).
4.2. Design and issues
This algorithm is fully compliant with the IEEE 802.11a/b
standard and could be implemented in a real system.
Moreover, it could coexist with existing algorithms aimed
10
0
10
1
10
2
10
3
Average distortion
5 101520253035404550 55
C/N (dB)
500 kbps BPSK 1/2rate
750 kbps BPSK 3/4rate
1000 kbps QPSK 1/2rate
1500 kbps QPSK 3/4rate
2000 kbps 16QAM 1/2rate
3000 kbps 16QAM 3/4rate
4500 kbps 64QAM 3/4rate
Figure 14: Optimum distortion-based link adaptation, table,GOP
number 21, Set (c).
at other types of data and could be simply triggered either
by a flag or by using access categories, similar to IEEE
802.11e [11] (e.g., packet classifiers are already used to
select QoS mechanisms and service flows). The distortion
estimation performed at the video encoder does not signif-
icantly increase the complexity since it only requires motion
compensation, using the already available motion vectors.
The change of video bit rate can be achieved either by
dynamically changing the target rate in the rate controller
(for real-time encoding), or by using a transcoder (for pre-
encoded sequences). Alternatively, a scalable encoder can be
employed, dynamically selecting the parts of the bitstream
to transmit in order to adjust the bit rate to the bandwidth
fluctuations resulting from changes in the link-speed.
The main design issue would be the communication
between the application and the link layer. Prior to estimat-
ing the distortions, the application layer requires knowledge
of the channel conditions from the link layer. Once the
switching decision is made, the application layer needs to
notify the link layer to update the link-speed accordingly.
This exchange of information may be done with a cross-layer
communication bus. It should be noted that the frequency
of the switching decision can be extended to several GOPs if
needed.
With this algorithm, the transmission mode and video
bit rate of the current GOP are determined using the channel
and video statistics of the previous GOP. A GOP size of
12 frames at 30 frames per second corresponds to a 400-
millisecond delay. Unless the sequence contains extremely
high motion, or scene changes, the motion activity and
the sequence content should not be affected by this delay.
Moreover, it is reasonable to assume that the overall channel
conditions are stable over 400 milliseconds. This value also
provides good reactivity to channel changes. However, the
12 EURASIP Journal on Advances in Signal Processing
1
3
5
7
Mode
0 5 10 15 20 25
GOP number
10
1
10
2
10
3
MSE
0 5 10 15 20 25
GOP number
(a) Initial mode = 1(BPSK1/2rate−125 kbps)
1
3
5
7
Mode
0 5 10 15 20 25
GOP number
10
1
10
2
10
3
MSE
0 5 10 15 20 25
GOP number
(b) Initial mode = 6(16QAM3/4rate−750 kbps)
Figure 15: Mode and estimated distortion for coastguard encodedwithC/N= 15 dB, Set (a).
1
3
5
7
Mode
0 5 10 15 20 25
GOP number
10
0
10
1
10
2
MSE
0 5 10 15 20 25
GOP number
(a) Initial mode = 1(BPSK1/2rate− 250 kbps)
1
3
5
7
Mode
0 5 10 15 20 25
GOP number
10
0
10
1
10
2
10
3
MSE
0 5 10 15 20 25
GOP number
(b) Initial mode = 7(64QAM3/4rate−2250 kbps)
Figure 16: Mode and estimated distortion for foreman encodedwithC/N= 20 dB, Set (b).
estimated distortions are statistical and might therefore differ
from the results of a single transmission.
5. RESULTS
5.1. Simulation conditions
A compliant 802.11a/g PHY-layer simulator developed at
University of Bristol, meeting the conformance requirements
specified in Annex A of [12, 13], has been used to recreate
accurate bit and packet error performance [22, 24]. The
simulator supports all the standardised operating modes and
variable PHY-layer packet lengths. Moreover, it implements
all the components of the PHY layer with all parameters
configured in alignment to the standard and is capable
of producing error performance at any C/N level. The
channel model conforms to the ETSI-BRAN channel A
specifications (non line-of-sight office environment), with
an rms delay spread of 50 nanoseconds. Using our simulator,
an accurate derivation of the PER performance curves and
lookup tables, for a PHY packet length of 825 bytes, were
produced (in order to fully analyse the proposed mechanism
without the influence of others schemes, algorithms which
optimally choose packet lengths were not considered, and
a simple packetisation with fixed packet length is used
in this paper). We assume that packet losses due to col-
lisions are negligible compared to losses due to channel
errors.
Four video sequences (akiyo, foreman, table,andcoast-
guard) at CIF resolution are encoded at 30 frames per second
(fps) with our modified version of the H.264 reference
software [44] (JM version 12.4). Three sets of video rates
were considered: (a) from 125 to 1125 kbps, (b) from 250
to 2250 kbps, and (c) from 500 to 4500 kbps. The results
presented here are however representative of lower (QCIF,
subQCIF) and higher (4 CIF, SD) resolutions as well as lower
and higher bit rates; and are used to illustrate the need
for cross-layer optimisation and demonstrate the benefits of
deploying the proposed system. The RTP format and a fixed
maximum NAL unit size of 750 bytes (the 75 remaining bytes
account for the RTP/UDP/IP/MAC headers) are chosen.
Generated slices are encapsulated into UDP/IP packets. A
GOP size of 12, FMO type 2 (dispersed) and one reference
frame were used. At the decoder, lost macroblocks (MBs) are
simply replaced by the collocated MBs in the previous frame
(PFC concealment).
Pierre Ferr
´
eetal. 13
1
3
5
7
Mode
0 5 10 15 20 25
GOP number
10
0
10
1
10
2
10
3
Distortion
0 5 10 15 20 25
GOP number
(a) Initial mode = 1(BPSK1/2rate− 500 kbps)
1
3
5
7
Mode
0 5 10 15 20 25
GOP number
10
0
10
1
10
2
10
3
Distortion
0 5 10 15 20 25
GOP number
(b) Initial mode = 7 (64 QAM 3/4 rate –4500 kbps)
Figure 17: Mode and estimated distortion for table encodedwithC/N= 21 dB, Set (c).
0
2
4
6
8
Mode
0 5 10 15 20 25 30 35 40
C/N (dB)
Optimal transmission modes
(a) Optimal transmission modes
0
2
4
6
8
Mode
0 5 10 15 20 25 30 35 40
C/N (dB)
Selected modes with the proposed algorithm
(b) Selected modes with the proposed algorithm
Figure 18: Mode selection comparison, table, GOP number 15,
initial mode
= 3, Set (a).
0
2
4
6
8
Mode
0 5 10 15 20 25 30 35 40
C/N (dB)
Optimal transmission modes
(a) Optimal transmission modes
0
2
4
6
8
Mode
0 5 10 15 20 25 30 35 40
C/N (dB)
Selected modes with the proposed algorithm
(b) Selected modes with the proposed algorithm
Figure 19: Mode selection comparison, foreman, GOP number 11,
initial mode
= 3, Set (b).
0
2
4
6
8
Mode
0 2 4 6 8 10121416182022242628303234363840
C/N (dB)
Optimal transmission modes
(a) Optimal transmission modes
0
2
4
6
8
Mode
0 2 4 6 8 10121416182022242628303234363840
C/N (dB)
Selected modes with the proposed algorithm
(b) Selected modes with the proposed algorithm
Figure 20: Mode selection comparison, akiyo, GOP number 9,
initial mode
= 6, Set (c).
5.2. Optimum link adaptation
The sequences were encoded at fixed rates, using the three
sets: Set (a) 125, 187.5, 250, 375, 500, 750, and 1125 kbps;
Set (b) 250, 375, 500, 750, 1000, 1500, and 2250 kbps; and
Set (c) 500, 750, 1000, 1500, 2000, 3000, and 4500 kbps (each
of these is transmitted on each of the IEEE 802.11 WLAN
modes) and transmitted off-line 50 times (for statistical
purposes) over the IEEE 802.11 PHY layer for a wide range
of fixed C/N power levels. For each sequence, for each GOP,
and for each C/N, the average received distortion (MSE) is
calculated and averaged over the 50 runs. This allows us to
generate distortion performance curves which will constitute
optimum link adaptation, where for each C/N the chosen
operating mode is the mode with the lowest distortion.
Figures 12, 13,and14 show samples of the optimum link
adaptation for GOP number 8 of foreman with Set (a), GOP
14 EURASIP Journal on Advances in Signal Processing
number 15 of coastguard with Set (b), and for GOP number
21 for table with Set (c), respectively.
By examining the PER curves in Figure 1,itcanbeseen
that mode 2 (BPSK 3/4 rate) has worse performance than
mode 3 (QPSK 1/2 rate), and that mode 4 (QPSK 3/4 rate)
has a similar performance to mode 5 (16 QAM 1/2 rate).
Moreover, both offer lower link-speeds (see Ta bl e 1). This
explains why, using Figure 2 characterising the throughput
under various conditions, modes 2 and 4 are never be used.
This is also confirmed when examining the optimum link
adaptation curves in Figures 12, 13,and14, where modes
2 and 4 are similarly never used. As a consequence, BPSK
3/4 rate and QPSK 3/4 rate are no longer considered in the
remainder of this paper.
5.3. Behaviour of the proposed system
The sequences from Section 5.2 have been encoded with
our encoder and the proposed cross-layer link adaptation
mechanism. This allows the encoder to have knowledge of
the C/N, which is in turn used to estimate the PER of
the current mode and also of the adjacent modes. GOP
distortion estimates were computed and the target bit rate
and operating mode are updated as detailed in Section 4.It
should be noted that, for a fixed C/N, the system behaviour
over early GOPs will depend on the initial target and
operating mode. This is illustrated in Figures 15, 16,and17.
Figure 15 compares the mode and distortion variations for
coastguard encoded with a C/N of 15 dB with two different
initial modes, with bit rates from Set (a). With mode 1 as
the initial mode, the system upscales rapidly because of the
favourable conditions, and then remains steady in mode 3.
Whereas starting from mode 6, the system faces poor channel
conditions, and needs to downscale to mode 5 and then to
mode 3, where it remains. Similar conclusions can be drawn
from Figure 16 with coastguard encoded with a C/N of 20 dB
with rates in Set (b) and from Figure 17 with table encoded
with a C/N of 21 dB with rates in Set (c). We also note that
the selected mode adapts to channel conditions, but also to
video content. For example, in Figure 17,forGOPnumber
3 to 11 (i.e., from frames 36 to 132) the camera zooms out
in the table sequence. This part of the sequence is therefore
less resilient to errors and the system automatically switches
from mode 5 to 3; the sequence remains steady after GOP 11,
where the system upscales to mode 5.
5.4. Comparison with optimal link adaptation
This section compares the optimum modes with the modes
selected by our algorithm, as well as the estimated and
received distortions with the optimum ones. Figures 18, 19,
and 20 compare the selected modes obtained for various
C/NlevelsforGOPnumber15oftable (Set a), GOP
number 11 of foreman (Set b), and GOP number 9 of
akiyo (Set c), respectively. It can be seen that the proposed
mechanism o
ffers very similar switching points compared
to the optimum case. Similar mode switching curves were
obtained with other GOP numbers at other C/N levels for
the three rate sets.
10
0
10
1
10
2
10
3
Distortion
5 101520253035404550 55
C/N (dB)
125 kbps with BPSK 1/2rate
250 kbps with QPSK 1/2rate
500 kbps with 16QAM 1/2rate
750 kbps with 16QAM 3/4rate
1125 kbps with 64QAM 3/4rate
Estimated
Received
Figure 21: Distortion comparison, foreman, GOP number 8, initial
mode
= 3, Set (a).
10
0
10
1
10
2
10
3
Distortion
5 10152025303540455055
C/N (dB)
125 kbps with BPSK 1/2rate
250 kbps with QPSK 1/2rate
500 kbps with 16QAM 1/2rate
750 kbps with 16QAM 3/4rate
1125 kbps with 64QAM 3/4rate
Estimated
Received
Figure 22: Distortion comparison, table, GOP number 15, initial
mode
= 3, Set (a).
The simulated curves were obtained by averaging over
50 runs for each video sequence encoded and for each C/N
level. Figures 21, 22, 23,and24 compare the optimum link
adaptation distortion curves, with the estimated distortion
from our system and with the simulated and received
distortions, for rates from Sets (a), (b), and (c). First, it can
be seen that the estimated and actual distortion levels are
very similar, confirming the validity of the proposed model.
Moreover, these curves smoothly follow the optimum case.
Then, for a given C/N power level, the proposed system
achieves the lowest video distortion, by adaptively choosing
Pierre Ferr
´
eetal. 15
10
0
10
1
10
2
10
3
Distortion
5 10152025303540455055
C/N (dB)
250 kbps with BPSK 1/2rate
500 kbps with QPSK 1/2rate
1000 kbps with 16QAM 1/2rate
1500 kbps with 16QAM 3/4rate
2250 kbps with 64QAM 3/4rate
Estimated
Received
Figure 23: Distortion comparison, coastguard, GOP number 15,
initial mode
= 3, Set (b).
10
0
10
1
10
2
10
3
Distortion
5 10152025303540455055
C/N (dB)
500 kbps with BPSK 1/2rate
1000 kbps with QPSK 1/2rate
2000 kbps with 16QAM 1/2rate
3000 kbps with 16QAM 3/4rate
4500 kbps with 64QAM 3/4rate
Estimated
Received
Figure 24: Distortion comparison, table, GOP number 21, initial
mode
= 3, Set (c).
for each GOP the operating mode which minimises the
overall distortion.
6. CONCLUSIONS
In this paper, we have presented a novel link adaptation
algorithm designed for low-latency video transmission over
IEEE 802.11a/g without strong reliance on ARQ. Existing
algorithms for link adaptation make extensive use of the
retransmission mechanism at the MAC layer in order to
improve the error-free data throughput without taking into
account the bounded delay requirements of real-time video
applications. Moreover, they do not incorporate the spe-
cific characteristics of video streams. Completely error-free
communication is not essential if robust video compression
techniques are used, and it is possible to obtain improved
decoded video quality with a stream at a higher bit rate,
using a higher link-speed, but with some degree of error
rather than an error-free video stream at lower rate, using
a lower link-speed. Based on these observations, a link
adaptation mechanism minimising the overall transmission
video distortion has been presented for low-latency video
transmission.
Models were used to estimate the local rate distortion
performance at the video encoder and to estimate the end-
to-end transmission distortion. These models were validated
and shown to provide a reasonably accurate estimate of the
video distortion. With the assumption that each operating
mode carries adifferent bit rate, the proposed link adaptation
uses the estimated overall distortion on the current operating
mode, as well as on the lower and higher adjacent modes.
For each GOP, the proposed algorithm effectively selects
the mode that provides the lowest distortion. A cross-
layer exchange of information is needed between the video
encoder (at the application) and the link adapter (at the MAC
layer).
The proposed system is extendable to other multirate
systems such as WiMax and 3GPP LTE, which also support
several link-speeds with different modulation and coding
rates, each with different reliability levels. Future work will
focus on the derivation of more sophisticated rate distortion
source models and will also compare the proposed algorithm
with known link adaptation techniques such as ARF, for a
given received signal level trace. Validations of our approach
will be performed using a real-time experimental platform.
ACKNOWLEDGMENTS
This work was partially funded by the UK TSB project
VISUALISE and also by the EU FP6 project ASTRALS.
REFERENCES
[1] B. Girod, M. Kalman, Y. J. Liang, and R. Zhang, “Advances in
channel-adaptive video streaming,” Wireless Communications
and Mobile Computing, vol. 2, no. 6, pp. 573–584, 2002.
[2] M. van der Schaar, S. Krishnamachari, S. Choi, and X. Xu,
“Adaptive cross-layer protection strategies for robust scalable
video transmission over 802.11 WLANs,” IEEE Journal on
Selected Areas in Communications, vol. 21, no. 10, pp. 1752–
1763, 2003.
[3] M. van der Schaar and D. S. Turaga, “Cross-layer packetiza-
tion and retransmission strategies for delay-sensitive wireless
multimedia transmission,” IEEE Transactions on Multimedia,
vol. 9, no. 1, pp. 185–197, 2007.
[4] M. van der Schaar and S. N. Shankar, “Cross-layer wireless
multimedia transmission: challenges, principles, and new
paradigms,” IEEE Wireless Communications,vol.12,no.4,pp.
50–58, 2005.
[5] “IEEE Standard 802.11b—part 11: wireless LAN medium
access control (MAC) and physical layer (PHY) specifications:
high-speed physical layer extension in the 2.4 GHz band,”
1999.
16 EURASIP Journal on Advances in Signal Processing
[6] E. Setton, T. Yoo, X. Zhu, A. Goldsmith, and B. Girod, “Cross-
layer design of ad hoc networks for real-time video streaming,”
IEEE Wireless Communications, vol. 12, no. 4, pp. 59–65, 2005.
[7] I. Haratcherev, J. Taal, K. Langendoen, R. Lagendijk, and
H. Sips, “Optimized video streaming over IEEE 802.11 by
cross layer signalling,” IEEE Communication Magazine, vol. 44,
no. 1, pp. 115–121, 2006.
[8] I. Haratcherev, K. Langendoen, R. Lagendijk, and H. Sips,
“SNR-based rate control in WaveLAN,” in Proceedings of the
10th Annual Conference of the Advanced School for Computing
and Imaging (ASCI ’04), Delft, The Netherlands, June 2004.
[9] A. Kosentini, M. Naimi, and A. Gu
´
eroui, “Towards improve-
ment of the H.264 video transmission over IEEE 802.11e
through cross-layer architecture,” IEEE Communication Mag-
azine, vol. 44, no. 1, pp. 107–144, 2006.
[10] Joint Video Team of ISO/IEC MPEG ITU-T VCEG, “ITU-
T H.264—series H: audiovisual and multimedia aystems—
advanced video coding for generic audio visual services”.
[11] “IEEE Standard 802.11e; draft supplement to part 11: wireless
medium access control (MAC) and physical layer (PHY)
specifications: medium access control (MAC) enhancements
for quality of services (QoS),” 2002.
[12] “IEEE Standard 802.11g—part 11: wireless LAN medium
access control (MAC) and physical layer (PHY) specifications:
further high-speed physical layer in the 2.4 GHz band,” d1.1
2001.
[13] “IEEE Standard 802.11g; part 11: wireless LAN medium access
control (MAC) and physical layer (PHY) specifications: high-
speed physical layer in the 5 GHz band,” d7.0, 1999.
[14] J. Medbo and P. Schramm, “3ERI085B—channel models for
HIPERLAN/2 in different indoor scenarios,” ETSI EP BRAN,
1998.
[15] “IEEE Std 802.11; part 11: wireless LAN medium access
control (MAC) and physical layer (PHY) specifications,” 1999.
[16] I. Haratcherev, K. Langendoen, R. Lagendijk, and H. Sips,
“D3.16: application directed automatic 802.11 rate control,”
Tech. Rep., GigaMobile Project, Technische Universiteit Delft,
Delft, The Netherlands, 2002.
[17] P. Ferr
´
e, A. Doufexi, J. Chung-How, A. Nix, and D. Bull,
“Video quality based link adaptation for low latency video
transmission over WLANs,” Journal of Zhejiang University:
Science A, vol. 7, no. 5, pp. 847–856, 2006.
[18] H. Zhu, M. Li, I. Chlantac, and B. Prabhakaran, “A survey
of quality of service in IEEE 802.11e networks,” IEEE Wireless
Communications, vol. 11, no. 4, pp. 6–14, 2004.
[19] M. Lacage, H. Manshaei, and T. Turletti, “IEEE 802.11 rate
adaptation: a practical approach,” Tech. Rep., INRIA, Sophia
Antipolis, France, 2004.
[20] A. van der Vegt, “Auto rate fall back algorithm for IEEE
802.11a standard,” Tech. Rep., HPC Group, Faculty of Physics
and Astronomy, University of Utrecht, Utrecht, The Nether-
lands, 2002.
[21] M. H. Manshaei, T. Turletti, and M. Krunz, “A media-
oriented transmission mode selection in 802.11 wireless
LANs,” in Proceedings of the IEEE Wireless Communications
and Networking Conference (WCNC ’04), vol. 2, pp. 1228–
1233, Atlanta, Ga, USA, March 2004.
[22] A. Doufexi, S. Armour, M. Butler, A. Nix, and D. Bull, “A
study of the performance of HIPERLAN/2 and IEEE 802.11a
physical layers,” in Proceedings of the 53rd Vehicular Technology
Conference (VTC ’01), vol. 1, pp. 668–672, Rhodes, Greece,
May 2001.
[23] Z. Lin, G. Malmgren, and J. Torsner, “System performance
analysis of link adaptation in HiperLAN type 2,” in Proceedings
of the 52nd Vehicular Technology Conference (VTC ’00), vol. 4,
pp. 1719–1725, Boston, Mass, USA, September 2000.
[24] A. Doufexi, S. Armour, M. Butler, et al., “A comparison of
the HIPERLAN/2 and IEEE 802.11a wireless LAN standards,”
IEEE Communications Magazine, vol. 40, no. 5, pp. 172–180,
2002.
[25] D. Qiao, S. Choi, and K. G. Shin, “Goodput analysis and
link adaptation for IEEE 802.11 a wireless LANs,” IEEE
Transactions on Mobile Computing, vol. 1, no. 4, pp. 278–292,
2002.
[26] S. H. Y. Wong, H. Yang, S. Lu, and V. Bharghavan, “Robust
rate adaptation for 802.11 wireless networks,” in Proceedings of
the 12th Annual International Conference on Mobile Computing
and Networking (MOBICOM ’06), vol. 2006, pp. 146–157, Los
Angeles, Calif, USA, September 2006.
[27] D. Qiao, S. Choi, A. Jain, and K. G. Shin, “MiSer: an optimal
low energy transmission strategy for IEEE 802.11a/h,” in
Proceedings of the 9th Annual International Conference on
Mobile Computing and Networking (MOBICOM ’03), pp. 161–
175, San Diego, Calif, USA, September 2003.
[28] G. Holland, N. Vaidya, and P. Bahl, “A rate-adaptive MAC
protocol for multi-hop wireless networks,” in Proceedings of
the 7th Annual International Conference on Mobile Computing
and Networking (MOBICOM ’01), pp. 236–251, Rome, Italy,
July 2001.
[29] I. Haratcherev, K. Langendoen, R. Lagendijk, and H. Sips,
“Hybrid rate control for IEEE 802.11,” in Proceedings of the 2nd
International Workshop on Mobility Management and Wireless
Access Protocols (MobiWac ’04), pp. 10–18, Philadelphia, Pa,
USA, October 2004.
[30] I. Haratcherev, J. Taal, K. Langendoen, R. Lagendijk, and
H. Sips, “Automatic IEEE 802.11 rate control for streaming
applications,” Wireless Communications and Mobile Comput-
ing, vol. 5, no. 4, pp. 421–437, 2005.
[31] J. Kim, S. Kim, S. Choi, and D. Qiao, “CARA: collision-aware
rate adaptation for IEEE 802.11 WLANs,” in Proceedings of the
25th IEEE International Conference on Computer Communica-
tions (INFOCOM ’06), pp. 1–11, Barcelona, Spain, April 2006.
[32] C. Hoffmann, H. Manshaei, and T. Turletti, “CLARA: closed-
loop adaptive rate allocation for IEEE 802.11 wireless LANs,”
in Proceedings of the International Conference on Wireless
Networks, Communications, and Mobile Computing (WIRE-
LESSCOM ’05), vol. 1, pp. 668–673, Maui, Hawaii, USA, June
2005.
[33] S. Ci and H. Sharif, “A variable data rate scheme to enhance
throughput performance of wireless LANs,” in Proceedings
of the 3rd International Symposium on Communication Sys-
tems, Networks and Digital Signal Processing (CSNDSP ’02),
Staffordshire, UK, July 2002.
[34] W. H. Yuen, H N. Lee, and T. D. Andersen, “A simple
and effective cross layer networking system for mobile ad-
hoc networks,” in Proceedings of the 13th IEEE International
Symposium on Personal, Indoor and Mobile Radio Communi-
cations (PIMRC ’02), vol. 4, pp. 1952–1956, Lisbon, Portugal,
September 2002.
[35] M. Lacage, M. H. Manshaei, and T. Turletti, “IEEE 802.11
rate adaptation: a practical approach,” in Proceedings of the 7th
Symposium on Modeling, Analysis and Simulation of Wireless
and Mobile Systems (MSWiM ’04), pp. 126–134, Venice, Italy,
October 2004.
[36] P. Ferr
´
e, A. Doufexi, J. Chung-How, A. Nix, and D. Bull,
“Link adaptation for video transmission over COFDM based
Pierre Ferr
´
eetal. 17
WLANs,” in Proceedings of the 10th IEEE Symposium on Com-
munications and Vehicular Technology (SCVT ’03), Eindhoven,
The Netherlands, November 2003.
[37] K. Stuhlm
¨
uller, N. Farber, M. Link, and B. Girod, “Analysis
of video transmission over lossy channels,” IEEE Journal on
Selected Areas in Communications, vol. 18, no. 6, pp. 1012–
1032, 2000.
[38] S. Rane and B. Girod, “Analysis of error-resilient video
transmission based on systematic source-channel coding,” in
Proceedings of the 23rd Picture Coding Symposium (PCS ’04),
pp. 453–458, San Francisco, Calif, USA, December 2004.
[39] S. Rane, P. Baccichet, and B. Girod, “Modeling and optimiza-
tion of a systematic lossy error protection system based on
H.264/AVC redundant slices,” in Proceedings of the 25th Picture
Coding Sy mposium (PCS ’06), vol. 2006, Beijing, China, April
2006.
[40] D K. Kwon, M Y. Shen, and C C. J. Kuo, “Rate control
for H.264 video with enhanced rate and distortion models,”
IEEE Transactions on Circuits and Systems for Video Technology,
vol. 17, no. 5, pp. 517–528, 2007.
[41] T. Wiegand, G. J. Sullivan, G. Bjontegaard, and A. Luthra,
“Overview of the H.264/AVC video coding standard,” IEEE
Transactions on Circuits and Systems for Video Technology,
vol. 13, no. 7, pp. 560–576, 2003.
[42] H. S. Malvar, A. Hallapuro, M. Karczewicz, and L. Kerofsky,
“Low-complexity transform and quantization in H.264/AVC,”
IEEE Transactions on Circuits and Systems for Video Technology,
vol. 13, no. 7, pp. 598–603, 2003.
[43] P. Ferr
´
e, D. Agrafiotis, and D. Bull, “Macroblock selection
algorithms for error resilient H.264 video wireless transmis-
sion using redundant slices,” in Visual Communications and
Image Processing, vol. 6822 of Proceedings of SPIE,SanJose,
Calif, USA, January 2008.
[44] K. Suhring, H.264/AVC Software Coordination, http://iphome
.hhi.de/suehring/tml/.