Báo cáo hóa học: " Current–Voltage Characteristics in Individual Polypyrrole Nanotube, Poly(3,4-ethylenedioxythiophene) Nanowire, Polyaniline Nanotube, and CdS Nanorope" ppt
Bạn đang xem bản rút gọn của tài liệu. Xem và tải ngay bản đầy đủ của tài liệu tại đây (999.71 KB, 7 trang )
NANO EXPRESS
Current–Voltage Characteristics in Individual Polypyrrole
Nanotube, Poly(3,4-ethylenedioxythiophene) Nanowire,
Polyaniline Nanotube, and CdS Nanorope
Zhi-Hua Yin Æ Yun-Ze Long Æ Chang-Zhi Gu Æ
Mei-Xiang Wan Æ Jean-Luc Duvail
Received: 16 September 2008 / Accepted: 29 October 2008 / Published online: 20 November 2008
Ó to the authors 2008
Abstract In this paper, we focus on current–voltage
(I–V) characteristics in several kinds of quasi-one-dimen-
sional (quasi-1D) nanofibers to investigate their electronic
transport properties covering a wide temperature range
from 300 down to 2 K. Since the complex structures
composed of ordered conductive regions in series with
disordered barriers in conducting polymer nanotubes/wires
and CdS nanowires, all measured nonlinear I–V charac-
teristics show temperature and field-dependent features and
are well fitted to the extended fluctuation-induced tunnel-
ing and thermal excitation model (Kaiser expression).
However, we find that there are surprisingly similar devi-
ations emerged between the I–V data and fitting curves
at the low bias voltages and low temperatures, which
can be possibly ascribed to the electron–electron interac-
tion in such quasi-1D systems with inhomogeneous
nanostructures.
Keywords Conducting polymers Á I–V characteristics Á
FIT model Á Nanowires/tubes
Introduction
Recently, low-dimensional materials especially nanowires
and nanotubes have attracted considerable attention in view
of their novel features and electronic device applications in
future [1–3]. The unusual electronic transport properties in
conducting chemically doped polymers have been widely
investigated and reported owing to their unique structural
features, which are known to be very inhomogeneous;
namely, in some regions, the polymer chains are ordered,
and in other regions, the chains are disordered [4–6]. This
complex structure in disordered materials including doped
polymer and inorganic nanofibers is generally considered
as conduction regions or long conducting pathways sepa-
rated by small insulating barriers. Especially, as a key
indicator to electrical behavior, novel nonlinear current–
voltage (I–V) characteristics with temperature and field-
dependent features are observed in such quasi-one-dimen-
sional (quasi-1D) inhomogeneous structures [7–13]. In
particular, Kaiser et al. [11, 12] recently proposed a generic
expression (extended fluctuation-induced tunneling (FIT)
[13] and thermal excitation model) for the nonlinear I–V
characteristics based on numerical calculations for metallic
conduction interrupted by small barriers and showed that
the expression can give a very good description to the
temperature and field-dependent nonlinearities of I–V
curves in polyacetylene nanofibers, vanadium pentoxide
nanofibers, etc.
The electronic density of states (DOS) near the Fermi
energy E
F
is known as an important physical quantity for
understanding the electronic transport mechanism in
strongly localized systems [14] where the electron–electron
interaction (EEI) is first showed with created depletion in
DOS near E
F
by Pollak [15] and Srinivasan [16]. Efros and
Schklovskii [17, 18] called this depletion ‘‘Coulomb gap,’’
Z H. Yin Á Y Z. Long (&)
College of Physics Science, Qingdao University,
Qingdao 266071, China
e-mail:
C Z. Gu
Institute of Physics, Chinese Academy of Sciences,
Beijing 100190, China
M X. Wan
Institute of Chemistry, Chinese Academy of Sciences,
Beijing 100190, China
J L. Duvail
Institut des Mate
´
riaux Jean Rouxel, Universite
´
de Nantes,
CNRS, Nantes 44322, France
123
Nanoscale Res Lett (2009) 4:63–69
DOI 10.1007/s11671-008-9203-8
which can strongly affect the transport properties. Fur-
thermore, it is reported that the electron states in doped
nanofibers are more localized by disorder at low tempera-
ture [7]. However, most of conduction electrons are
considered as delocalized and free to move over a very
large distance compared to atomic dimension in FIT
regime [13], the EEI is not considered. Thus, if taking the
EEI into account, is Kaiser expression still generic for
nonlinear I–V characteristics of quasi-1D material? In this
paper, the I–V characteristics of a series of doped polymer
nanofibers and helically twisted CdS nanowire ropes are
measured by a standard two-probe method covering a wide
temperature range to investigate the transport behavior and
figure out this open question. We find all these I–V char-
acteristics show similar nonlinear features and are well
fitted to Kaiser expression. However, the surprisingly
similar deviations between the I–V data and fitting curves
emerge in low-field region at low temperatures, which have
not been reported and discussed before.
Experimental Details
8-Hydroxyquinoline-5-sulfonic acid doped polypyrrole
(PPY-HQSA) nanotubes and camphor-sulfonic acid doped
polyaniline (PANI-CSA) nanotubes were prepared by a
template-free self-assembly method [6]. The tubular
morphology of polypyrrole and polyaniline nanotubes was
confirmed by a transmission electron microscopic (TEM)
with outer diameters about 100–120 nm as shown in
Figs. 1a and 4a, separately. Conducting poly(3, 4-ethyl-
enedioxythiophene) (PEDOT) nanowires with diameters
about 95 nm (as shown in Fig. 3a) were prepared by a
hard template method described in Refs. [19–21]. As
shown in Fig. 2a, helically twisted CdS nanowire ropes
composed of nanowires with diameters about 6–10 nm
were synthesized by aqueous chemical growth method
[22, 23].
The Pt microleads attached on isolated nanofibers were
fabricated by focused-ion beam deposition. The detailed
procedure can be found in previous publications [6, 21–24].
The I–V characteristics of individual polypyrrole nanotube,
helically twisted CdS nanowire rope, PEDOT nanowire
and polyaniline nanotube were measured by scanning the
voltage from -6 to 6 V with a step of 0.03 V using a
Physical Property Measurement System from Quantum
Design and a Keithley 6487 picoammeter/voltage source
over a wide temperature range from 300 to 2 K. Here, it is
noted that since the low-temperature resistance of the
measured polypyrrole tube and CdS nanorope is very large,
and thus, the corresponding current is very small (* pA),
their I–V curves are only measured above 15 and 60 K,
separately.
Kaiser Expression
Since the complex structure of disordered materials gen-
erally considered as conduction regions or long conducting
pathways separated by small insulating barriers, the FIT
conduction mechanism, proposed by Sheng [13], charac-
terizes electrons transfer across the insulating barriers,
which can be directly influenced by the voltage fluctuations
in the conducting pathways. The mean current density
through a barrier when a field E
a
is applied across it is
evaluated as
jðE
a
Þ¼
Z
1
À1
dE
T
jðE
a
þ E
T
ÞPðE
T
Þð1Þ
where P(E
T
) is the probability that the fluctuation field
across the junction has the value E
T
(which may be in
either direction). The tunnelling current j(E) for a total field
E
b
= (E
a
? E
T
) in the barrier is denoted as
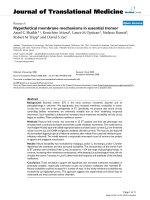
0123456
0
20
40
60
80
100
(a)
(b)
15K
20K
30K
40K
50K
60K
80K
100K
130K
160K
200K
250K
300K
Current (nA)
Voltage (V)
15K
300K
Fig. 1 a Typical TEM image of polypyrrole nanotubes and b the
corresponding I–V characteristics with fitting curves to Eq. 3
measured from 300 down to 15 K
64 Nanoscale Res Lett (2009) 4:63–69
123
jðE
b
Þ¼
me
8p
2
"h
3
Z
1
À1
de Dðe; E
b
Þ Hðe; E
b
Þð2Þ
where m and e are the carrier mass and energy,
respectively. In terms of the structure features of quasi-
1D disordered materials and the FIT model [13], Kaiser
et al. [11, 12] proposed a generic expression, which can
give a good description to the changing shape of nonlinear
I–V characteristics in quasi-1D systems by performing
numerical calculations of the current fluctuation-assisted
tunnelling through conduction barriers and thermal
activation over the barriers:
G ¼
I
V
¼
G
0
expðV=V
0
Þ
1 þh ½exp(V=V
0
ÞÀ1
ð3Þ
where G
0
, h, and V
0
are parameters. G
0
is the temperature-
dependent low-field (V ? 0) conductance. The parameter
h = G
0
/G
h
(h \ 1) yields a decrease of G below the
exponential increase at higher voltages V (G
h
is the satu-
rated conductance at a high-field value). V
0
is a voltage
scale factor, which gives an exponential increase in
conductance as V increases depending strongly on the
barrier energy. More details can be found in Refs. [11, 12].
Comparison with Experiment
Kaiser et al. [11, 12] has shown that the above expression can
give a very good description to the observed nonlinearities in
polyacetylene nanofibres, carbon nanotube networks, vana-
dium pentoxide nanofibres, and granular Sr
2
FeMoO
6
. In the
present case, a series of I–V characteristics at different
temperatures with fitting curves to Kaiser generic expression
Eq. 3 are shown in Figs. 1(b), 2(b), 3(b), and 4(b). We note
that all these I–V characteristics are essentially symmetric
upon reversal of the voltage direction, so only positive
voltages are used to show the fits more clearly.
Figure 1b shows the typical nonlinear I–V characteris-
tics of single polypyrrole nanotube with diameter about
100 nm. With increasing temperature and voltage, the
nonlinearity decreases and the ohmic component become
dominant. The nonlinear I–V characteristics can be well
fitted to Eq. 3 and the fitting parameters at some selected
temperatures are shown in Table 1 In this case, the low-
field conductance G
0
increases substantially from 0.0071 to
52.932 nS as temperature increases from 15 to 250 K. The
parameter h increases from 0.0065 to 0.6805 with
increasing temperature corresponding to a decrease of G
below the exponential increase at higher voltages as shown
in Fig. 1b. The voltage scale factor V
0
also increase from
1.0685 V at T = 15 K to 6.9725 V at T = 250 K, indicat-
ing a lessening of nonlinearity in the I–V characteristics as
temperature increases. It is about 160 K where linear
component becomes dominant in this case.
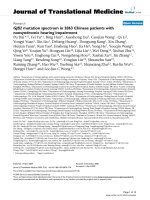
The similar highly nonlinear I–V characteristics of
CdS nanorope are shown in Fig. 2b. Although the non-
linearity decreases with increasing temperature, the plot
is still highly nonlinear even at T = 200 K. In this case,
the nonlinearities at higher temperatures indicate larger
barrier energies than that for the polypyrrole nanotube. It
can be seen from the fits in Fig. 2b that Kaiser expres-
sion can give a good account to the temperature and
field-dependent nonlinearities. The fitting parameters are
shown in Table 2 The low-field conductance G
0
shows
weaker increase with temperature than that for the
polypyrrole case. h has smaller values indicating a higher
exponential increase in G with increasing temperature
(h = 0.1052 at T = 200 K). The voltage scale parameter
V
0
also varies in a small range from 1.838 V at T =
60 K to 1.8558 at T = 200 K than that for the polypyr-
role tube, reflecting the smaller change in nonlinearities
of I–V characteristics.
As shown in Fig. 3b, the measured I–V characteristics of
single PEDOT nanowire from 80 down to 2 K show a
0123456
0
2
4
6
8
10
12
(b)
(a)
60K
70K
80K
100K
120K
150K
180K
200K
Current (nA)
Volta
g
e (V)
60K
200K
Fig. 2 a Typical TEM image of CdS nanowire ropes and b the
corresponding I–V characteristics with fitting curves to Eq. 3 from
200 down to 60 K
Nanoscale Res Lett (2009) 4:63–69 65
123
much more linearity compared with that of polypyrrole
nanotube in Fig. 1b and CdS nanorope in Fig. 2b. All these
data for PEDOT nanowire can be well fitted to Eq. 3 (as
shown in Fig. 3b) with fitting parameters given in Table 3
The low-field conductance G
0
shows higher values and
increases substantially as temperature T increases. Linear-
ity becomes dominant in I–V characteristics at a lower
temperature about 50–80 K reflecting smaller barrier
energy in the PEDOT nanowire. The more linear I–V
characteristics than the foregoing two cases yield larger
values in the fitting parameters h and smaller values in the
voltage scale parameter V
0
as shown in Table 3. In addi-
tion, as shown in Fig. 4b, the similar I–V characteristics are
also observed in single polyaniline nanotube with diameter
about 120 nm with fitting parameters given in Table 4.
Thus, based on our experimental results as shown from
Figs. 1, 2, 3, and 4, we conclude that the FIT model and
Kaiser expression can give a very good explanation to the
electronic transport properties and the nonlinear I–V char-
acteristics in quasi-1D materials in accordance with
previous reports [11, 12]. In FIT regime, most of delocal-
ized and free conduction electrons compared to atomic
dimension in disordered materials transfer across the
insulating gaps in the conducting pathways [13]. In terms
of Kaiser expression, considering the complex structures
composed of ordered metallic regions in series with dis-
ordered conduction barriers in such quasi-1D systems,
essentially, the nonlinear I–V behavior corresponds to
tunneling through barriers with thermal fluctuations con-
siderably smaller than the barrier height. As temperature
increase, the thermal energy becomes comparable to the
barrier height and linearity becomes dominant. Besides
temperature, the nonlinearity also shows field-dependent
feature. As the bias voltage increases, the difference in
Fermi levels between two sides of barriers is comparable to
the barrier energy, then the conductance will saturate at a
value G
h
and the I–V curves will become linear.
Further Discussion
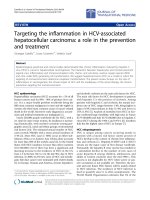
Here, we should note that the I–V characteristics, which are
linear–linear plotted in Figs. 1(b), 2(b), 3(b), and 4(b), as
0.0
0
1
2
3
4
5
6
(b)
(a)
2K
4K
6K
10K
15K
30K
50K
80K
Current (µA)
Volta
g
e (V)
2K
80K
1.0
0.80.6
0.4
0.2
Fig. 3 a Typical TEM image of single PEDOT nanowire and b the
corresponding I–V characteristics with fitting curves to Eq. 3 from 80
down to 2 K
012345678
0
20
40
60
80
100
120
140
(b)
(a)
3K
12K
30K
60K
80K
160K
250K
Current (µA)
Volta
g
e (V)
3K
250K
Fig. 4 a Typical TEM image of polyaniline nanotubes and b the
corresponding I–V characteristics with fitting curves to Eq. 3 from
250 down to 3 K
66 Nanoscale Res Lett (2009) 4:63–69
123
well as in Refs. [11, 12], cannot show the low-field region
clearly, so log-linear plots are adopted instead of linear-
linear plots, which are shown in Fig. 5(a)–(d), separately.
The surprisingly similar deviations between the I–V data and
fitting curves emerge in low-field region at low tempera-
tures, which have not been reported and discussed.
According to the theory developed by Pollak, Efros, and
Schklovskii and coworkers [15–18], the strong EEI creates a
Coulomb gap in DOS near Fermi level in localized systems.
By now, there have been a lot of experimental evidences in
which hopping is indeed influenced by the presence of
Coulomb gap at sufficiently low temperatures [6, 24–30].
For instance, the EEI can result in a smooth crossover from
three-/two-dimensional Mott to Efros–Shklovskii variable-
range hopping conduction [6, 25–28] and Coulomb gap-like
structure in dI/dV curves [26–30]. In addition, our previous
studies on conducting polyaniline, polypyrrole, and PEDOT
nanotubes/wires have indicated that the quasi-1D nano-
structures are composed of crystalline regions and
amorphous regions [6, 31, 32], and the EEI may be enhanced
and dominate the low-temperature electronic transport
behavior [6, 24, 29]. Therefore, we suggest that the observed
small deviations in Fig. 5(a)–(d) could be possibly due to
the EEI, which has not been included in Kaiser expression or
FIT model and should be taken into account especially at
low temperatures in quasi-1D systems where electron states
are more localized due to confinement effect or disorder.
However, further theoretical and experimental investiga-
tions are needed to clarify this point.
Conclusions
In summary, the electronic transport properties in several
kinds of individual polymer nanofibers and CdS nanoropes
were measured and investigated covering a wide temper-
ature range. All these quasi-1D materials show similar
temperature and field-dependent I–V characteristics, which
are well fitted to the extended FIT and thermal activation
conduction model (Kaiser expression) consistent with the
complex structures composed of ordered metallic region in
series with disordered conduction barriers in such quasi-1D
Table 2 Fitting parameters to Eq. 3 for CdS nanorope from 200 down to 60 K
T (K) 60 K 70 K 80 K 100 K 120 K 150 K 180 K 200 K
G
0
(nS) 0.01507 0.02728 0.06069 0.03608 0.10716 0.16697 0.26377 0.31185
h 0.02014 0.0176 0.03523 0.02557 0.04793 0.07768 0.09541 0.10523
V
0
(V) 1.838 2.11338 1.97387 2.0581 2.08389 1.87583 1.84095 1.85584
Table 1 Fitting parameters to Eq. 3 for polypyrrole nanotube at different temperatures
T (K) 15 K 30 K 60 K 80 K 100 K 130 K 160 K 200 K 250 K
G
0
(nS) 0.0071 0.1125 1.5243 4.1920 8.2794 15.946 24.409 37.685 52.932
h 0.0065 0.0319 0.1379 0.2400 0.3437 0.4719 0.5753 0.6561 0.6805
V
0
(V) 1.0685 1.3740 1.9114 2.3964 2.8522 3.3231 3.4422 4.7180 6.9725
Table 4 Fitting parameters to Eq. 3 for polyaniline nanotube from 250 down to 3 K
T (K) 3 K 12 K 30 K 60 K 80 K 160 K 250 K
G
0
(lS) 6.0844 8.7419 11.802 15.062 16.898 23.146 25.736
h 0.3806 0.4755 0.6586 0.7638 0.7900 0.7962 0.6675
V
0
(V) 3.5155 6.135 6.1051 5.1442 5.4773 12.736 29.749
Table 3 Fitting parameters to Eq. 3 for PEDOT nanowire from 80 down to 2 K
T (K) 2 K 4 K 6 K 10 K 15 K 30 K 50 K 80 K
G
0
(lS) 0.3326 0.4488 0.4679 0.6709 0.9857 2.3406 4.5521 7.3941
h 0.1457 0.1754 0.1665 0.1964 0.2464 0.4330 0.6436 0.7953
V
0
(V) 0.2560 0.2531 0.2256 0.2343 0.2599 0.3713 0.6438 1.5196
Nanoscale Res Lett (2009) 4:63–69 67
123
systems. We conclude that Kaiser expression is a possible
way to explain the electrical behavior at relatively high
temperatures and propose that the deviations emerged in
low-field region at low temperatures are possibly due to the
enhanced EEI in quasi-1D nanofibers with nanoscale
inhomogeneous structures.
Acknowledgments This work was financially supported by the
National Natural Science Foundation of China (Grant No 10604038)
and the Program for New Century Excellent Talents in University of
China (Grant No NCET-07-0472).
References
1. A.G. MacDiarmid, Rev. Mod. Phys. 73, 701 (2001). doi:
10.1103/RevModPhys.73.701
2. A.N. Aleshin, Adv Mater, 18, 17. and references therein. (2006).
doi:10.1002/adma.200500928
3. X.B. Chen, S.S. Mao, Chem. Rev. 107, 2891 (2007). doi:
10.1021/cr0500535
4. J. Joo, S.M. Long, E.J. Oh, A.G. MacDiarmid, A.J. Epstein, Phys.
Rev. B 57, 9567 (1998). doi:10.1103/PhysRevB.57.9567
5. N.A. Zimbovskaya, A.T. Johnson, N.J. Pinto, Phys. Rev. B 72,
024213 (2005). doi:10.1103/PhysRevB.72.024213
6. Y.Z. Long, L.J. Zhang, Z.J. Chen, K. Huang, Y.S. Yang, H.M.
Xiao, M.X. Wan, A.Z. Jin, C.Z. Gu, Phys. Rev. B 71, 165412
(2005). doi:10.1103/PhysRevB.71.165412
7. A.N. Aleshin, H.J. Lee, S.H. Jhang, H.S. Kim, K. Akagi, Y.W.
Park, Phys. Rev. B 72, 153202 (2005). doi:10.1103/PhysRevB.
72.153202
8. S. Samitsu, T. Iida, M. Fujimori, S. Heike, T. Hashizume, T.
Shimomura, K. Ito, Synth. Met. 152, 497 (2005)
9. L. Gence, S. Faniel, C. Gustin, S. Melinte, V. Bayot, V. Callegari,
O. Reynes, S. Demoustier-Champagne, Phys. Rev. B 76, 115415
(2007)
10. A. Rahman, M.K. Sanyal, Phys. Rev. B 76, 045110 (2007)
11. A.B. Kaiser, S.A. Rogers, Y.W. Park, Mol. Cryst. Liq. Cryst. 415,
115 (2004)
12. A.B. Kaiser, Y.W. Park, Synth. Met. 152, 181 (2005)
13. P. Sheng, Phys. Rev. B 21, 2180 (1980)
14. B. Sandow, K. Gloos, R. Rentzsch, A.N. Ionov, W. Schirmacher,
Phys. Rev. Lett. 86, 1845 (2001)
15. M. Pollak, Discuss. Faraday Soc. 50, 13 (1970)
16. G. Srinivasan, Phys. Rev. B 4, 2581 (1971)
17. A.L. Efros, B.I. Shklovskii, J. Phys. C 8, L49 (1975)
18. B.I. Shklovskii, A.L. Efros, Electronic Properties of Doped
Semiconductors (Springer, Berlin, 1984); ed. by M. Pollak, B.I.
Shklovskii. Hopping Transport in Solids (North-Holland,
Amsterdam, 1990)
19. J.L. Duvail, Y.Z. Long, S. Cuenot, Z.J. Chen, C.Z. Gu, Appl.
Phys. Lett 90, 102114 (2007)
20. J.L. Duvail, S. Dubois, S. Demoustier-Champagne, Y. Long, L.
Piraux, Int. J. Nanotechnol. 5, 838 (2008)
21. Y.Z. Long, Z.J. Chen, J.Y. Shen, Z.M. Zhang, L.J. Zhang, K.
Huang, M.X. Wan, A.Z. Jin, C.Z. Gu, J.L. Duvail, Nanotech-
nology 17, 5903 (2006)
22. W.L. Wang, F.L. Bai, Appl. Phys. Lett. 87, 193109 (2005)
1E-4
1E-3
0.01
0.1
1
10
100
(a)
15K
20K
30K
40K
50K
60K
80K
100K
130K
160K
200K
250K
300K
Current (nA)
Voltage (V)
15K
300K
0.01
0.1
1
10
(b)
60K
70K
80K
100K
120K
150K
180K
200K
Current (nA)
Voltage (V)
60K
200K
0.0
1E-3
0.01
0.1
1
(c)
2K
4K
6K
10K
15K
30K
50K
80K
Current (µA)
Voltage (V)
2K
80K
1
10
100
(d)
3K
250K
3K
12K
30K
60K
80K
160K
250K
Current (µA)
Voltage (V)
6543210
6543210
1.0
0.8
0.6
0.4
0.2
87
6
5
4
3
21
0
Fig. 5 The corresponding log-linear plot of the I–V characteristics for a polypyrrole nanotube, b CdS nanorope, c PEDOT nanowire, and d
polyaniline nanotube
68 Nanoscale Res Lett (2009) 4:63–69
123
23. Y.Z. Long, W.L. Wang, F.L. Bai, Z.J. Chen, A.Z. Jin, C.Z. Gu,
Chin. Phys. B 17, 1389 (2008)
24. Y.Z. Long, Z.H. Yin, Z.J. Chen, A.Z. Jin, C.Z. Gu, H.T. Zhang,
X.H. Chen, Nanotechnology 19, 215708 (2008)
25. T. Skotheim, R. Elsenbaumer, J. Reynolds, Handbook of Con-
ducting Polymers (Marcel Dekker, New York, 1998), pp. 85–121
26. M. Ghosh, A. Barman, S.K. De, S. Chatterjee, J. Appl. Phys. 84,
806 (1998)
27. S. Maji, S. Mukhopadhyay, R. Gangopadhyay, A. De, Phys. Rev
B 75, 073202 (2007) and references therein
28. J.Y. Shen, Z.J. Chen, N.L. Wang, W.J. Li, L.J. Chen, Appl. Phys.
Lett. 89, 153132 (2006)
29. Y.Z. Long, J.L. Duvail, Z.J. Chen, A.Z. Jin, C.Z. Gu, Chin. Phys.
Lett. 25, 3474 (2008)
30. Y.J. Ma, Z. Zhang, F. Zhou, L. Lu, A.Z. Jin, C.Z. Gu, Nano-
technology 16, 746 (2005)
31. Y.Z. Long, J.L. Luo, J. Xu, Z.J. Chen, L.J. Zhang, J.C. Li, M.X.
Wan, J. Phys. Condens. Matter 16, 1123 (2004)
32. Y.Z. Long, Z.J. Chen, J.Y. Shen, Z.M. Zhang, L.J. Zhang, H.M.
Xiao, M.X. Wan, J.L. Duvail, J. Phys. Chem. B 110, 23228 (2006)
Nanoscale Res Lett (2009) 4:63–69 69
123