Báo cáo hóa học: " A Rapid Synthesis of Oriented Palladium Nanoparticles by UV Irradiation" ppt
Bạn đang xem bản rút gọn của tài liệu. Xem và tải ngay bản đầy đủ của tài liệu tại đây (381.61 KB, 6 trang )
NANO EXPRESS
A Rapid Synthesis of Oriented Palladium Nanoparticles
by UV Irradiation
S. Navaladian Æ B. Viswanathan Æ
T. K. Varadarajan Æ R. P. Viswanath
Received: 28 August 2008 / Accepted: 20 November 2008 / Published online: 4 December 2008
Ó to the authors 2008
Abstract Palladium nanoparticles of average size around
8 nm have been synthesized rapidly by UV irradiation of
mixture of palladium chloride and potassium oxalate solu-
tions. A rod-shaped palladium oxalate complex has been
observed as an intermediate. In the absence of potassium
oxalate, no Pd nanoparticles have been observed. The
synthesized Pd nanoparticles have been characterized by
powder X-ray diffraction (XRD), transmission electron
microscopy (TEM), selective area electron diffraction and
energy dispersive analysis by X-rays (EDAX) analyses.
XRD analysis indicates the preferential orientation of cat-
alytically active {111} planes in Pd nanoparticles. A
plausible mechanism has been proposed for the formation
of anisotropic Pd nanoparticles.
Keywords Pd nanoparticles Á UV irradiation Á
Potassium oxalate Á Preferential orientation Á
Texture coefficient
Introduction
Nanoparticles of noble metals are gaining importance
because of their applications in various fields as well as their
considerable stability. Palladium nanostructures have been
known as hydrogen sensors [1] and catalysts for the reactions
such as oxidation of hydrocarbon in automobiles (three-way
catalyst) [2], hydrogenation [3], Heck reaction [4], Suzuki
reaction [5], Stille coupling [6] and C–N coupling [7]. Also,
Pd nanoparticles with preferentially exposed {111} show
high catalytic activity for the hydrogenation of 1,3-butadi-
ene. Several synthetic methods have been reported regarding
the preparation of stable palladium nanoparticles. Some of
the methods are sonochemical [8], c-irradiation [9], UV
irradiation [10], microemulsion technique [11] and polyol
reduction [12]. However, the facile, cost-effective and large-
scale synthetic methods are still elusive. Herein, we report a
simple, rapid, surfactantless and room temperature synthesis
of Pd nanoparticles by UV irradiation of the mixture of PdCl
2
and K
2
C
2
O
4
solutions.
Experimental
In a typical synthesis, a mixture of 20 mL of 5 mM PdCl
2
(Sigma-Aldrich, 99.9% purity) solution and 20 mL of 25 mM
K
2
C
2
O
4
(Merck, 99% purity) solution were stirred for 5 min.
Formation of reddish yellow needles was observed. But, upon
further dilution, the needles disappeared. Nitrogen gas was
purged through reaction mixture for 5 min. Then, the mixture
in a quartz tube was irradiated using 450 W Hg lamp (Oriel
Corporation, USA) for 5 min in order to get the black pre-
cipitate. No cut-off filters have been used. Upon irradiation,
orange coloured solution turned to colourless and particles
formed settled down due to the self-assembly caused by
oxalate di anion. The black particles were washed with dis-
tilled water by centrifugation at 6000 rpm.
Characterization
The synthesized Pd nanoparticles were characterized by
powder X-ray diffraction (XRD), transmission electron
S. Navaladian Á B. Viswanathan Á T. K. Varadarajan Á
R. P. Viswanath (&)
Department of Chemistry, National Centre for Catalysis
Research, Indian Institute of Technology Madras,
Chennai 600 036, India
e-mail:
123
Nanoscale Res Lett (2009) 4:181–186
DOI 10.1007/s11671-008-9223-4
microscopy (TEM), selective area electron diffraction
(SAED) and energy dispersive analysis by X-rays (EDAX).
Powder XRD patterns of samples were recorded with a
SHIMADZU XD-D1 diffractometer using Ni-filtered CuK
a
radiation (k = 1.5406 A
˚
) with the scan rate of 0.1°/s. TEM
analysis was carried out using a Philips CM12 TEM
working at a 100 kV accelerating voltage. Samples for
TEM analysis were prepared by dispersing Pd nanoparti-
cles in ethanol followed by drop-casting on a copper grid
(400 mesh) coated with carbon film.
Results and Discussion
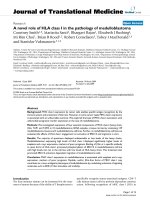
TEM images of black particles are shown in Fig. 1a and b.
Aggregates of irregular-shaped particles are observed and
the size of Pd particles varies from 8 to 25 nm. A nanorod
also is observed in TEM image as shown in Fig. 1a. The
aggregates of particles are formed due to the self-assem-
bling nature of oxalate di anion. This self-assembly of the
particles also confirms the capping ability of oxalate on Pd
surface. Hence, it was difficult to calculate the particle size
distribution from TEM images. SAED given in Fig. 1c
shows a ring pattern. Those rings are indexed to be
corresponding to (111), (200), (220), (311), (331) and (420)
of Pd metal with fcc structure (JCPDS file no. 87-0638).
Powder XRD pattern of Pd nanoparticles is shown in
Fig. 2.Thed-spacing corresponding to XRD lines are
2.236, 1.936, 1.369, 1.170 and 1.116 A
˚
. These d-spacing
values correspond to (111), (200), (220), (311) and (222)
planes with lattice constant, a = 3.871 A
˚
, matching with
that of JCPDS file 87-0638. This observation confirms the
presence of metallic Pd with fcc structure. XRD line cor-
responding to {111} plane is found to be unusually intense.
In order to understand the preferential orientation of crystal
planes, the average crystallite size of the Pd nanoparticles
has been calculated using Scherer equation, and texture
coefficient has been calculated [13] by Halls method from
the each line in XRD powder pattern of Pd nanoparticles.
The texture coefficient (C
hkl
) has been calculated using
Eq. 1 [14].
C
ðhklÞ
¼
I
ðhklÞi
I
oðhklÞi
0
1
n
X
n
I
ðhklÞn
I
oðhklÞn
; ð1Þ
where C
(hkl)
is the texture coefficient of the facet {hkl},
I
(hkl)
is the intensity of the (hkl) reflection of the sample
under analysis, I
o(hkl)
is the intensity of the (hkl) reflection
of a polycrystalline bulk sample and ‘n’ is the number of
Fig. 1 a, b TEM images of Pd
nanoparticles synthesized by
photochemical decomposition
method; c SAED pattern
recorded on aggregates of Pd
nanoparticles
182 Nanoscale Res Lett (2009) 4:181–186
123
reflections taken into account. By using this equation, the
preferential orientation of the facets can be understood.
C
(hkl)
is expected to be unity for the facet, which does not
have preferential orientation. If it is higher than unity, it is
a preferentially grown facet. C
(hkl)
values and average
crystallite sizes of different facets of the Pd nanoparticles
are shown in Fig. 3. For calculating texture coefficient,
JCPDS file 87-0639 of Pd has been used. Average crys-
tallite size corresponding to the various crystal planes of Pd
nanoparticles differs from 6.5 to 11.5 nm. It is clear from
the plot that the average crystallite sizes pertaining to (111)
and (222) reflections are higher than that of the other
planes. This indicates the preferential orientation of {111}
facet in Pd nanoparticles [15]. This reveals that particles
are anisotropic in shape (non-spherical). The average
crystallite size calculated from XRD pattern is less than
that of from TEM. This implies the polycrystalline nature
of the Pd nanoparticles. In general, for the spherical
particles, average crystallite size of crystal planes is
expected to decrease while moving from lower to higher
Bragg angle [16]. For the comparison, the average crys-
tallite size and texture coefficient calculated from the XRD
powder pattern of spherical Ag nanoparticles [17] of size
around 30 nm are given in Fig. 4. The expected trend is
observed in the average crystallite size for various crystal
planes in the case of Ag nanospheres.
In the plot of the texture coefficients, the similar devi-
ation among the texture coefficients of various facets is
observed for Pd nanoparticles. But in the case of texture
coefficient of Ag nanospheres given in Fig. 5, texture
coefficient of various crystal planes is found to increase
while moving from lower to higher Bragg angle. In the
case of (111), texture coefficient is found to be around 1.
But in the case of (222) plane, the texture coefficient is
around 1.4. Even though (111) and (222) are parallel
planes, there is a great deviation between their texture
coefficients. This implies that even though the morphology
is spherical, the texture coefficient varies between poly-
crystalline bulk sample and nanoparticles. In the case of
nanoparticles, the planes of higher Bragg angles show more
intensity than that of lower Bragg angles. This deviation is
expected mainly due to the effect of particle size in X-ray
scattering. The scattering of X-rays by nanoparticles and
polycrystalline bulk sample is different. Similar phenom-
enon is observed in another report where peak of (222) is
highly intense than that of (111) [18]. Due to the unusual
high intensity of higher angle peaks of (220), (331) and
(222) planes in the case of Pd nanoparticles, the intensity of
(111) planes is observed to be less. However, the deviation
in texture coefficient values in the case of Pd nanoparticles
reveals the anisotropic shape of Pd nanoparticles with
preferential orientation of {111} facet.
20 30 40 50 60 70 80 90
200
400
600
800
1000
(222)
(311)
(220)
(200)
(111)
2θ (degree)
Intensity (cps)
Fig. 2 XRD powder pattern of Pd nanoparticles
0.6
0.8
1.0
1.2
1.4
1.6
1.8
(111)
(200)
(311)
(222)
Crystal planes
Texture co-efficient (a.u.)
7
8
9
10
11
12
Average crystallite size (nm)
(220)
Fig. 3 Average crystallite size and texture coefficient of Pd nano-
particles calculated from XRD powder pattern
10
15
20
25
30
35
(222)
(311)
(220)
(200)
(111)
Crystal planes
Average crystallite size (nm)
0.8
1.0
1.2
1.4
1.6
1.8
Texture coefficient (a.u.)
Fig. 4 Average crystallite size and texture coefficient of spherical Ag
nanoparticles calculated from XRD powder pattern (reference JCPDS
file used for the calculation is 89-3722)
Nanoscale Res Lett (2009) 4:181–186 183
123
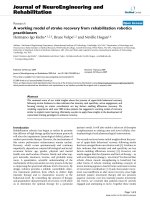
TEM images of the intermediate reddish yellow needles
formed before irradiation are given Fig. 5a and b. TEM
image (Fig. 5a) shows the wire-like morphology. Thick-
ness of the rods varies from 15 to 80 nm and the length is
more than 1 lm. Figure 5b shows the surface of a single
rod of thickness 125 nm. SAED pattern in Fig. 5b shows
the rings revealing the polycrystalline nature of the rod-
shaped intermediate complex. Since the needles are visible
to eyes, it is evident that a wide range of sizes of needles of
the intermediate complex is possible. The corresponding
EDAX spectrum is shown in Fig. 6. EDAX spectrum
shows the presence of K, Pd, Cu, C and O. Cu and C come
from a carbon-coated copper grid used for TEM analysis.
These observations indicate the formation of a water sol-
uble, K
2
[Pd(C
2
O4)
2
], complex. As per the literature, this
complex can be synthesized by the reaction of Pd(OH)
2
and oxalic acid [19]. In the case of Pt also, a similar kind of
oxalate complex with the wire morphology has been
observed [20]. In the absence of oxalate, irradiation of
PdCl
2
solution has not yielded any Pd nanoparticles even
after 30 min of UV irradiation.
In the case of UV irradiation method using PdCl
2
and
2-propanol (reducing agent), it needs around 24 h to form
Pd nanoparticles [10]. This is due to the poor reducing
ability of 2-propanol. In the case of Triton X-100 as
reducing agent, UV irradiation for 30 min is required for
the formation of Pd nanoparticles [21]. But, in the current
procedure, reduction of Pd by oxalate occurs so rapidly and
5 min of UV irradiation is sufficient for the complete
reduction of PdCl
2
(20 mL of 5 mM) to Pd nanoparticles.
High reducing ability and photosensitivity of oxalate di
anions are responsible for the rapid decomposition [22].
Since the standard reduction potentials of Pd (E
0
(Pd
2?
/
Pd) = 0.951 V) [23] and oxalate di anion (E
0
(2CO
2
/
C
2
O
4
2-
) =-0.49 V) [20] are favourable, decomposition
occurs rapidly under UV irradiation to yield metallic Pd as
shown in Eq. 2.
K
2
Pd C
2
O
4
ðÞ
2
ÂÃ
À!
hm
Pd þ2CO
2
þ K
2
C
2
O
4
ð2Þ
Also, mere refluxing of PdCl
2
and potassium oxalate
solution has not yielded any Pd nanoparticles even after
30 min. This observation reveals the importance of UV
light for this decomposition reaction to occur for yielding
metallic Pd. It is worthwhile to mention that more the
intensity of the lamp more will be the conversion. Hence, in
the current method, a high intensity lamp was utilized to
synthesize Pd nanoparticles rapidly. Mechanism of
decomposition of [Pd(C
2
O
4
)
2
]
2-
is similar to that of silver
oxalate (Ag
2
C
2
O
4
)[22]. It is because decomposition of
Ag
2
C
2
O
4
under UV light is also so rapid. Decomposition of
Ag
2
C
2
O
4
is well explored in the literature [22]. Hence,
mechanism of decomposition of [Pd(C
2
O
4
)
2
]
2-
can be
explained as follows. In this reaction, oxalate di anion in
the intermediate complex, [Pd(C
2
O4)
2
]
2-
, absorbs the light
in the UV region [24], get excited and decomposes to
CO
2
. During the decomposition, electrons are transferred
simultaneously to Pd
2?
. Thus, the reduction of Pd
2?
ions to
yield Pd metal occurs. In general, this phenomenon is
known as photo redox-decomposition [25]. Formation of
CO
2
has been confirmed by the formation of white
02468
200
400
600
800
Pd
Cu
K
Pd
Cu
O
C
Counts (cps)
Energy (keV)
Fig. 6 EDAX spectrum of intermediate complex, K
2
[Pd(C
2
O
4
)
2
]
Fig. 5 TEM image of
intermediate complex,
K
2
[Pd(C
2
O
4
)
2
]. Inset of (b)
shows the SAED pattern of the
nanorod
184 Nanoscale Res Lett (2009) 4:181–186
123
precipitate (BaCO
3
) observed when the outlet of the
reaction was dipped in Ba(OH)
2
(baryta) solution [26].
Even though powerful capping agents such as poly
(vinyl pyrrolidone) have not been employed in this method,
formation of Pd nanoparticles has been observed. This is
expected due to the fast nucleation and particle growth of
Pd. Pd atoms are generated during the photochemical
decomposition and nucleation starts immediately after
attaining certain concentration (saturation) of Pd atoms.
The nuclei further grow into the particle. In the current
synthesis, generation of Pd atoms is so rapid and therefore
the nucleation as well as particle growth is faster. Hence,
possibility for the homogenous nucleation is high. As a
result, number of nuclei formed is so high and hence,
particle size is small. Moreover, there is a chance for the
simultaneous agglomeration and the explosion of metal
nanoparticles into small clusters in the presence of UV
light [27–29]. Faceting of the crystals may occur due to the
selective adsorption of oxalate di anion on certain planes of
Pd nuclei. As a result, uncapped planes of the nuclei tend to
grow with higher rates and give rise to the formation of
anisotropic (non-spherical) nanoparticles of Pd [20]. In this
case, K
?
does not have any specific role in the resulting
morphology of metal nanoparticles, because K
?
does not
adsorb on metal nuclei to influence the morphology in the
synthesis of metal nanoparticles [30]. Synthesis of Pd
nanoparticles from PdCl
2
and potassium oxalate is sche-
matically explained in Fig. 7. The optimized geometry of
oxalate di anion is shown in the schematic mechanism [31].
Conclusions
Anisotropic palladium nanoparticles can be synthesized
rapidly by the UV irradiation of mixture of PdCl
2
and
potassium oxalate solutions without any surfactant or
polymer capping agents. The intermediate oxalatopalladi-
um(II) complex exhibits a rod-like morphology. The
formation of nanoparticles occurs rapidly at room tem-
perature, in the presence of UV light, due to the favourable
reducing ability of the oxalate. The resulting {111}-ori-
ented Pd anisotropic nanoparticles are expected to have
promising catalytic activity for various reactions. This
facile synthetic protocol can be exploited in the preparation
of supported Pd catalysts for various reactions.
Acknowledgement The authors wish to thank CSIR, New Delhi,
for the financial assistance.
References
1. M.Z. Atashbar, S. Singamaneni, Sens. Actuators. B Chem.
111–112, 13 (2005). doi:10.1016/j.snb.2005.07.034
2. Y. Nishihata, J. Mizuki, T. Akao, H. Tanaka, M. Uenishi, M.
Kimura, T. Okamoto, N. Hamadak, Nature 418, 164 (2002).
doi:10.1038/nature00893
3. J.S. Albero, G. Rupprechter, H.J. Freund, J. Catal. 235, 52 (2005)
4. C. Vincenzo, N. Angelo, M. Antonio, D. Antonia, I. Patrizia,
Organometallics 22, 4193 (2003). doi:10.1021/om034020w
5. Y. Li, E. Boone, M.A. El-Sayed (2002) Langmuir 18, 4921.
doi:10.1021/la011469q
6. J.C.G. Martinez, R. Lezutekong, R.M. Crooks, J. Am. Chem. Soc.
127, 5097 (2005). doi:10.1021/ja042479r
7. V. Kogan, Z. Aizenshtat, R. Popovitz-Biro, R. Neumann, Org.
Lett. 4, 3529 (2002). doi:10.1021/ol026689p
8. N.A. Dhas, A. Gedanken, J. Mater. Chem. 8, 445 (1998). doi:
10.1039/a706100e
9. A.A. Athawale, S.V. Bhagwat, P.P. Katre, A.J. Chandwadkar,
P. Karandikar, Mater. Lett. 57, 3889 (2003). doi:10.1016/S0167-
577X(03)00235-0
10. C.Y. Wang, Y. Zhou, Z.Y. Chen, Q.Y. Lu, X. Mo, J. Nanopart.
Res. 1, 479 (1999)
11. M. Iida, S. Ohkawa, H. Er, N. Asaoka, H. Yoshikawa, Chem.
Lett. 10, 1050 (2002). doi:10.1246/cl.2002.1050
12. Y. Xiong, J.M. McLellan, J. Chen, Y. Yin, Z.Y. Li, Y. Xia,
J. Am. Chem. Soc. 127, 17118 (2005). doi:10.1021/ja056498s
13. B. Cullity, Elements of X-ray Diffraction (Addison-Wesley,
Reading, MA, 1987)
14. S. Karim, M.E. Toimil-Molares, F. Maurer, M.W. Ensinger,
J. Liu, T.W. Cornelius, R. Neumann, Appl. Phys. A 84, 403
(2006). doi:10.1007/s00339-006-3645-6
15. M.K. Aminian, N. Taghavinia, A. Iraji-zad, S.M. Mahdavi,
M. Chavoshi, S. Ahmadian, Nanotechnology 17, 520 (2006).
doi:10.1088/0957-4484/17/2/030
16. A.R. West, Solid State Chemistry and Its Applications (Wiley,
New York, 1998)
17. S. Navaladian, Strategies for the synthesis of nanomaterials.
Ph.D. Thesis, Indian Institute of Technology Madras, 2008
18. H. Wang, D.O. Northwood, Res. Lett. Mater. Sci. 2008, 619032
(2008)
19. M.L. Blokhina, A.I. Blokhin, M.Ya. Nikulin, M.G. Derikova,
Powder Metal. Metab. Ceram. 35, 3 (1996)
20. S. Navaladian, C.M. Janet, B. Viswanathan, T.K. Varadarajan,
R.P. Viswanath, J. Phys. Chem. C 111, 14150 (2007). doi:
10.1021/jp0744782
21. S. Nath, S. Praharaj, S. Panigrahi, S. Basu, T. Pal, Curr. Sci. 786,
92 (2007)
22. V.V. Boldyrev, Thermol Chim. Acta. 388, 63 (2002)
23. G. Milazzo, S. Caroli, V.K. Sharma, Tables of Standard Elec-
trode Potentials
(Wiley, New York, 1978)
24. S. Dey, P. Banerjee, S. Gangopadhyay, P. Vojtısek, Transit Met.
Chem. 28, 765 (2003). doi:10.1023/A:1026073108597
Fig. 7 Schematic representation of the formation of Pd nanoparticles
by the photochemical decomposition method
Nanoscale Res Lett (2009) 4:181–186 185
123
25. W. Adamson, Pure Appl. Chem. 20, 25 (1969). doi:10.1351/
pac196920010025
26. S. Navaladian, B. Viswanathan, R.P. Viswanath, T.K. Varad-
arajan, Nanoscale Res. Lett. 2, 44 (2007). doi:10.1007/s11671-
006-9028-2
27. H. Fujiwara, S. Yanagida, P.V. Kamat, J. Phys. Chem. B 103,
2589 (1999). doi:10.1021/jp984429c
28. A. Takami, H. Kurita, S. Koda, J. Phys. Chem. B 103, 1226
(1999). doi:10.1021/jp983503o
29. S. Link, Z.L. Wang, M.A. El-Sayed, J. Phys. Chem. B 104, 7867
(2000). doi:10.1021/jp0011701
30. A. Filankembo, S. Giorgio, I. Lisiecki, M.P. Pileni, J. Phys.
Chem. B 107, 7492 (2003). doi:10.1021/jp022282q
31. F.A. Cotton, C.Y. Liu, C.A. Murillo, D. Villagran, X. Wang,
J. Am. Chem. Soc. 125, 13564 (2003). doi:10.1021/ja036884e
186 Nanoscale Res Lett (2009) 4:181–186
123