Research and Markets Project Management_1 doc
Bạn đang xem bản rút gọn của tài liệu. Xem và tải ngay bản đầy đủ của tài liệu tại đây (220.04 KB, 30 trang )
44 ROI METHODOLOGY BASICS
Collecting Data
Data collection is central to the ROI methodology. Both hard data (rep-
resenting output, quality, cost, and time) and soft data (including job
satisfaction and customer satisfaction) are collected. Data are collected
using a variety of methods, including
•
Surveys
•
Questionnaires
•
Tests
•
Observations
•
Interviews
•
Focus groups
•
Action plans
•
Performance contracts
•
Business performance monitoring
The important challenge in data collection is to select the method or
methods appropriate for the setting and the specific project, within the
time and budget constraints of the organization. Data collection methods
are covered in more detail in Chapters 5 through 7.
Isolating the Effects of the Project
An often overlooked issue in evaluations is the process of isolating the
effects of the project. In this step, s pecific strategies are explored that
determine the amount of output performance directly related to the
project. This step is essential because many factors will influence perfor-
mance data. The specific strategies of this step pinpoint the amount of
improvement directly related to the project, resulting in increased accu-
racy and credibility of ROI calculations. The following techniques have
been used by organizations to tackle this important issue:
•
Control groups
•
Trend line analysis
•
Forecasting models
•
Participant estimates
•
Managers’ estimates
•
Senior management estimates
•
Experts’ input
•
Customer input
The ROI Process Model 45
Collectively, these techniques provide a comprehensive set of tools to
handle the important and critical issue of isolating the effects of projects.
Chapter 8 is devoted to this important step in the ROI methodology.
Converting Data to Monetary Values
To calculate the return on investment, Level 4 impact data are converted
to monetary values and compared with project costs. This requires that
a value be placed on each unit of data connected with the project.
Many techniques are available to convert data to monetary values. The
specific technique selected depends on the type of data and the situation.
The techniques include
•
Output data
•
Cost of quality
•
Time savings converted to participants’ wage and employee benefits
•
Historical costs
•
Internal and external experts
•
External databases
•
Participant estimates
•
Manager estimates
•
Soft measures mathematically linked to other measures
This step in the ROI model is important and absolutely necessary in
determining the monetary benefits of a project. The process is challenging,
particularly with soft data, but can be methodically accomplished using
one or m ore of these strategies. Because of its importance, this step in the
ROI methodology is described in detail in Chapter 9.
Identifying Intangible Benefits
In addition to tangible, monetary benefits, intangible benefits—those not
converted to money—are identified for most projects. Intangible benefits
include items such as:
•
Increased employee engagement
•
Increased brand awareness
•
Improved networking
•
Improved customer service
46 ROI METHODOLOGY BASICS
•
Fewer complaints
•
Reduced conflict
During data analysis, every attempt is made to convert all data to
monetary values. All hard data—such as output, quality, and time—are
converted to monetary values. The conversion of soft data is attempted for
each data item. However, if the process used for conversion is too subjec-
tive or inaccurate, and the resulting values lose credibility in the process,
then the data are listed as an intangible benefit with the appropriate
explanation. For some projects, intangible, nonmonetary benefits are
extremely valuable, and often carry as much influence as the hard data
items. Chapter 10 is devoted to the nonmonetary, intangible benefits.
Tabulating Project Costs
An important part of the ROI equation is the calculation of project costs.
Tabulating the costs involves monitoring or developing all the related
costs of the project targeted for the ROI calculation. Among the cost
components to be included are
•
Initial analysis costs
•
Cost to design and develop the project
•
Cost of all project materials
•
Costs for the project team
•
Cost of the facilities for the project
•
Travel, lodging, and meal costs for the participants and team
members
•
Participants’ salaries (including employee benefits)
•
Administrative and overhead costs, allocated in some convenient
way
•
Evaluation costs
The conservative approach is to include all these costs so that the total
is fully loaded. Chapter 11 includes this step in the ROI methodology.
Calculating the Return on Investment
The return on investment is calculated using the program benefits and
costs. The benefits/costs ratio (BCR) is calculated as the project benefits
Operating Standards and Philosophy 47
divided by the project costs. In formula form,
BCR =
Project Benefits
Project Costs
The return on investment is based on the net benefits divided by project
costs. The net benefits are calculated as the project benefits minus the
project costs. In formula form, the ROI becomes
ROI (%) =
Net Project Benefits
Project Costs
× 100
This is the same basic formula used in evaluating other investments, in
which the ROI is traditionally reported as earnings divided by investment.
Chapter 11 provides more detail.
Reporting Results
The final step in the ROI process model is reporting, a critical step that
is often deficient in the degree of attention and planning required to
ensure its success. The reporting step involves developing appropriate
information in impact studies and other brief reports. At the heart of
this step are the different techniques used to communicate to a wide
variety of target audiences. In m ost ROI studies, several audiences are
interested in and need the information. Careful planning to match the
communication method with the audience is essential to ensure that the
message is understood and that appropriate actions follow. Chapter 13 is
devoted to this critical step in the ROI process.
OPERATING STANDARDS AND PHILOSOPHY
To ensure consistency and replication of impact studies, operating stan-
dards must be developed and applied as the process model is used to
develop ROI studies. The results of the study must stand alone and must
not vary with the individual who is conducting the study. The operating
standards detail how each step and issue of the process will be handled.
Table 3.1 shows the twelve guiding principles that form the basis for the
operating standards.
The guiding principles serve not only to consistently address each step,
but also to provide a much needed conservative approach to the analysis.
A conservative approach may lower the actual ROI calculation, but it will
also build credibility with the target audience.
48 ROI METHODOLOGY BASICS
Table 3.1 Twelve Guiding Principles of ROI
1. When conducting a higher-level evaluation, collect data at lower levels.
2. When planning a higher-level evaluation, the previous level of evaluation is
not required to be comprehensive.
3. When collecting and analyzing data, use only the most credible sources.
4. When analyzing data, select the most conservative alternative for calcula-
tions.
5. Use at least one method to isolate the effects of a project.
6. If no improvement data are available for a population or from a specific
source, assume that little or no improvement has occurred.
7. Adjust estimates of improvement for potential errors of estimation.
8. Avoid use of extreme data items and unsupported claims when calculating
ROI.
9. Use only the first year of annual benefits in ROI analysis of short-term
solutions.
10. Fully load all costs of a solution, project, or program when analyzing ROI.
11. Intangible measures are defined as measures that are purposely not converted
to monetary values.
12. Communicate the results of ROI methodology to all key stakeholders.
IMPLEMENTING AND SUSTAINING THE PROCESS
A variety of environmental issues and events will influence the successful
implementation of the ROI methodology. These issues must be addressed
early to ensure the success of the ROI process. Specific topics or actions
include
•
A policy statement concerning results-based projects
•
Procedures and guidelines for different elements and techniques of
the evaluation process
•
Formal meetings to develop staff skills with the ROI process
•
Strategies to improve management commitment to and support for
the ROI process
•
Mechanisms to provide technical support for questionnaire design,
data analysis, and evaluation strategy
•
Specific techniques to place more attention on results
The ROI process can fail or succeed based on these implementation
issues. Chapter 14 is devoted to this important topic.
Benefits of This Approach 49
In addition to implementing and sustaining ROI use, the process must
undergo periodic review. An annual review is recommended to determine
the extent to which the process is adding value.
BENEFITS OF THIS APPROACH
Now for the good news: The methodology presented in this book has been
used consistently and routinely by thousands of organizations in the past
decade. Much has been learned about the success of this methodology and
what it can bring to the organizations using it.
Aligning with Business
The ROI methodology ensures project alignment with the business,
enforced in three steps. First, even before the project is initiated, the
methodology ensures that alignment is achieved up front, at the time the
project is validated as the appropriate solution. Second, by requiring spe-
cific, clearly defined objectives at the impact level, the project focuses on
business impact over its course, in essence driving the business measure
by its design, delivery, and implementation. Third, in the follow-up data,
when the business measures may have changed or improved, a method is
used to isolate the effects of the project on that data, consequently prov-
ing the connection to that business measure, i.e., showing the amount
of improvement directly connected to the project and ensuring there is
business alignment.
Validating the Value Proposition
In reality, most projects are undertaken to deliver value. As described in
this chapter, the definition of value may on occasion be unclear, or may not
be what a project’s various sponsors, organizers, and stakeholders desire.
Consequently, there are often value shifts. Once the values are finally
determined, the value proposition is detailed. The ROI methodology will
forecast the value in advance, and if the value has been delivered, it
verifies the value proposition agreed to by the appropriate parties.
Improving Processes
This is a process improvement tool by design and by practice. It collects
data to evaluate how things are—or are not—working. When things
50 ROI METHODOLOGY BASICS
are not where they should be—as when projects are not proceeding as
effectively as expected—data are available to indicate what must be
changed to make the project more effective. When things are working
well, data are available to show what else could be done to make them
better. Thus, this is a process improvement system designed to provide
feedback to make changes. As a project is conducted, the results are
collected and feedback is provided to the various stakeholders for specific
actions for improvement. These changes drive the project to better results,
which are then measured while the process continues. This continuous
feedback cycle is critical to process improvement and is inherent in the
ROI methodology approach.
Enhancing the Image; Building Respect
Project managers are criticized for being unable to deliver what is
expected. For this, their image suffers. The ROI methodology is one
way to help build the respect a function or profession needs.
The ROI methodology can make a difference in any function where
projects are managed. This methodology shows a connection to the bottom
line and shows the value delivered to stakeholders. It removes issues
about value and a supposed lack of contribution to the organization.
Consequently, this methodology is an important part of the process of
changing the image of the function of the organization and building
needed respect.
Improving Support
Securing support for projects is critical, particularly at the middle man-
ager level. Many projects enjoy the support of the top-level managers who
allocated the resources to make the projects viable. Unfortunately, some
middle-level managers may not support certain projects because they
do not see the value the projects deliver in terms the managers appre-
ciate and understand. Having a methodology that shows how a project
is connected to the manager’s business goals and objectives can change
this support level. When middle managers understand that a project is
helping them meet specific performance indicators or departmental goals,
they will usually support the process, or will at least resist it less. In this
way, the ROI methodology may actually improve manager support.
Final Thoughts 51
Justifying or Enhancing Budgets
Some organizations have used the ROI methodology to support proposed
project budgets. Because the methodology shows the monetary value
expected or achieved with specific projects, the data can often be leveraged
into budget requests. When a particular function is budgeted, the amount
budgeted is often in direct proportion to the value that the function adds.
If little or no credible data support the contribution, the budgets are often
trimmed—or at least not enhanced.
Building a Partnership with Key Executives
Project managers partner with operating executives and key managers
in the organization. Unfortunately, some managers may not want to be
partners. They may not want to waste time and effort on a relationship
that does not help them succeed. They want to partner only with groups
and individuals who can add value and help them in meaningful ways.
Showing the projects’ results will enhance the likelihood of building these
partnerships, with the results providing the initial impetus for making
the partnerships work.
FINAL THOUGHTS
This chapter presents the overall approach to measuring ROI. It presents
the different elements and steps in the ROI methodology, the standards,
and the different concepts necessary to understand how ROI works, but
without a great deal of detail. This chapter brings the methodology into
focus. Before one can accept the approach, the steps and the detail have to
be shown. This detail will be presented in the rest of the book. Chapter 4
provides more detail on project alignment.
Chapter 4
Achieving Business Alignment
with the Project
Chapter 3 provided an overview o f the ROI methodology. This chapter
presents the first step of the process: defining the initial need and
corresponding objectives for a project. This step positions the project for
success by aligning its intended outcome with the needs of the business.
This business alignment is essential if the investment in a project is to
reap a return. The term business is used to reflect important outcome
measures, e.g. output, quality, cost, and time, that exist in any setting,
including governments, nonprofits, and nongovernmental organizations
(NGOs).
IMPORTANCE OF BUSINESS ALIGNMENT
Based on approximately 3,000 case studies, the number one cause of
project failure is lack of business alignment in the beginning. Projects
must begin with a clear focus on the desired outcome. The end must
be specified in terms of business needs and business measures so that
the outcome—the actual improvement in the measures—and the corre-
sponding ROI are clear. This establishes the expectations throughout the
analysis and project design, development, delivery, and implementation
stages.
Beginning with the end in mind requires pinning down all the details
to ensure that the project is properly planned and executed according to
schedule. But conducting this up-front analysis is not as simple as one
might think—it requires a disciplined approach.
53
Project Management ROI: A Step-by-Step Guide for Measuring the Impact and ROI for Projects
Jack J. Phillips, Wayne Brantley, and Patricia Pulliam Phillips
Copyright © 2012 John Wiley & Sons, Inc.
54 ACHIEVING BUSINESS ALIGNMENT WITH THE PROJECT
This standardized approach adds credibility and allows for consistent
application so that the analysis can be replicated. A disciplined approach
maintains process efficiency as various tools and templates are developed
and used. This initial phase of project development calls for focus and
thoroughness, with little allowance for major shortcuts.
Not every project should be subjected to the type of comprehensive
analysis described in this chapter. Some needs are obvious and require
little analysis other than that necessary to develop the project. Additional
analysis may be needed to confirm that the project answers the perceived
need and perhaps to fine-tune the project for future application. The
amount of analysis required often depends on the expected opportunity
to be gained if the project is appropriate or the negative consequences
anticipated if the project is inappropriate.
When analysis is proposed, individuals may react with concern or resis-
tance. Some are concerned about the potential for ‘‘paralysis by analysis,’’
where requests and directives lead only to additional analyses. These
reactions can pose a problem for an organization because analysis is
necessary to ensure that the project is appropriate. Unfortunately, anal-
ysis is often misunderstood—conjuring up images of complex problems,
confusing models, and a deluge of data along with complicated statistical
techniques to ensure that all bases are covered. In reality, analysis need
not be so complicated. Simple techniques can uncover the cause of a
problem or the need for a particular project.
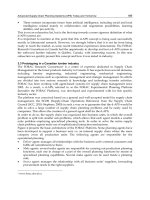
The remainder of the chapter delves into the components of analysis
that are necessary for a solid alignment between a project and the
business. First, however, reviewing the model introduced in Chapter 3
may be helpful. It is presented here as Figure 4.1.
DETERMINING THE POTENTIAL PAYOFF
The first step in up-front analysis is to determine the potential payoff
of solving a problem or seizing an opportunity. This step begins with
answers to a few crucial questions: Is this project worth doing? Is it
feasible? What is the likelihood of a positive ROI?
For projects addressing significant problems or opportunities with
high potential rewards, the answers are obvious. The questions may take
longer to answer for lower-profile projects or those for which the expected
payoff is less apparent. In any case, these are legitimate questions, and
the analysis can be as simple or as comprehensive as required.
Determining the Potential Payoff 55
The ROI Methodology
Start Here End Here
Payoff
needs
5 ROI objectives ROI
Business
needs
4 Impact objectives
Impact
Job performance
needs
3 Application objectives
Application
Initial
Analysis
Measurement
and
Evaluation
Learning
needs
2
1
Learning objectives
Learning
Preference
needs
1
Reaction objectives
Reaction
Business Alignment
and Forecasting
The ROI Process Model
PROJECT
5
4
3
2
1
Figure 4.1 Business Alignment model.
Essentially, a project will pay off in profit increases or in cost savings.
Profit increases are generated by projects that drive revenue, e.g., that
improve sales, drive market share, introduce new products, open new
markets, enhance customer service, or increase customer loyalty. Other
revenue-generating measures include increasing membership, increasing
donations, obtaining grants, and generating tuition from new and return-
ing students—all of which, after subtracting the cost of doing business,
should leave a significant profit.
However, most projects drive cost savings. Cost savings can come
through cost reduction or cost avoidance. Improved quality, reduced cycle
time, lowered downtime, reduced complaints, limited employee turnover,
and minimized delays are all examples of cost savings.
Cost avoidance projects are implemented to reduce risks, avoid prob-
lems, or prevent unwanted events. Some professionals may view cost
avoidance as an inappropriate measure to use to determine monetary
56 ACHIEVING BUSINESS ALIGNMENT WITH THE PROJECT
benefits and calculate ROI. However, if the assumptions prove correct, an
avoided cost, e.g., compliance fines, can be more rewarding than reducing
an actual cost. Preventing a problem is more c ost-effective than waiting
for the problem to occur and then having to focus on solving it.
Determining the potential payoff is the first step in the needs analysis
process. This step is closely related to the next one, determining the
business need, since the potential payoff is often based on a consideration
of the business. The payoff depends on two factors: the monetary value
derived from the business measure’s improvement and the approximate
cost of the project. Identifying these monetary values in detail usually
yields a more credible forecast of what can be expected from the chosen
solution. However, this step may be omitted in situations where the
problem (business need) must be resolved regardless of the cost, or if it
becomes obvious that this is a high-payoff activity.
The target level of detail may also hinge on the need to secure project
funding. If the potential funding source does not recognize the value of
the project compared with the potential costs, more detail may be needed
to provide a convincing case for funding.
Knowledge of the actual payoff is not necessary if widespread agree-
ment exists that the payoff from the project will be high, or if the problem
in question must be resolved regardless of cost. For example, if the pro-
posed project involves a safety concern, a regulatory compliance issue, or
a competitive matter, a detailed analysis is not needed.
Obvious versus Not-So-Obvious Payoff
The potential payoff is obvious for some projects and not so obvious for
others. Opportunities with obvious payoffs may include
•
Operating costs 47 percent higher than industry average
•
Customer satisfaction rating of 3.89 on a 10-point scale
•
A cost to the city of $75,000 annually for each homeless person
•
Noncompliance fines totaling $1.2 million, up 82 percent from last
year
•
Turnover of critical talent 35 percent above benchmark figure
•
System downtime is twice the average of last year’s results
•
Very low market share in a market with few players
•
Safety record is among the worst in the industry
•
Excessive product returns: 30 percent higher than previous year
Determining the Potential Payoff 57
•
Excessive absenteeism in call centers: 12.3 percent, compared to 5.4
percent industry average
•
Sexual harassment complaints per 1,000 employees are the highest
in the industry
Each item appears to reflect a serious problem that needs to be
addressed by executives, administrators, or politicians.
For other projects, the issues are sometimes unclear and may arise
from political motives or bias. These potential opportunities are associated
with payoffs that may not be so obvious. Such opportunities may include
•
Become a technology leader
•
Become a ‘‘green’’ company
•
Improve leadership competencies for all managers
•
Improve branding for all products
•
Create a great place to work
•
Organize a business development conference
•
Establish a project management office
•
Provide job training for unemployed workers
•
Implement lean Six Sigma
•
Train all team leaders on crucial conversations
•
Provide training on sexual harassment awareness for all associates
•
Develop an ‘‘open book’’ company
•
Implement the same workout process that GE has used
•
Implement a CRM system
•
Convert to cloud computing
•
Implement a transformation program involving all employees
•
Implement a career advancement program
•
Create a wellness and fitness center
With each of these opportunities, there is a need for more specific detail
regarding the measure. For example, if the opportunity is to become a
‘‘green’’ company, one might ask: What is a green company? How will
we know when we’re green? How is green defined? Projects with not-so-
obvious payoffs require greater analysis than those with clearly defined
outcomes.
The potential payoff establishes the fundamental reason for pursuing
new or enhanced projects. But the payoff—whether obvious or not—is not
the only reason for moving forward with a project. The cost of a problem
58 ACHIEVING BUSINESS ALIGNMENT WITH THE PROJECT
is another factor. If the cost is excessive, it should be addressed. If not,
then a decision must be m ade as to whether the problem is worth solving.
The Cost of a Problem
Sometimes projects are undertaken to solve a problem. Problems are
expensive and their solution can result in high returns, especially when
the solution is inexpensive. To determine the cost of the problem, its
potential consequences must be examined and converted to monetary
values. Problems may encompass time, quality, productivity, and team
or customer issues. All of these factors must be converted to monetary
values if the cost of the problem is to be determined. Inventory shortages
are often directly associated with the cost of the inventory as well as
with the cost of carrying the inventory. Time can easily be translated into
money by calculating the fully loaded cost of an individual’s time spent on
unproductive tasks. Calculating the time for completing a project, task, or
cycle involves measures that can be converted to money. Errors, mistakes,
waste, delays, and bottlenecks can often be converted to money because of
their consequences. Productivity problems and inefficiencies, equipment
damage, and equipment underuse are other items whose conversion to
monetary value is straightforward.
In examining costs, considering all the costs and their implications is
crucial. For example, the full cost of an accident includes not only the
cost of lost workdays and medical expenses, but their effects on insurance
premiums, the time required for investigations, damage to equipment,
and the time spent by all involved employees addressing the accident. The
cost of a customer complaint includes not only the cost of the time spent
resolving the complaint, but also the value of the item or service that has
to be adjusted because of the complaint. The costliest consequence of a
customer complaint is the price to the company of lost future business and
goodwill from the complaining customer and from potential customers
who learn of the complaint.
Placing a monetary value on a problem helps in determining if the
problem’s resolutions are economically feasible. The same applies to
opportunities.
The Value of a n Opportunity
Sometimes projects are undertaken to pursue an opportunity. Just as
the cost of a problem can be easily tabulated in most situations, the
Determining Business Needs 59
value of an opportunity can also be calculated. Examples of opportu-
nities include implementing a new process, exploring new technology,
increasing research and development efforts, and upgrading the work-
force to create a more competitive environment. In these situations a
problem may not exist, but an opportunity to get ahead of the competition
or to prevent a problem’s occurrence by taking immediate action does.
Assigning a proper value to this opportunity requires considering what
may happen if the project is not pursued or acknowledging the windfall
that might be realized if the opportunity is seized. The value is determined
by following the different possible scenarios to convert specific business
impact measures to m oney. The difficulty in this process is conducting a
credible analysis. Forecasting the value of an opportunity entails many
assumptions compared with calculating the value of a known outcome.
To Forecast or Not to Forecast?
The need to seek and assign value to opportunities leads to an important
decision: to forecast or not to forecast ROI. If the stakes are high and
support for the project is not in place, a detailed forecast may be the only
way to gain the needed support and funding for the project or to inform
the choice between multiple potential projects. In developing the forecast,
the rigor of the analysis is an issue. In some cases, an informal forecast is
sufficient, given certain assumptions about alternative outcome scenarios.
In other cases, a detailed forecast is needed that uses data collected from
a variety of experts, previous studies from another project, or perhaps
more sophisticated analysis. Chapter 12 provides techniques useful for
developing forecasts.
When the potential payoff, including its financial value, has been
determined, the next step is to clarify the business needs.
DETERMINING BUSINESS NEEDS
Determining the business needs requires the identification of specific
measures so that the business situation can be clearly assessed. The con-
cept of business needs refers to gains in productivity, quality, efficiency,
time, and cost. This is true for the private sector as well as in government,
nonprofit, and academic organizations.
A business need is represented by a business measure. Any process,
item, or perception can be measured, and such measurement is critical
60 ACHIEVING BUSINESS ALIGNMENT WITH THE PROJECT
to this level of analysis. If the project focuses on solving a problem,
preventing a problem, or seizing an opportunity, the measures are usually
identifiable. The important point is that the measures are present in the
system, ready to be captured for this level of analysis. The challenge is to
define the measures and to find them economically and swiftly.
Hard Data Measures
To focus on the desired measures, distinguishing between hard data and
soft data may be helpful. Hard data are primary measures of improvement
presented in the form of rational, undisputed facts that are usually
gathered within functional areas throughout an organization. These are
the most desirable type of data because they are easy to quantify and
are easily converted to monetary values. The fundamental criteria for
gauging the effectiveness of an organization are hard data items such as
revenue, productivity, and profitability, as well as measures that quantify
such processes as cost control and quality assurance.
Hard data are objective and credible measures of an organization’s per-
formance. Hard data can usually be grouped in four categories, as shown
in Table 4.1. These categories—output, quality, costs, and time—are
typical performance measures in any organization.
Hard data from a particular project involve improvements in the output
of the work unit, section, department, division, or entire organization.
Every organization, regardless of the type, must have basic measures
of output, such as number of patients treated, students graduated, tons
produced, or packages shipped. Since these values are monitored, changes
can easily be measured by comparing ‘‘before’’ and ‘‘after’’ outputs.
Quality is a very important hard data category. If quality is a major
priority for the organization, processes are likely in place to measure and
monitor quality. The rising prominence of quality improvement processes
(such as Total Quality Management, Continuous Quality Improvement,
and Six Sigma) has contributed to the tremendous recent successes
in pinpointing the proper quality measures—and assigning monetary
values to them.
Cost is another important hard data category. Many projects are
designed to lower, control, or eliminate the cost of a specific process or
activity. Achieving cost targets has an immediate effect on the bottom
line. Some organizations focus narrowly on cost reduction. For example,
consider Wal-Mart, whose tagline is ‘‘Always low prices. Always.’’ All
Determining Business Needs 61
Table 4.1 Examples of Hard Data
Output Quality Costs Time
Units produced Failure rates Shelter costs Cycle time
Tons manufactured Dropout rates Treatment costs Equipment
downtime
Product returns
Items assembled Scrap Budget variances Overtime
Money collected Waste Unit costs On-time shipments
Items sold Rejects Cost by account Time to project
completion
New accounts
generated
Error rates Variable costs
Accidents Processing time
Forms processed Rework Fixed costs
Loans approved Shortages Overhead cost Supervisory time
Inventory turnover Product defects Operating costs Time to proficiency
Patients served Deviation from
standard
Learning time
Applications
processed
Product failures Accident costs Adherence to
schedules
Students
graduated
Inventory
adjustments
Program costs Repair time
Tasks completed Sales expense Efficiency
Output per hour Incidents Work stoppages
Productivity Compliance
discrepancies
Order response
Work backlog Agency fines Late reporting
Shipments Lost-time days
Project completions
levels of the organization are dedicated to lowering costs on processes and
products and passing the savings along to customers.
Time is a critical measure in any organization. Some organizations
gauge their performance almost exclusively in relation to time. When
asked what business FedEx is in, company executives say, ‘‘We engineer
time.’’
62 ACHIEVING BUSINESS ALIGNMENT WITH THE PROJECT
Soft Data Measures
Soft data are probably the most familiar measures of an organiza-
tion’s effectiveness, yet their collection can present a challenge. Values
representing attitude, motivation, and satisfaction are examples of soft
data. Soft data are more difficult to gather and analyze, and therefore,
they are used when hard data are not available or to supplement hard
data. Soft data are also more difficult to convert to m onetary values, a pro-
cess requiring subjective methods. They are less objective as performance
measurements and are usually behavior related, yet organizations place
great emphasis on them. Improvements in these measures represent
important business needs, but many organizations omit them from the
ROI equation because they are soft values. However, they can contribute
to economic value to the same extent as hard data measures. The key is
not to focus too much on the hard versus soft data distinction. A better
approach is to consider data as tangible or intangible. Table 4.2 shows
common examples of soft data by category.
Tangible versus Intangible Benefits: A Better Approach
A challenge with regard to soft versus hard data is converting soft
measures to monetary values. The key to this problem is to remember
that, ultimately, all roads lead to hard data. Although creativity may be
categorized as a form of soft data, a creative workplace can develop new
products or new patents, which leads to greater revenue—clearly a hard
data measure. Although it is possible to convert the measures listed in
Table 4.2 to monetary amounts, it is often more realistic and practical to
leave them in nonmonetary form. This decision is based on considerations
of credibility and the cost of t he conversion. According to the standards
of the ROI methodology, an intangible measure is defined as a measure
that is intentionally not converted to money. If a soft data measure can
be converted to a monetary amount credibly using minimal resources, it
is considered tangible, reported as a monetary value, and incorporated in
the ROI calculation. If a data item cannot be converted to money credibly
with minimal resources, it is listed as an intangible measure. Therefore,
in defining business needs, the key difference between measures is not
whether they represent hard or soft data, but whether they are tangible
or intangible. In either case, they are important contributions toward the
desired payoff and important business impact data.
Determining Business Needs 63
Table 4.2 Examples of Soft Data
Work Habits
Excessive breaks
Tardiness
Visits to the dispensary
Violations of safety rules
Communication breakdowns
Work Climate/Satisfaction
Grievances
Discrimination charges
Employee complaints
Job satisfaction
Organization commitment
Employee engagement
Employee loyalty
Intent to leave
Stress
Initiative/Innovation
Creativity
Innovation
New ideas
Suggestions
New products and services
Trademarks
Copyrights and patents
Process improvements
Partnerships/alliances
Customer Service
Customer complaints
Customer satisfaction
Customer dissatisfaction
Customer impressions
Customer loyalty
Customer retention
Lost customers
Employee Development/Advancement
Promotions
Capability
Intellectual capital
Requests for transfer
Performance appraisal ratings
Readiness
Networking
Image
Brand awareness
Reputation
Leadership
Social responsibility
Environmental friendliness
Social consciousness
Diversity
External awards
Business Data Sources
The sources of business data, whether tangible or intangible, are diverse.
The data come from routine reporting s ystems in the organization. In
many situations, these items have led to the need for the project. A vast
array of documents, systems, databases, and reports can be used to select
the specific measure or measures to be monitored throughout the project.
Impact data sources include quality reports, service records, suggestion
systems, and employee engagement data.
Some project planners and project team members assume that corpo-
rate data sources are scarce because the data are not readily available to
them. However, data can usually be located by investing a small amount
64 ACHIEVING BUSINESS ALIGNMENT WITH THE PROJECT
of time. Rarely do new data collection systems or processes need to be
developed in order to identify data representing the business needs of an
organization.
In searching for the proper measures to connect to the project and to
identify business needs, it is helpful to consider all possible measures that
could be influenced. Sometimes, collateral measures move in harmony
with the project. For example, efforts to improve safety may also improve
productivity and increase job satisfaction. Weighing adverse impacts on
certain measures may also help. For example, when cycle times are
reduced, quality may suffer; when sales increase, customer satisfaction
may deteriorate. Finally, project team members must anticipate unin-
tended consequences and capture them as other data items that might be
connected to or influenced by the project.
In the process of settling on the precise business measures for the
project, it is useful to examine various ‘‘what if’’ scenarios. If the orga-
nization does nothing, the potential consequences of inaction should be
made clear. The following questions may help in understanding the
consequences of inaction:
•
Will the situation deteriorate?
•
Will operational problems surface?
•
Will budgets be affected?
•
Will we lose influence or support?
Answers to these questions can help the organization settle on a precise
set of measures and can provide a hint of the extent to which the measures
may change as a result of the project.
DETERMINING PERFORMANCE NEEDS
The next step in the needs analysis is to understand what led to the
business need. If the proposed project addresses a problem, this step
focuses on the cause of the problem. If the project makes use of an
opportunity, this step focuses on what is inhibiting the organization from
taking advantage of that opportunity. This is the performance needs.
Analysis Techniques
Uncovering the causes of the problem or the inhibitors to success requires
a variety of analytical techniques. These techniques—s uch as problem
Determining Learning Needs 65
Table 4.3 Analysis Techniques
Statistical Process Control
Brainstorming
Problem Analysis
Cause-and-Effect Diagram
Force-field Analysis
Mind Mapping
Affinity Diagrams
Simulations
Diagnostic Instruments
Focus Groups
Probing Interviews
Job Satisfaction Surveys
Engagement Surveys
Exit Interviews
Exit Surveys
Nominal Group Technique
analysis, nominal group technique, force-field analysis, and just plain
brainstorming—are used to clarify job performance needs. Table 4.3 lists
a few of the analysis techniques. The technique that is used will depend
on the organizational setting, the apparent depth of the problem, and the
budget allocated to such analysis. Multiple techniques can be used since
performance may be lacking for a number of reasons.
A Sensible Approach
Analysis takes time and adds to a project’s cost. Examining records,
researching databases, and observing individuals can provide important
data, but a more cost-effective approach might include employing internal
and/or external experts to help analyze the problem. Performance needs
can vary considerably and may include ineffective behavior, a dysfunc-
tional work climate, inadequate systems, a disconnected process flow,
improper procedures, a nonsupportive culture, outdated technology, and
a nonaccommodating environment, to name a few. When needs vary and
with many techniques to choose from, the opportunity exists for overanal-
ysis and excessive costs. Consequently, a sensible approach is called for.
DETERMINING LEARNING NEEDS
The solution to performance needs uncovered in the previous step often
requires a learning component—such as participants and team members
learning how to perform a task differently, or learning how to use a
process or system. In some cases learning is the principal solution, as
in competency or capability development, major technology change, and
system installations. For other projects, learning is a minor aspect of the
66 ACHIEVING BUSINESS ALIGNMENT WITH THE PROJECT
solution and may involve simply understanding the process, procedure,
or policy. For example, in the implementation of a new ethics policy for
an organization, the learning component requires understanding how the
policy works as well as the participants’ role in the policy. In short, a
learning solution is not always needed, but all solutions have a learning
component.
A variety of approaches are available for measuring specific learning
needs. Often, multiple tasks and jobs are involved in a project and should
be addressed separately. Sometimes the least effective way to identify
the skills and knowledge that are needed is to ask the participants
involved in implementing the project. They may not be clear on what is
needed and may not know enough to provide adequate input. One of the
most useful ways to determine learning needs is to ask the individuals
who understand the process. They can best determine what skills and
knowledge are necessary to address the performance issues that have
been identified. This may be the appropriate time to find out the extent
to which the knowledge and skills already exist.
Job and task analysis is effective when a new job is created or when
an existing job description changes significantly. As jobs are redesigned
and the new tasks must be identified, this type of analysis offers a
systematic way of detailing the job and task. Essentially, a job analysis is
the collection and evaluation of work-related information. A task analysis
identifies the specific knowledge, skills, tools, and conditions necessary to
the performance of a particular job.
Observation of current practices and procedures in an organization
may be necessary as the project is implemented. This can often indicate
the level of capability and help to identify the correct procedures. Obser-
vations can be used to examine work flow and interpersonal interactions,
including those between management and team members. Observers
may be previous employees, third-party participant observers, or mystery
shoppers.
Sometimes, the demonstration of knowledge surrounding a certain
task, process, or procedure provides evidence of what capabilities exist
and what is lacking. Such demonstration can be as simple as a skill prac-
tice or role play, or as complex as an extensive mechanical or electronic
simulation. The point is to use this as a way of determining if employ-
ees know how to perform a particular process. Through demonstration,
specific learning needs can evolve.
Testing as a learning needs assessment process is not used as fre-
quently as other methods, but it can be very useful. Employees are tested
Determining Preference Needs 67
to reveal what they know about a particular situation. This information
helps to guide learning issues.
In implementing projects in organizations where there is an existing
manager or team leader, input from the management team may be used
to assess the current situation and to indicate the knowledge and skills
required by the new situation. This input can be elicited through surveys,
interviews, or focus groups. It can be a rich source of information about
what the users of the project, if it is implemented, will need to know to
make it successful.
Where learning is a minor component, learning needs are simple.
Determining learning needs can be very time-consuming for major
projects where new procedures, technologies, and processes must be
developed. As in developing job performance needs, it is important not
to spend excessive time analyzing learning needs but rather to collect as
much data as possible with minimal resources.
DETERMINING PREFERENCE NEEDS
The final level of needs analysis determines the preferences that drive the
project requirements. Essentially, individuals prefer certain processes,
schedules, or activities for the structure of the project. These preferences
define how the particular project will be implemented. If the project is a
solution to a problem, this step defines how the solution will be installed.
If the project makes use of an opportunity, this step outlines how the
opportunity will be addressed, taking into consideration the preferences
of those involved in the project.
Preference needs typically define the parameters of the project in terms
of scope, timing, budget, staffing, location, technology, deliverables, and
the degree of disruption allowed. Preference needs are developed from
the input of several stakeholders rather than from one individual. For
example, participants in the project (those who must make it work) may
have a particular preference, but the preference could exhaust resources,
time, and budgets. The immediate manager’s input may help minimize
the amount of disruption and maximize resources. The funds that can be
allocated are also a constraining resource.
The urgency of project implementation may introduce a constraint
in the preferences. Those who support or own the project often impose
preferences on the project in terms of timing, budget, and the use of
technology. Because preferences correspond to a Level 1 need, the project
68 ACHIEVING BUSINESS ALIGNMENT WITH THE PROJECT
structure and solution will relate directly to the reaction objectives and
to the initial reaction to the project.
In determining the preference needs, there can never be too much
detail. Projects often go astray and fail to reach their full potential because
of misunderstandings and differences in expectations surrounding the
project. Preference needs should be addressed before the project begins.
Pertinent issues are often outlined in the project proposal or planning
documentation.
CASE STUDY: SOUTHEAST CORRIDOR BANK
Payoff Needs
At this point, following a case study through the different levels of
needs may be helpful. The following discussion explores the analysis
at Level 5, determining payoff needs. Southeast Corridor Bank (SCB)
operated branches in four states. (SCB has since been acquired by Regions
Bank, one of the nation’s top ten banks.) Like many other fast-growing
organizations, SCB faced merger and integration problems, including
excessive employee turnover. A project manager was assigned the task of
reducing the voluntary turnover.
SCB’s annual employee turnover was 57 percent, compared with an
industry average of 26 percent. The first step in addressing the problem
was answering these questions:
•
Is this a problem worth solving?
•
Is there a potential payoff to solving the problem?
To the senior vice president of human resources, the answers were
clear. After reviewing several published studies about the cost of
turnover—including one from a financial institution—he concluded that
the cost of employee turnover ranged between 110 and 225 percent of
annual pay. At the current rate, employee turnover was costing the bank
more than $6 million per year. Lowering the rate to the industry average
would save the bank at least $3 million annually. Although the structure
and cost of the solution had not been determined at this point, it became
clear that this problem was worth solving. Unless the solution appeared
to be very expensive, solving the problem would have a tremendous
impact. This was the only analysis that was needed at this level.
Case Study: Southeast Corridor Bank 69
Business Needs
The specific measure in question was voluntary turnover: the num-
ber of employees leaving voluntarily divided by the average number of
employees, expressed as a percentage. Clearly defining the measure was
important. Still, with improvement in any one measure, other measures
should also improve, depending on the specific solution. For example,
staffing levels, job satisfaction, customer service, sales revenue, and
other measures could change. These considerations are detailed in the
context of determining the solution.
Performance Needs
To identify the job performance needs, the cause of the problem had
to be determined. When the cause was determined, a solution could be
developed.
The nominal group technique was selected as the analysis method
because it allowed unbiased input to be collected efficiently and accurately
across the organization. Focus groups were planned consisting of twelve
employees from each region, for a total of six groups representing all the
regions. In addition, two focus groups were planned for the clerical staff in
the corporate headquarters. This approach provided approximately a 10
percent sample, which was considered sufficient to pinpoint the problem.
The focus group participants who represented areas in which turnover
was highest described why their colleagues were leaving, not why they
themselves would leave. Data were collected from individuals using a
carefully structured format—during two-hour meetings at each location,
with third-party facilitators—and were integrated and weighted so that
the most important reasons were clearly identified. This process had the
advantages of low cost and high reliability, as well as a low degree of
bias. Only two days of external facilitator time were needed to collect and
summarize the data for review.
Following are the ten major reasons given for turnover in the bank
branches:
1. Lack of opportunity for advancement
2. Lack of opportunity to learn new skills and gain new product
knowledge
3. Pay level not adequate