Research and Markets Project Management_3 pot
Bạn đang xem bản rút gọn của tài liệu. Xem và tải ngay bản đầy đủ của tài liệu tại đây (270.32 KB, 30 trang )
106 MEASURING APPLICATION AND IMPLEMENTATION
•
To reinforce in current and future project participants the value of
desired actions
•
To improve management support for projects
•
To market future projects
FINAL THOUGHTS
Measuring application and implementation is critical in determining the
success of a project or program. This essential measure not only deter-
mines the success achieved, but also identifies areas where improvement
is needed and where success can be replicated in the future. This chapter
presents a variety of techniques to collect application data, ranging from
observation to use of questionnaires and action plans. The method chosen
must match the scope of the project. Understanding success with applica-
tion is important in providing evidence that business needs should be met,
but it is only through measurement at Level 4, impact and consequences,
that a direct link between the project and business impact can be made.
Chapter 7
Measuring Business Impact
Most project sponsors regard business impact data as the most important
data type because of its connection to business success. Top executives
rate this as their number one measure. For many projects, inadequate
performance in business measures (the business need) is usually what
initiated the project. Business impact data taken from follow-up after the
project is implemented close the loop by showing a project’s success in
meeting the business needs. This chapter examines a variety of business
impact measures and the specific method to collect the measures within
a project.
PROJECT VERSUS PROJECT MANAGEMENT
It is helpful to remember that this methodology is appropriate for showing
the ROI of the project or a particular project management solution.
This chapter, like the two previous chapters, focuses on data collection.
For a project, it involves collecting reaction, learning, application, and
impact data reflecting the success of the project. If a project management
solution is being implemented, e.g., project management training, project
management software, or a project management office, the data collection
would focus on the success of that particular solution. The techniques are
the same; the focus is a little different.
This chapter focuses on business impact data influenced by the project.
This shows the impact influenced by the project itself in business terms.
If there is interest in measuring the success of a project management
solution, the impact would be the part of the project’s success allocated
to the project management solution. In addition, a project management
107
Project Management ROI: A Step-by-Step Guide for Measuring the Impact and ROI for Projects
Jack J. Phillips, Wayne Brantley, and Patricia Pulliam Phillips
Copyright © 2012 John Wiley & Sons, Inc.
108 MEASURING BUSINESS IMPACT
solution may influence the budget and time allocated for the project, as
well as the quality of the project’s success. These measures may be unique
to the project management solution. Most of this chapter focuses on how
the project is valued, which is often the most critical issue. A portion
of the project’s success is then allocated to the project management
solution, which is contained following one or more techniques in the next
chapter.
THE IMPORTANCE OF BUSINESS IMPACT
Several rationales support the collection of business impact data related
to a project.
Higher-Level Data
Following the assumption that higher-level data create more value for
project sponsors, business impact measures offer more valuable data.
Impact data are the consequence of the application and implementation of
a project. They represent the bottom-line measures positively influenced
when a project is successful. For some stakeholders, these are the most
valuable data.
The chain of impact can be broken at Level 4, and this happens in many
projects. If the project does not drive business impact data—or drives
too little data when converted to monetary values—to create a positive
ROI, then the corresponding results may be less than satisfactory. In
extreme cases, the project can meet with success at the lower levels but
fail at Level 4. Participants may react positively to the project; may learn
successfully to implement the project; and at Level 3 they may follow
the correct implementation steps or use the skills needed to implement
the project. However, when the business impact measure (which is
anticipated to be influenced by the project) does not change, the project
does not add value. What could cause this? There are two possibilities.
First, the business alignment for the project may not have been completed
properly during the initial analysis, which would keep it from being
the right solution. Although the project may have been implemented, it
has driven activity and not results. The second possibility is that other
factors are driving the business measure. Although the project could be
connected to the measure, other influences may be affecting the business
measure in a direction opposite that desired by project planners. So it
The Importance of Business Impact 109
may appear at first glance that the project has no value, but in reality
it could. This brings into focus the importance of isolating the effects of
a project. The business data may be disappointing, but they would be
even more disappointing without the project. The important process of
isolating the effects of the project is presented in Chapter 8.
A Business Driver for Projects
For most projects, business impact data represent the initial drivers
for the project. The problem of deteriorating (or less than expected)
performance or the opportunity for improvement of a business measure
usually leads to a project. If the business needs defined by business
measures are the drivers for a project, then the key measure for evaluating
the project is the business measure. The extent to which measures have
changed is the principal determinant of project success.
‘‘The Money’’ for Sponsors
From the perspective of the sponsor, business impact data reflect key
payoff measures. These are the measures often desired by the sponsor
and the ones that the sponsor wants to see changed or improved. They
often represent hard, indisputable facts that reflect performance that
is critical to the business and operating unit level of the organization.
Business impact leads to ‘‘the money’’—to the actual return on investment
in the project. Without credible business impact data linked directly to
the project, it would be difficult, if not impossible, to establish a credible
monetary value for the project. This makes this level of data collection
one of the most critical.
Easy to Measure
One unique feature of business impact data is that they are often easy
to measure. Hard and soft data measures at this level often reflect key
measures that are found in plentiful numbers throughout an organization.
It is not unusual for an organization to have hundreds or even thousands
of measures reflecting specific business impact items. The challenge
is to connect the objectives of the project to the appropriate business
measures. This is more easily accomplished at the beginning of the
project.
110 MEASURING BUSINESS IMPACT
COLLECTING EFFECTIVE IMPACT MEASURES
Data Categories
Chapter 4 defined four data categories (hard, soft, tangible, and intan-
gible). In addition to being classified as hard or soft and tangible or
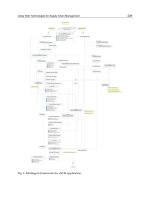
intangible, data can be categorized at several different levels, as shown in
Figure 7.1. The figure illustrates that some data are considered strategic
and are linked to the corporate level of an organization. Other data are
more operational, and are linked to the business unit level. Still others
are considered more tactical in nature and scope, and are used at the
operating level of an organization.
Examples of data categorized at the strategic level include financial,
people-oriented, and internal versus external data. At the business unit
level, classifications—such as output, quality, time, cost, job satisfaction,
and customer satisfaction—are critical categories. At the tactical level,
the categories are more plentiful and include: productivity, efficiency, cost
control, quality, time, attitudes, and individual and team performance.
The importance is not in the classification of data itself but in the aware-
ness of the vast array of data available. Regardless of their categories,
these data are consequence measures (Level 4) of project success. The
challenge is to find the data items connected directly to the project.
Metric Fundamentals
When determining the type of measures to use, reviewing metric fun-
damentals can be helpful. The first important issue is identifying what
makes an effective measure. Table 7.1 shows some of the criteria of
an effective measure. These are issues that should be explored when
examining any type of measure.
These criteria serve as a screening checklist as measures are con-
sidered, developed, and ultimately added to the list of possibilities. In
addition to meeting criteria, the factual basis of the measure should be
stressed. In essence, the measure should be subjected to a fact-based
analysis, a level of analysis never before applied to decisions about many
projects, even when these decisions have involved huge sums of money.
Distinguishing between the various ‘‘types’’ of facts is beneficial. As shown
below, the basis for facts ranges from commonsense to what employees
‘‘say,’’ to actual data.
Measures
Operating unit level
Business unit level
Corporate level
Tactical
Operational
Strategic
Figure 7.1 Measures at different levels.
111
112 MEASURING BUSINESS IMPACT
Table 7.1 Criteria for Effective Measures
Criteria: Effective
Measures Are . . . Definition: The Extent to Which a Measure . . .
Important Connects to strategically important business objectives
rather than to what is easy to measure
Complete Adequately tracks the entire phenomenon rather than
only part of the phenomenon
Timely Tracks at the right time rather than being held to an
arbitrary date
Visible Is visible, public, openly known, and tracked by those
affected by it, rather than being collected privately for
management’s eyes only
Controllable Tracks outcomes created by those affected by it who have
a clear line of sight from the measure to results
Cost-effective Is efficient to track using existing data or data that are
easy to monitor without requiring new procedures
Interpretable Creates data that are easy to make sense of and that
translate into employee action
Simplicity Simple to understand from each stakeholder’s perspective
Specific Is clearly defined so that people quickly understand and
relate to the measure
Collectible Can be collected with no more effort than is proportional
to the usefulness that results
Team-based Will have value in the judgment of a team of individuals,
not in the judgment of just one individual
Credible Provides information that is valid and credible in the
eyes of management
(Sources: Adapted from Kerr, Steve, ‘‘On the Folly of Rewarding A, While Hoping
for B,’’ Academy of Management Journal, vol. 18 (1995): 769–783; and Andrew Mayo,
Measuring Human Capital. London: The Institute of Chartered Accountants, June
2003.)
•
No facts. Commonsense tells us that employees will be more pro-
ductive if they have a stake in the profits of a company.
•
Unreliable facts. Employees say they are more likely to stay with a
company if they are offered profit sharing.
•
Irrelevant facts. We have benchmarked three world-class companies
with variable pay plans: a bank, a hotel chain, and a defense
contractor. All reported good results.
•
Fact-based. Employee turnover in call centers is reducing opera-
tional costs.
1
Collecting Effective Impact Measures 113
Scorecards
In recent years, interest has increased in developing documents that
reflect appropriate measures in an organization. Scorecards like those
used in sporting events provide a variety of measures for top executives. In
their landmark book The Balanced Scorecard, Robert Kaplan and David
Norton explore the concept of the scorecard for use by organizations.
2
Kaplan and Norton suggest that data can be organized in the four
categories of process, operational, financial, and growth.
What exactly is a scorecard? The American Heritage Dictionary defines
a scorecard from two perspectives:
1. A printed program or card enabling a spectator to identify players
and record the progress of a game or competition
2. A small card used to record one’s own performance in sports
Scorecards are varied in type, ranging from Kaplan and Norton’s
balanced scorecard to the scored set in the president’s management
agenda that uses a traffic-light grading system (green for success, yellow
for mixed results, red for unsatisfactory). Top executives place great
emphasis on scorecards, regardless of type. In some organizations, the
scorecard concept has filtered down to various functional business units,
and each unit of the business has been required to develop a scorecard.
A growing number of executives in different functions have developed
scorecards to reflect their segments of the business.
The scorecard approach is appealing because it provides a quick com-
parison of key business impact measures and examines the status of the
organization. As a management tool, scorecards can be important in shap-
ing and improving or maintaining the performance of the organization
through the implementation of preventive projects. Scorecard measures
often link to particular projects. In many situations, it was a scorecard
deficiency measure that initially prompted the project.
Identifying Specific Measures Linked to Projects
An important issue that often surfaces when considering ROI applica-
tions is the understanding of specific measures that are often driven by
specific projects. Although no standard answers are available, Table 7.2
represents a summary of typical payoff measures for specific types of
projects. The measures are quite broad for some projects. For example,
114 MEASURING BUSINESS IMPACT
Table 7.2 Typical Measures in ROI Application
ROI Applications
Project Key Impact Measurements
Absenteeism control/
reduction
Absenteeism, customer satisfaction, job satisfaction,
stress
Advertising Sales, market share, customer loyalty, cost of sales,
wallet share, customer satisfaction, branding
Branding projects Image, customer loyalty, customer retention, market
share
Business coaching Productivity/output, quality, time savings, efficiency,
costs, employee satisfaction, customer satisfaction
Business development Sales, customer loyalty, new accounts, customer
satisfaction
Career development/
career management
Turnover, promotions, recruiting expenses, job
satisfaction
Communications Errors, stress, conflicts, productivity, job satisfaction
Compensation Costs, productivity, quality, job satisfaction
Compliance Penalties/fines, charges, settlements, losses
Diversity/Inclusion Turnover, absenteeism, complaints, charges,
settlements, losses
e-Learning/mobile
learning
Cost savings, productivity improvement, quality
improvement, cycle times, error reductions, job
satisfaction
Employee benefits Costs, time savings, job satisfaction
Employee relations Turnover, absenteeism, job satisfaction, engagement
Engagement Productivity, quality, turnover, absenteeism
Flexible work systems Productivity, turnover, office space
Gainsharing plans Production costs, productivity, turnover
Job satisfaction Turnover, absenteeism, stress
Labor-management
cooperation projects
Work stoppages, employee grievances, absenteeism,
job satisfaction
Leadership
development
Productivity/output, quality, efficiency, cost/time
savings, employee satisfaction, engagement
Lean Six Sigma Cost savings, productivity improvement, quality
improvement, cycle times, error reductions, job
satisfaction
Marketing and
advertising
Sales, market share, customer loyalty, cost of sales,
wallet share, customer satisfaction, branding
(continues)
Collecting Effective Impact Measures 115
Table 7.2 (Continued)
ROI Applications
Project Key Impact Measurements
Meetings/events Sales, productivity/output, quality, time savings, job
satisfaction, customer satisfaction
Orientation,
on-boarding
Early turnover, training time, productivity
Outsourcing Costs, productivity, quality, job satisfaction, cycle
time, customer satisfaction
Personal productivity/
time management
Time savings, productivity, stress reduction, job
satisfaction
Procurement Costs, time savings, quality, stability, schedule
Project management Time savings, quality improvement, budgets
Public policy projects Time savings, cost savings, quality, satisfaction, image
Public relations Image, branding, customer satisfaction, investor
satisfaction
Recruiting source
(new)
Costs, yield, early turnover
Retention
management
Turnover, engagement, job satisfaction
Rewards systems Productivity, sales, quality, cycle time, costs
Risk management Fines, penalties, losses, downtime
Safety incentives Accident frequency rates, accident severity rates, first
aid treatments
Selection Early turnover, training time, productivity
Self-directed teams Productivity/output, quality, customer satisfaction,
turnover, absenteeism, job satisfaction
Sexual harassment
prevention
Complaints, turnover, absenteeism, employee
satisfaction
Six Sigma Defects, rework, response times, cycle times, costs
Skill-based pay Labor costs, turnover, absenteeism
Strategy/policy Productivity/output, sales, market share, customer
service, quality/service levels, cycle times, cost
savings, job satisfaction
Stress management Medical costs, turnover, absenteeism, job satisfaction
Systems Cycle times, error rates, productivity, efficiency,
customer satisfaction, job satisfaction
(continues)
116 MEASURING BUSINESS IMPACT
Table 7.2 (Continued)
ROI Applications
Project Key Impact Measurements
Talent management Productivity/output, quality, efficiency, cost/time
savings, employee satisfaction, engagement
Technical training Productivity, sales, quality, time, costs, customer
service, turnover, absenteeism, job satisfaction
Technology
implementation
Cycle times, error rates, productivity, efficiency,
customer satisfaction, job satisfaction
Wellness/fitness Turnover, medical costs, accidents, absenteeism
a reward systems project can pay off in a variety of measures, as in
improved productivity, enhanced sales and revenues, improved quality,
cycle-time reduction, and even direct cost savings. Essentially, the project
should drive the measure that the reward is designed to influence. In
other projects, the influenced measures are quite narrow. For example,
in labor-management cooperation projects, the payoffs are typically in
reduced grievances, fewer work stoppages, and improved employee sat-
isfaction. Orientation projects typically pay off in measures of early
turnover (turnover in the first ninety days of employment), initial job
performance, and productivity. The measures that are influenced depend
on the objectives and the design of the project.
Table 7.2 also illustrates the immense number of applications of this
methodology and the even larger set of measures that can be driven
or influenced. In most of these situations, assigning monetary values to
these measures (as the benefits of a given project are compared to the
costs) and developing the ROI become reasonable tasks.
A word of caution: Presenting specific measures linked to a typical
project may give the impression that these are the only measures influ-
enced. In practice, a given project can have many outcomes, and this can
make calculation of the ROI a difficult process. The good news is that most
projects are driving business measures. The monetary values are based
on what is being changed in the various business units, divisions, regions,
and individual workplaces. These are the measures that matter to senior
executives. The difficulty often comes in ensuring that the connection to
the project exists. This is accomplished through a variety of techniques
to isolate the effects of the project on the particular business measures,
as will be discussed in Chapter 8.
Business Performance Data Monitoring 117
BUSINESS PERFORMANCE DATA MONITORING
Data are available in every organization to measure business perfor-
mance. Monitoring performance data enables management to measure
performance in terms of output, quality, costs, time, job satisfaction, cus-
tomer satisfaction, and other measures. In determining the source of data
in the evaluation, the first consideration should be existing databases,
reports, and scorecards. In most organizations, performance data will be
available that are suitable for measuring improvement resulting from
a project. If data are not available, additional record-keeping systems
will have to be developed for measurement and analysis. The question of
economics surfaces at this point. Is it economical to develop the record-
keeping systems necessary to evaluate a project? If the costs will be
greater than the expected benefits, developing those systems is pointless.
Identify Appropriate Measures
Existing performance measures should be thoroughly researched to iden-
tify those related to the proposed objectives of the project. Often, several
performance measures are related to the same item. For example, the
efficiency of a production unit can be measured in several ways:
•
The number of units produced per hour
•
The number of units produced on schedule
•
The percentage of equipment used
•
The percentage of equipment downtime
•
The labor cost per unit of production
•
The overtime required per unit of production
•
Total unit cost
Each of these in its own way measures the effectiveness or efficiency of
the production unit. All related measures should be reviewed to determine
those most relevant to the project.
Convert Current Measures to Usable Ones
Occasionally, existing performance measures will become integrated with
other data. Keeping existing performance measures isolated from unre-
lated data may be difficult. In these situations, all existing related
measures should be extracted and retabulated to make them more
118 MEASURING BUSINESS IMPACT
appropriate for comparison in the evaluation. At times, it may be nec-
essary to develop conversion factors. For example, the average number
of new sales orders per month may be presented regularly in the per-
formance measures for the sales department. In addition, the sales costs
per sales representative may also be presented. However, in evaluating
the project, the average cost per new sale is needed. The average num-
ber of new sales orders and the average number of lost sales per sales
representative are required to develop the data necessary for comparison.
Develop New Measures
In some cases, data needed to measure the effectiveness of a project are
not available, and new data are needed. The project staff must work with
the client organization to develop record-keeping systems, if economically
feasible. In one organization, delays of the sales staff in responding to
customer requests were an issue. This issue was discovered from customer
feedback. The feedback data prompted a project to reduce the response
time. To help ensure the success of the project, several measures were
planned, including measuring the actual time to respond to a customer
request. Initially, this measure was not available. As the project was
implemented, new software was used to measure the time that elapsed
in responding to customer requests.
DATA COLLECTION METHODS
For many projects, business data are readily available to be monitored.
However, at times, data won’t be easily accessible to the project team
or to the evaluator. Sometimes data are maintained at the individual,
work unit, or department level and may not be known to anyone outside
that area. Tracking down all those data sets may be too expensive and
time-consuming. When this is the case, other data collection methods may
be used to capture data sets and make them available for the evaluator.
Three other options described in this book are the use of action plans,
performance contracts, and questionnaires.
Using Action Plans to Develop Business Impact Data
Action plans can capture application and implementation data, as dis-
cussed in Chapter 6. They can also be a useful tool for capturing business
Data Collection Methods 119
impact data. For business impact data, the action plan is more focused
and credible than using a questionnaire. The basic design principles and
the issues involved in developing and administering action plans are the
same for business impact data as for application and implementation
data. However, a few issues are unique to business impact and ROI, and
are presented here. The following steps are recommended when an action
plan is developed and implemented to capture business impact data and
to convert the data to monetary values.
Set Goals and Targets
An action plan can be developed with a direct focus on business impact
data. Participants develop an overall objective for the plan, which is
usually the primary objective of the project. In some cases, a project may
have more than one objective, which requires additional action plans. In
addition to the objective, the improvement measure and the current levels
of performance are identified. This information requires the participant
to anticipate the application and implementation of the project and to set
goals for specific performances that can be realized.
The action plan is completed during project implementation, often
with the input, assistance, and facilitation of the project team. The
evaluator or project leader actually approves the plan, indicating that
it meets the requirements of being Specific, Motivational, Achievable,
Realistic, and Time-based (SMART). The plan can be developed in a one-
to two-hour time frame and often begins with action steps related to the
implementation of the project. These action steps are Level 3 activities
that detail the application and implementation. All these steps build
support for and are linked to business impact measures.
Define the Unit of Measure
The next important issue is to define the actual unit of measure. In some
cases, more than one measure may be used, which will subsequently be
contained in additional action plans. The unit of measure is necessary to
break down the process into the simplest steps so that its ultimate value
can be determined. The unit may be output data—such as an additional
unit manufactured or package delivered—or it can be sales and marketing
data—such as additional sales revenue or a 1 percent increase in market
share. In terms of quality, the unit can be one reject, one error, or one
defect. Time-based units are usually measured in minutes, hours, days,
120 MEASURING BUSINESS IMPACT
or weeks. Other units are specific to their particular type of data, such as
one grievance, one complaint, one absence, or one less person receiving
welfare payments. The important point is to break down impact data into
the simplest terms possible.
Place a Monetary Value on Each Improvement
During project implementation, participants are asked to locate, calcu-
late, or estimate the monetary value of each improvement outlined in
their plans. The unit value is determined using a variety of methods,
including standard values, expert input, external databases, and esti-
mates. The process used in arriving at the value is described in the
instructions for the action plan. When the actual improvement occurs,
participants use these values to capture the annual monetary benefits of
the plan. For this step to be effective, it is helpful to understand the ways
values can be assigned to the data (as discussed in Chapter 9).
In the worst-case scenario, participants are asked to calculate the
values themselves, although use of standard values and consultation
with an expert are better courses of action. When it is necessary for
participants themselves to make the calculations, they must explain the
basis of them.
Implement the Action Plan
Participants implement the action plan during project implementation,
which often lasts for weeks or months following the launch of the project.
The participants follow action plan steps, and the subsequent business
impact results are achieved.
Provide Specific Improvements
At the end of the specified follow-up period—usually three months, six
months, nine months, or one year—the participants indicate the specific
improvements made, usually expressed as a daily, weekly, or monthly
amount. This determines the actual amount of change observed, mea-
sured, or recorded. Participants must understand the need for accuracy as
data are recorded. In most cases, only the changes are recorded, as these
amounts are needed to calculate the monetary value of the project. In
other cases, before-and-after data may be recorded, allowing the evaluator
to calculate the difference.
Data Collection Methods 121
Isolate the Effects of the Project
Although the action plan is initiated because of the project, the actual
improvements reported on the action plan may be influenced by other
factors. Consequently, the project should not be given full credit for the
improvement. For example, an action plan to implement a new system in
a division could only be given partial credit for a business improvement
because other variables may have affected the impact measures. Although
several ways are available to isolate the effects of a project, participant
estimation is usually most appropriate in the action planning process.
Consequently, participants are asked to estimate the percentage of the
improvement actually related to a particular project. This question can be
asked on the action plan form or in a follow-up questionnaire. Sometimes
it is beneficial to precede this question with a request to identify the
entire range of factors that could have influenced the results. This allows
participants to think through the relationships before actually allocating
a portion to this particular project.
Provide a Confidence Level for Estimates
The process to isolate the amount of the improvement actually related
to the project is not usually precise. Participants are asked to indicate
their level of confidence in their estimates. Using a scale of 0 to 100
percent—where 0 indicates the values are completely false and 100
percent indicates the values are absolutely certain—participants have a
way to express their uncertainty with their estimates.
Collect Action Plans at Specified Time Intervals
Because excellent high response rate is essential, several steps may
be necessary to ensure the action plans are completed and returned.
Participants usually see the importance of the process and develop their
plans in detail at the beginning of the project. Some organizations send
follow-up reminders by mail or e-mail; others phone participants to check
their progress. Others offer assistance in developing the final plan. These
steps may require additional resources, which must be weighed against
the importance of having more data. Specific ways to improve response
rates are discussed in Chapter 6.
Summarize the Data and Calculate the ROI
If developed properly, each action plan should have annualized mone-
tary values associated with improvements. Also, each individual should
122 MEASURING BUSINESS IMPACT
have indicated the percentage of the improvement directly related to the
project. Finally, participants should have provided a confidence percent-
age to reflect their uncertainty with the process and the subjective nature
of some of the data that may be provided.
Because this process involves estimates it may appear to be inaccurate,
although certain adjustments during analysis can make the process cred-
ible and more accurate. These adjustments reflect the guiding principles
that form the basis of the ROI methodology, as outlined in Table 3.1. The
adjustments are made in five steps as follows:
Step 1: If participants provide no data, assume they had no improve-
ment to report. (This is a very conservative approach.)
Step 2: Check each value for realism, usability, and feasibility. Discard
extreme values and omit them from analysis.
Step 3: Because the improvement is annualized, assume the project
had no improvement after the first year (for short-term
projects). (Chapter 9 discusses projects that add value after
two and three years.)
Step 4: Adjust the improvement calculated in Step 3, using the con-
fidence level multiplied by the confidence percentage. The
confidence level is actually a percentage of error suggested
by the participants. For example, a participant indicating
80 percent confidence with the process is reflecting a possibil-
ity of 20 percent error. In a $10,000 estimate with an 80 percent
confidence factor, the participant is suggesting a value in the
range of $8,000 to $12,000 (i.e., a range between 20 percent
less and 20 percent more). To be conservative, use the lower
number, and multiply the confidence factor by the value of the
improvement.
Step 5: Finally, adjust the new values by the percentage of the
improvement related directly to the project, using multipli-
cation to isolate the effects of the project.
Total the monetary values determined in these five steps to arrive at
the final project benefit. Because these values are already annualized, the
total of these benefits becomes the annual benefits for the project. Place
this value in the numerator of the ROI formula to calculate the ROI. The
formula is:
ROI =
Benefits − Costs × 100
Costs
Data Collection Methods 123
Using Performance Contracts to Measure Business Impact
Another technique for collecting business impact data is the performance
contract. The performance contract is essentially a slight variation of
the action plan. Based on the principle of mutual goal setting, a perfor-
mance contract is a written agreement between a participant and the
participant’s manager. The participant agrees to improve performance in
an area of mutual concern related to the project. The agreement is in
the form of a goal to accomplish during the project or after the project’s
completion. The agreement details what is to be accomplished, at what
time, and with what results.
Although the steps can vary according to the organization and the
specific kind of contract, a common sequence of events follows:
1. The employee (participant) becomes involved in project implemen-
tation.
2. The participant and his or her immediate manager agree on a
measure or measures for improvement related to the project (What’s
in it for me?).
3. Specific, measurable goals for improvement are set, following the
SMART requirements discussed earlier.
4. In the early stages of the project, the contract is discussed and plans
are developed to accomplish the goals.
5. During project implementation, the participant works to meet the
deadline set for contract compliance.
6. The participant reports the results of the effort to his or her
manager.
7. The manager and participant document the results and forward a
copy, with appropriate comments, to the project team.
The process of selecting the area for improvement is similar to the
process used in an action plan. The topic can cover one or more of the
following areas:
•
Routine performance related to the project, including specific
improvement in measures such as production, efficiency, and error
rates
•
Problem solving, focused on such problems as an unexpected
increase in workplace accidents, a decrease in efficiency, or a loss
of morale
124 MEASURING BUSINESS IMPACT
•
Innovative or creative applications arising from the project, which
could include the initiation of improvements in work practices,
methods, procedures, techniques, and processes
•
Personal development connected to the project, such as learning
new information and acquiring new skills to increase individual
effectiveness
The topic of the performance contract should be stated in terms of one
or more objectives that are
•
Written
•
Understandable by all involved
•
Challenging (requiring an unusual effort to achieve)
•
Achievable (something that can be accomplished)
•
Largely under the control of the participant
•
Measurable and dated
The performance contract objectives are accomplished by following
the guidelines for action plans presented earlier, and the methods for
analyzing data and reporting progress are essentially the same as those
used to analyze action plan data.
Using Questionnaires to Collect Business Impact Measures
As described in the previous chapters, the questionnaire is one of the
most versatile data collection tools and can be appropriate for Levels 1,
2, 3, and 4 data. Essentially, the design principles and content issues are
the same as at other levels, except that questionnaires developed for a
business impact evaluation will include additional questions to capture
those data specific to business impact.
The use of questionnaires for impact data collection brings both good
news and bad news. The good news is that questionnaires are easy to
implement and low in cost. Data analysis is very efficient, and the time
required to provide the data is often minimal, making questionnaires
among the least disruptive of data collection methods. The bad news is
that the data can be distorted and inaccurate, and are sometimes missing.
The challenge is to take all the steps necessary to ensure that question-
naires are complete, accurate, and clear, and that they are returned.
Unfortunately, questionnaires are the weakest of methods of data
collection. Paradoxically, they are the most commonly used because of
Data Collection Methods 125
their advantages. Of the first 100 case studies published on the ROI
methodology, roughly 50 percent used questionnaires as a method of data
collection. They are popular, convenient, low-cost, and have become a
way of life. The challenge is to improve them. The philosophy in the
ROI methodology is to take processes that represent the weakest method
and make them as credible as possible. Here the challenge is to make
questionnaires credible and useful by ensuring that they collect all the
data that is needed, that participants provide accurate and complete data,
and that return rates are in the 70 to 80 percent range.
The reason return rates must be high is explained in Guiding Principle
6 of the ROI methodology outlined in Table 3.1: No data, no improve-
ment. If an individual provides no improvement data, it is assumed that
the person had no improvement to report. This is a very conservative
principle but necessary to bring the credibility needed. Consequently,
using questionnaires will require effort, discipline, and personal atten-
tion to ensure proper response rates. Chapter 5 presented suggestions
for ensuring high response rates for Level 1 data collection. The same
techniques should be considered here. It is helpful to remember that this
is the least preferred method for collecting Level 4 data, and it is used
only when other methods don’t work (i.e., when business performance
data cannot be easily monitored, when action plans are not feasible, or
when performance contracting is not suitable).
Selecting the Appropriate Method for Each Level
The data collection methods presented in this and earlier chapters offer a
wide range of opportunities for collecting data in a variety of situations.
Eight aspects of data collection should be considered when deciding on
the most appropriate method of collecting any type of data.
Type of Data
One of the most important issues to consider when selecting the method
is the type of data to be collected. Some methods are more appropri-
ate for business impact. Follow-up surveys, observations, interviews,
focus groups, action planning, and performance contracting are best
suited—sometimes exclusively—for application data. Performance mon-
itoring, action planning, and questionnaires can easily capture business
impact data.
126 MEASURING BUSINESS IMPACT
Investment of Participants’ Time
Another important factor when selecting the data collection method is
the amount of time participants must spend with data collection and
evaluation systems. Time requirements should always be minimized, and
the method should be positioned so that it is a value-added activity. Par-
ticipants must understand that data collection is a valuable undertaking,
and not an activity to be resisted. Sampling can be helpful in keeping
total participant time to a minimum. Methods like performance moni-
toring require no participant time, whereas others, such as conducting
interviews and focus groups, require a significant investment in time.
Investment of Managers’ Time
The time that a project participant’s manager must allocate to data
collection is another issue in method selection. This time requirement
should always be minimized. Methods like performance contracting may
require significant involvement from the manager before and after project
implementation, whereas other methods, such as participants’ completion
of a questionnaire, may not require any manager time.
Cost of Method
Cost is always a consideration when selecting the method. Some data col-
lection methods are more expensive than others. For example, interviews
and observations are very expensive, whereas surveys, questionnaires,
and performance monitoring are usually inexpensive.
Disruption of Normal Work Activities
The issue that generates perhaps the greatest concern among managers
is the degree of work disruption that data collection will create. Routine
work processes should be disrupted as little as possible. Data collection
techniques like performance monitoring require very little time and cause
little distraction from normal activities. Questionnaires generally do not
disrupt the work environment and can often be completed in just a few
minutes, perhaps even after usual work hours. At the other extreme, tech-
niques, such as the focus group and interview, may disrupt the work unit.
Accuracy of Method
The accuracy of the technique is another factor to consider when selecting
the method. Some data collection methods are more accurate than others.
Measuring the Hard to Measure 127
For example, performance monitoring is usually very accurate, whereas
questionnaires are subject to distortion and may be unreliable. If on-the-
job behavior must be captured, observation is clearly one of the most
accurate methods. There is often a trade-off in the accuracy and costs of
amethod.
Utility of an Additional Method (Source or Time Frame)
Because many different methods to collect data exist, using too many
methods is tempting. Multiple data collection methods add time and cost
to the evaluation, and may result in very little added value. Utility refers
to the value added by each additional data collection method. When more
than one method is used, this question should always be addressed: Does
the value obtained from the additional data warrant the extra time and
expense of the method? If the answer is no, the additional method should
not be implemented. The same issue must be addressed when considering
multiple sources and time frames.
Cultural Bias of Data Collection Method
The culture or philosophy of the organization can dictate which data
collection methods are best to use. For example, if an organization or
audience is accustomed to using questionnaires, they will work well
within the culture of that organization. As another example, some orga-
nizations will not use observation because their culture will not support
the potential invasion of privacy.
MEASURING THE HARD TO MEASURE
The focus of this chapter is on capturing the measures that are easy to
collect and easy to measure. These represent the classic definitions of
hard data and soft data—or, tangible data and intangible data. Much
attention today is focused on the very hard to measure—on some of the
classic soft items that are even softer than customer satisfaction and job
satisfaction. Although this subject is discussed at length in Chapter 10,
Measuring the Intangibles, a few comments are appropriate here.
Everything Can Be Measured
Contrary to the thinking of some professionals, everything can be
measured. Any item, issue, or phenomenon that is important to an
128 MEASURING BUSINESS IMPACT
organization can be measured. Even images, perceptions, and ideas in a
person’s mind can be measured. The thorny issue is usually in identifying
the best way and the best resources to do the measuring. Although the
image of an organization in the community or the way that customers
become aware of a brand can be measured accurately, doing so takes
time and money.
A case in point is the project launched by Nissan Motor Company in
the 1980s when it located its first auto manufacturing plant in North
America. Nissan executives were very concerned about how a Japanese
automaker would be regarded in a traditional Southern community. (This
came at a time when common attitudes toward Japanese automakers
were more hostile than today.) The project involved surveying in the
communities that would host a Nissan plant. The results were impressive,
and demonstrated that you can measure anything if you can define it and
takethetimetomeasureit.
Perceptions Are Important
Some soft, or intangible, items are not based on perceptions, but others
are. For example, consider innovation. An important component of the
innovations in a company is image or perception. Also, some very clear
measures determine how innovative the company is able to be in its
processes, products, and services, e.g., number of new patents, number
of new products. However, concepts like brand awareness are based
strictly on perception, i.e., on what a person knows or perceives about
an item, product, or service. In the past, perceptions were considered
irrelevant and not very valuable, but today many decisions are based
on perceptions. For example, consider that perceptions about service
quality from the customer’s viewpoint often drive tremendous changes.
Employees’ perceptions of their employer often drive huge investments
in projects to improve job satisfaction, organizational commitment, and
engagement. Therefore, perceptions are very important and must be part
of the measurement plan for the hard to measure.
FINAL THOUGHTS
Business impact data are critical to address an organization’s business
needs. These data lead the evaluation to the ‘‘money.’’ Although perceived
as difficult to find, business impact data are readily available and very
Final Thoughts 129
credible. After describing the types of data that reflect business impact,
this chapter provides an overview of several data collection approaches
that can be used to capture business data. Some methods are gaining
greater acceptance for use in capturing impact data. Performance moni-
toring, follow-up questionnaires, action plans, and performance contracts
are used regularly to collect data for an impact analysis. This chapter
focuses on methods to collect data on project impact and consequences.
Linking these consequences directly to the project requires the important
step of isolating the effects of the project, a topic discussed in Chapter 8.
Chapter 8
Isolation of Project Impact
Reporting improvement in business impact measures is an important
step in a project evaluation that leads to the money. Invariably, however,
the question comes up (as it should): How much of this improvement
was the result of the project? Unfortunately, the answer is rarely
provided with any degree of accuracy and confidence. Although the
change in performance may in fact be linked to the project, other,
non-project-related factors may have contributed to the improvement
as well. If this issue is not addressed, the results reported will lack
credibility. This chapter explores useful techniques for isolating the
effects of t he project. These techniques have been used in some of the
most successful organizations as they attempt to measure the ROI from
projects.
THEIMPORTANCEOFTHISISSUE
In almost every project, multiple factors influence the business measures
targeted by a project. Determining the effect of each factor attributed
to the project is imperative. Without this isolation, the project’s success
cannot be confirmed; moreover, the effects of the project may be overstated
if the change in the business impact measure is attributed entirely to
the project. If this issue is ignored, the impact study may be considered
invalid and inconclusive. This puts pressure on evaluators and project
leaders to demonstrate the actual effects of their projects on business
improvement as opposed to other possible factors.
131
Project Management ROI: A Step-by-Step Guide for Measuring the Impact and ROI for Projects
Jack J. Phillips, Wayne Brantley, and Patricia Pulliam Phillips
Copyright © 2012 John Wiley & Sons, Inc.