Evapotranspiration Remote Sensing and Modeling Part 10 ppt
Bạn đang xem bản rút gọn của tài liệu. Xem và tải ngay bản đầy đủ của tài liệu tại đây (1.05 MB, 30 trang )
Estimation of the Annual and Interannual Variation of Potential Evapotranspiration
259
Fig. 6. Climate charts for years 2002 and 2003 and characteristics sizes determined for
reviewed site
Evapotranspiration – Remote Sensing and Modeling
260
Fig. 7. Climate charts for years 2004 and 2005 and characteristic sizes determined for
reviewed site
Estimation of the Annual and Interannual Variation of Potential Evapotranspiration
261
Fig. 8. Climate charts for years 2006 and 2007 and characteristic sizes determined for
reviewed site
Evapotranspiration – Remote Sensing and Modeling
262
Fig. 9. Climate charts for years 2008 and 2009 and characteristic sizes determined for
reviewed site
Estimation of the Annual and Interannual Variation of Potential Evapotranspiration
263
All the obtained values places the deltaic coast Sfântu Gheorghe in area with a dry climate
(Bandoc, 2009).
Regarding the average annual values of the variation of potential evapotranspiration, we
can say that, for the period 2000 - 2009 is an increase PET value to the annual average of the
reference period 1961 - 1990 at a rate of 7 %. Highest increases were registered in 2002, 2007
and 2009, years in which temperatures were recorded over annual average values of the
reference period.
The observed values of PET in these years are on average 11 % higher than the reference
period 1961 - 1990, while during other years the annual increases are in the range 0,07 1 6
% for the period 2000 - 2009 (fig. 11).
Concluding, it can be stated that for Sfântu Gheorghe coastal region there is a significant
increase in the potential evapotranspiration PET for the last 10 years compared to the
reference 1961-1990.
The method used to calculate potential evapotranspiration is Thorntwaite's method, using
average monthly air temperature values. Based on the values obtained for PET using the
method of Thornthwaite (Thornthwaite diagram), one can say that there are significant
variations in PET for the period under study from 2000 to 2009 compared with the reference
period 1961 - 1990, both as annual values and mean interannual values (fig. 12).
The interannual distribution of PET in the period 2000 - 2009 shows that these values were,
in most months in each year of the analyzed interval over the average interannual values of
the reference period 1961 - 1990. It appears that for the months of July and August all PET
values are over the annual average calculated for the same month of the reference period
1961 - 1990. For instance, for the months of July in 2000-2009 period compared to the the
reference values in 1961-1990, PET values are above the multiannual July average (fig.12).
Notable years for July values are 2001, 2007 and 2009 where the increase above the
multiannual monthly average were 20.14%, 13.66% and 17.98% respectively.
In the same time the following indices were calculated: monthly differences
PPET ,
annual amounts of differences with the same sign
P PET
and
P PET
, as well
as the yearly balance
P PET
A
, all these being important climatic indices. Calculations
for the two analyzed periods led to the following results regarding water deficit and excess
from precipitation presented below:
Fig. 10. Increases of the average annual percentage values of main indices for the period
2000 - 2009 for the studied site comparing to the specific values of the reference period
1961 – 1990.
Evapotranspiration – Remote Sensing and Modeling
264
Fig. 11. Changes in annual and multiannual average values of PET for the period 2000 -
2009. Comparison with the 1961 - 1990 annual average for the chosen location.
430, 4
1961 1990
mmP PET
;
515, 2
2000 2009
mmPPET
;
106, 2
1961 1990
mmPPET
;
80,8
2000 2009
mmP PET
The annual balance sheet
:2000 2009
P PET
A
shows a significant increase, with 31,6 %
of the water deficit comparing to the period 1961 - 1990 for which the balance reference
value is
330, 2
:1961 1990
mmP PET
A
.
The obtained values show that there is an increase in the deficit for the last 10 years by
19,7 % compared to the reference period and a decrease of 23,9 % in terms of excess rainfall
for the period 2000 - 2009 (fig. 13 ).
For emphasizing very clear each month’s character, at the bottom of the chart climate values
P were given indicating each month’s category in terms of surplus E or deficit D of
precipitation versus potential evapotranspiration. Thus, there are determined the
interannual values for the period 2000 - 2009 as well as average multiannual values for the
two periods under study.
Based on measurements one could build a mosaic of surpluses E and deficits D of
precipitation variation comparing to potential evapotranspirationfor in the period 2000-
2009, comparison with average multianual of E and D of the periods 2000-2009 and 1961-
1990 intervals (fig. 14).
Values for excess precipitation comparing to potential evapotranspiration reached a
maximum of E9 (>80 mm) and E7 (>60 mm) in February and November 2007 respectively,
values much higher than multiannual average of the reference period when the values were
E3 and E2 (see fig. 14).
Estimation of the Annual and Interannual Variation of Potential Evapotranspiration
265
Fig. 12. Interannual distribution of PET in the period 2000 - 2009 comparing to the annual
average of the reference period 1961 - 1990 for the studied area.
In addition, a reduction of the months with surplus between 2000 - 2009 for the years 2000,
2001, 2003 and 2004 can be seen. Also, there is a reduction in the number of months with a
precipitation surplus for 2000, 2001, 2003 and 2004. In these years the precipitation excedent
over PET period narrowed to 2 months in 2000 and 3 months in 2001, 2002, 2003 compared
to 5 months in the reference 1961-1990 period (fig. 14).
As for the precipitation - potential evapotranspiration deficit it can be stated that the deficits
suffered a significant increase compared to the reference period. Thus, there can be noticed
maximum values of deficits D17 (>160 mm) to be recorded in 2001 and 2002.
Evapotranspiration – Remote Sensing and Modeling
266
Fig. 13. Percent interannual variations of deficits D and surpluses E of precipitation to
potential evapotranspiration for the period 2000 - 2009.
It appears that while the deficit intervals of the average multiannual values is seven months,
the interannual period with deficit intervals is a few months longer between 2000 - 2009.
Thus, in 2000, 2001 and 2004 this period has increased by three months and two months
respectively compared to that of reference period (fig. 14).
I II III IV V VI VII VIII IX X XI XII
2000
E5 E1 D1 D4 D9 D9 D14 D12 D4 D5 D2 D1
2001
D1 E3 D1 D2 D
7
D8 D1
7
D13 D
7
D5 E2 E1
2002
E2 D2 E4 D4 D10 D12 D1
7
D10 D
7
D4 D2 E2
2003
E3 E2 D1 D2 D10 D11 D10 D12 D1 E1 E3 E1
2004
E4 E1 D2 D3 D3 D11 D11 D12 D6 D3 D1 E3
2005
E4 E4 E3 D3 D8 D
7
D9 D12 D2 D4 E6 E4
2006
E2 E2 E4 D3 D5 D13 D13 D
7
D5 D5 D1 E1
200
7
E2 E9 E1 D4 D10 D12 D16 D14 D6 E2 E
7
E3
2008
E3 E3 E1 D4 D8 D11 D13 D12 D4 D3 E2 E1
2009
E2 E2 D1 D5 D9 D13 D12 D13 D5 D3 E1 E3
1961-1990
E3 E3 E1 D5 D
7
D9 D11 D9 D6 D2 E2 E3
2000-2009
E3 E3 E1 D3 D8 D11 D13 D12 D5 D3 E2 E2
Fig. 14. Distribution of surpluses E and deficits D of precipitation comparing to potential
evapotranspiration in the period 2000 - 2009; comparison with average multiannual of E and
D of the periods 2000 - 2009 and 1961 – 1990.
Estimation of the Annual and Interannual Variation of Potential Evapotranspiration
267
Analysis of reference period in terms of deficit and surplus, highlights that the studied area
is characterized by a lack of D3 compared to the same period last years when the average
value increased to a deficit of D4, which means a 17,06 % increase in the deficit.
5. Conclusions
The research results concerning yearly and monthly potential evapotranspiration in the
Sfantu Gheorghe coastal area, synthetized in this chapter revealed for years 2001 to 2009
changes in the humidity periods, an increase in air temperature (Busuioc et al, 2010), a
diminished atmospheric precipitation amount and also an increase of precipitation to
potential evapotranspiration deficit compared to 1961-1990 reference period.
All these changes lead to high vulnerability and low adaptive capacity to adverse impacts
from climate change of this area (Liubimtseva & Henebry, 2009).
Thus, by drawing Walter and Leith diagrams, significant increase of dryness periods and
decrease of moisture periods were observed with implications upon potential
evapotranspiration and upon the shore phytocoenoses.
There are also changes in the length of the periods with precipitation surplus and deficit
compared to potential evapotranspiration that means increasing periods of deficit and
decreasing periods of surplus.
The following calculated characteristic measurements include the delta coast in Sfântu
Gheorghe in arid climate and climatic changes show that the period 2000 - 2009 led to a
trend towards increasing aridity: Martonne arid index (
I
ar
), retention index offset ( I
hc
), the
amount of rainfall in the period with temperature T ≥ 10 ° C (
0
10
P
tC
), the amount of rainfall the
soil load in the months from November to March ( P
XI III
), the amount of summer rainfall July and
August (
VII VIII
P
), Lang precipitation index for the period with t ≥ 10 °C (
0
10
L
tC
), Lang
precipitation index for the summer season ( L
VI VIII
) and Lang precipitation index for the spring
season ( L
III V
).
From the differences in monthly
PPET
calculation of amounts
P PET
,
P PET
of the precipitation deficit offset by previously accumulated P
, surpluses
and deficits of precipitation uncompensated by previous surpluses P
uc
and the annual
balance
P PET
A
for the period under study year 2000 - 2009 and for the reference
period 1961 - 1990, there was a deficit increase and a decrease of excess water from
precipitation, an extension of periods of water shortage against period with excess of water
and a significant increase by about 23,9 % for deficit of water that gathers negative
differences uncompensated during periods of surplus.
Therefore, the research presented in this article have highlighted significant changes in
potential evapotranspiration in relation to climate changes for the 2000 - 2009 studied
period, in Sfântu Gheorghe area - Danube Delta, showing an increase of precipitation deficit
and an increase of climate aridity .
Indirect method used in this paper work to determine the potential evapotranspiration was
based on the values of air temperature and Thornthwaite's diagrams and tables. In this way
a general view of a time variation of PET for Sfântu Gheorghe area - Danube Delta, has been
created.
Evapotranspiration – Remote Sensing and Modeling
268
The advantages of this indirect method results from the fact that it doesn’t require a large
number of measured meteorological parameters and that it can be easily applied obtaining
good estimates.
In the future it is intended that research should continue in order to see whether the growth
trend of a interannual and annual potential evaporation is kept over the period 2000 - 2009.
No doubt that climate change is underway affecting Earth's biodiversity.
Biggest challenge in this respect is related to the marine area, but it is unclear to what extent
these changes in climate will affect ecosystems.
What is known is that the temperatures that rise steadily and increasingly frequent extreme
weather events are those that have influence on migrating wildlife and also causes invasive
species.
Coastal areas offer considerable benefits to society while human activities are exerting
considerable pressure on coastal ecosystems. Therefore, these benefits to society are in
danger (Nobre, 2009).
6. Acknowledgment
Research carried out were conducted at the Center for Coastal Research and Environmental
Protection, Department of Meteorology and Hydrology at the University of Bucharest,
Romania.
7. References
Allen, R.G.; Pereira, L.S.; Raes, D. & Smith, M. (1998). Crop Evapotranspiration—Guidelines
for Computing Crop Water Requirements. Food and Agriculture Organization of
the United Nations. FAO Irrigation and drainage, Rome, ISBN 92-5-104219-4
Andréassian, V.; Perrin, Ch. & Michel, C. (2004). Impact of imperfect potential
evapotranspiration knowledge on the efficiency and parameters of watershed
models. Journal of Hydrology, Vol. 286, pp.19–35, ISSN 0022-1694
Bandoc, G. (2009). Costal phenologic cycles for Sfantu Gheorghe station (Danube Delta).
Journal of Environ. Protection and Ecology, Vol. 9, No. 4, pp 953-960, ISSN 1311 – 5065
Bandoc, G. & Golumbeanu, M (2010). Climate variability influence to the potential
evapotranspiration regime of Sfantu Gheorghe Delta Shore. Journal of Environmental
Protection and Ecology, Vol. 10, No. 1, pp.172 -181, ISSN 1311 – 5065
Baxter, E.V.; Nadim, S.; Farajalla & Nalneesh, G. (1996). Integrated GIS and distributed
storm water runoff modeling. In: Goodchild, et al. (Eds.), GIS and Environmental
Modeling Progress and Research Issues. Donald F. Hemenway Jr., Fort Collins, pp.
199–204, ISBN 0470-236-779
Berbecel, L.; Socor,O. & Roşca, V. (1970). Current concepts in studying the phenomenon
evapotranspiration (in romanian). Rev. Hidrotehnica, Vol. 15, No. 5, pp. 265-274
Bouchet, R. J. (1964). Évaporation réelle, évaporation – transpiration potentielle et
production agricole, în l'eau et la production végétale, Inst. Nat. De la Rech. Agr.,
Paris, pp. 151 – 232
Buchmann, N. (2000). Biotic and abiotic factors controlling soil respiration rates in Picea
abies stands. Soil Biol. Biochem, Vol. 32, pp. 1625–1635, ISSN 0038-0717
Estimation of the Annual and Interannual Variation of Potential Evapotranspiration
269
Busuioc,A; Caian, M.; Cheval, S.; Bojariu, R.; Boroneant, C.; Baciu, M.; Dumitrescu, A. (2010).
Climate variability and change in Romania, Ed. ProUniversitaria, pp. 59-72, ISBN 978-
973-129-549-7, Bucureşti, România
Casals, P.; Gimeno, C.; Carrara, A.; Lopez-Sangil, L. & Sanz, M. (2009). Soil CO
2
efflux and
extractable organic carbon fractions under simulated precipitation events in a
Mediterranean Dehesa. Soil Biol. Biochem, Vol. 41, pp. 1915–1922, ISSN 0038-0717
Caselles, V.;Artigao, M.M.; Hurtado; E.; Coll, C. & Brasa, A. (1998). Mapping actual
evapotranspiration by combining landsat TM and NOAA-AVHRR images:
application to the Barrax Area, Albacete, Spain. Remote Sensing of Environment, Vol.
No. 63, pp. 1–10, ISSN 0034-4257
Chattopadhyay, N. & Hulme, M. (1997). Evaporation and potential evapotranspiration in
India under conditions of recent and future climatic change. Agricultural and Forest
Meteorology , Vol. 87, No. 1, pp. 55-75. ISSN 0168-1923
Chiriţă, C.; Vlad, I.; Păunescu, C.; Pătrăşcoiu, N.; Roşu, C. & Iancu, I. (1977). Forest sites (in
romanian). Ed. Academiei RSR, Bucureşti, România
Choudhury, B.J. (1997). Global pattern of potential evaporation calculated from the
Penman–Monteith equation using satellite and assimilated data. Remote Sens.
Environ, Vol. 61, pp. 64–81, ISSN 0034-4257
Chen, D.; Gao, G.; Xu, C Y. & Ren, G. (2005). Comparison of the Thornthwaite method and
pan data with the standard Penman-Monteith estimates of reference
evapotranspiration in China. Climate research, Vol. 28, pp. 123-132 ISSN 1616-1572
Chuanyana, Z.; Zhongrena, N. & Zhaodonga, F. (2004). GIS-assisted spatially distributed
modeling of the potential evapotranspiration in semi-arid climate of the Chinese
Loess Plateau. Journal of Arid Environments, Vol. 58, pp. 387–403, ISSN 0140-1963
Cleugh, H.A.; Leuning, R.; Mu, Q. & Running, S.W. (2007). Regional evaporation estimates
from flux tower and MODIS satellite data. Remote Sens. Environ, Vol. 106, pp. 285–
304, ISSN 0034-4257
Donciu, C. (1958). Evapotranspiration in the RPR (in romanian). Rev. Hidrotehnica, Vol. 3,
No. 1, pp. 129-135
Donciu, C. (1983). Evapotranspiration and soil water balance (in romanian), Memoriile
Secţiilor Ştiinţifice, Seria IV, tom VI, nr. 2, pp. 347-366, Edit. Acad. R.S.R., Bucureşti
Douglas, E. M.; Jacobs, J. M.; Sumner, D, M. & Ray, R. L. (2009). A comparison of models for
estimating potential evapotranspiration for Florida land cover types. Journal of
Hydrology, Vol. 373, pp. 366–376, ISSN 0022-1694
Eagleman, J. R. (1967). Pan evaporation, potential and actual evaporation, Journal of Applied
Meteorology, Vo. 6, No 3, pp. 482-488, ISSN 1520-0450
Granger, R.J. (1997). Comparison of surface and satellite derived estimates of
evapotranspiration using a feedback algorithm. In: Kite, G.W., Pietroniro, A., Pultz,
T. (Eds.), Applications of Remote Sensing in Hydrology. Proceedings of the
Symposium No. 17 NHRI, Saskatoon, Canada. National Hydrology Research
Institute (NHRI), pp. 21–81.
Hargreaves, G.H. & Samani, Z.A. (1982). Estimating potential evapotranspiration (Tech.
Note). Journal of Irrigation and Drainage Engineering, Vol. 108, No. 3, pp. 225–230,
ISSN 0733-9437
Evapotranspiration – Remote Sensing and Modeling
270
Henning, I. & Henning, D. (1981). Potential evapotranspiration in mountain geo –
ecosystems of different altitudines and latitudes. Mountain Research and Development
Vol. 1, pp. 267-274, ISSN 0276-4741
Irmak, A. & Kamble, B. (2009). Evapotranspiration data assimilation with genetic algorithms
and SWAP model for on-demand irrigation. Irrigation Science, Vol. 28, No.1,
pp.101-112 , ISSN 1432-1319
Köppen, W. (1900). Versuch einer Klassifikation der Klimate, vorzugsweise nach ihren
Beziehungen zur Pflanzenwelt. Geogr. Zeitschr
Kouzmov, K. (2002). Climatic changes in the region of Vidin and their efect on the
agroclimatic resources. Journal of Environmental Protection and Ecology, Vol. 3, No.3,
pp. 126-131, ISSN 1311 – 5065
Kumar, M.; Raghuwanshi, N.S.; Singh, R.; Wallender, W.W. & Pruitt, W.O. (2002).
Estimating evapotranspiration using Artificial Neural Network. Journal of Irrigation
and Drainage Engineering, ASCE 128, pp. 224–233, ISSN 0733-9437
Li, H.; Yan, J.; Yue, X. & Wang, M. ( 2008a). Significance of soil temperature and moisture for
soil respiration in a Chinese mountain area. Agric. Forest. Meteorol, Vol. 148, pp. 490-
503, ISSN 0168-1923
Li, Z.; Wang, Y.; Zhou, Q.; Wu, J.; Peng, J. & Chang, H. (2008b). Spatiotemporal variability of
land surface moisture based on vegetation and temperature characteristics in
Northern Shaanxi Loess plateau, China. Journal of Arid Environments, Vol. 72, pp.
974–985, ISSN 0140-1963
Lioubimtseva, E. & Henebry, G.M. (2009). Climate and environmental change in arid
Central Asia: Impacts, vulnerability and adaptations. Journal of Arid Environments,
Vol. 73. pp. 963–977, ISSN 0140-1963
Lu, J.; Sun, G.; McNulty,S.; & Amatya, D. M. (2005). A comparison of six potential
evapotranspiration methods for regional use in the Southeastern United States.
Journal of the American Water Resources Association (JAWRA) Vol. 41 (3), pp. 621-633,
ISSN 1752-1688
Monteith, J.L. (1965). Evaporation and environment. Symposium of the Society for Experimental
Biology, Vol. 19, pp. 205–224
Moore, I.D. (1996). Hydrologic modeling and GIS. In: Goodchild, et al. (Eds.), GIS and
Environmental Modeling Progress and Research Issues. Donald F. Hemenway Jr., Fort
Collins, pp. 143–149, ISBN 0470-236-779
Nobre, A.M.; Ferreira, J.G; Nunes, J.P; Yan, X; Bricker, S.; Corner, R.; Groom,S.; Gu, H.;
Hawkins, A.J.S.; Hutson, R.; Dongzhao Lan, D.; Lencart e Silva,J.D.; Pascoe,P.;
Telfer, T.; Zhang, X. & Zhu, M. (2010). Assessment of coastal management options
by means of multilayered ecosystem models. Estuarine, Coastal and Shelf Science,
Vol. 87, No. 1, pp. 43-62, ISSN 0272-7714
Oguz, T.; Dippner, J. & Kaymaz, Z. (2006). Climatic regulation of the Black Sea hydro-
meteorological and ecological properties at interannual-to-decadal time scales.
Journal of Marine Systems Vol. 60, No. 3-4, pp. 235–254, ISSN 0924-7963
Oudin, L.; Michel, C. & Anctil, F. (2005a). Which potential evapotranspiration input for a
lumped rainfall–runoff model? Part 1 – Can rainfall–runoff models effectively
handle detailed potential evapotranspiration inputs?. Journal of Hydrology, Vol. 303,
pp. 275–289, ISSN 0022- 1694
Estimation of the Annual and Interannual Variation of Potential Evapotranspiration
271
Oudin, L.; Hervieu, F.; Michel, C.; Perrin, C.; Andreassian, V.; Anctil, F. & Loumagne, C.
(2005b). Which potential evapotranspiration input for a lumped rainfall–runoff
model? Part 2 – Towards a simple and efficient potential evapotranspiration model
for rainfall–runoff modeling. Journ. of Hydr., Vol. 303, pp. 290–306, ISSN 0022-1694
Palutikof, J.P.; Goddes, S.C.M. & Guo, X. (1994). Climate change, potential
evapotranspiration and moisture availability in the Mediterranean Basin.
International Journal of Climatology, Vol. 14 , No. 8, pp. 853-869, ISSN 0899-8418
Penman, H. L. (1946). Natural evaporation from open water, bare soil and grass. Proceedings
of the Royal Society of London. Series A, Mathematical and Physical Sciences, Vol. 193,
No. 1032 (Apr. 22, 1948), pp. 120-145
Ponce, V.M. (1989). Engineering hydrology: principles and practices. John Wiley and Sons,
New York, pp. 48-51, ISBN: 0471147354
Raich, J.W. & Schlesinger, W.H. (1992). The global carbon dioxide flux in soil respiration and
its relationship to vegetation and climate. Tellus Vol. 44B, pp. 81–89, ISSN 1600-0899
Smith, B.A.; McClendon, R.W. & Hoogenboom, G. (2006). Improving air temperature
prediction with Artificial Neural Networks. International Journal of Computational
Intelligence, Vol. 3, No. 3, pp. 179–186, ISSN 0883-9514
Srinivasan, R.; Arnold, J.; Rosenthal, W. & Muttiah, R.S. (1996). Hydrologic Modeling of
Texas Gulf Basin using GIS. In: Goodchild, et al. (Eds.), GIS and Environmental
Modeling Progress and Research Issues, Donald F. Hemenway Jr., Fort Collins, pp.
213–219, ISBN 0470-236-779
Stefano, C.D. & Ferro, V. (1997). Estimation of evapotranspiration by Hargreaves formula
and remotely sensed data in semi-arid Mediterranean areas. Journal of Agricultural
Engineering Research, Vol. 68, pp. 189–199, ISSN 0021-8634
Stewarta, J.B.; Watts, C.J.; Rodriguez, J.C.; De Bruin, H.A.R.; van den Berg, A.R. & Garatuza-
Payan, J. (1999). Use of satellite data to estimate radiation and evaporation for
Northwest Mexico. Agricultural Water Manag., Vol. 38, pp. 181–193, ISSN 0378-3774
Tang, R.L.; Li, Z.L. & Tang, B.H. (2010). An application of the Ts–VI triangle method with
enhanced edges determination for evapotranspiration estimation from MODIS data
in and semi-arid regions: implementation and validation. Remote Sensing of
Environment, Vol. 114, No. 3,pp. 540–551, ISSN 0034-4257
Thornthwaite, C.W. (1948). An approach towards a rational classification of climate.
Geographical Revue,Vol. 38, pp. 55-94
Thomas, A. (2000a). Spatial land temporal characteristics of potential evapotranspiration
trends over China. Inter. Journal of Climatology, Vol. 20, pp. 381-396, ISSN 0899-8418
Thomas, A. (2000b). Climatic changes in yield index and soil water deficit trends in China.
Agricultural and Forests Meteorology, Vol. 102, pp. 71-81, ISSN 0168-1923
Torres, A.F., Walker, W.R. & McKee, M. (2011). Forecasting daily potential
evapotranspiration using machine learning and limited climatic data. Agricultural
Water Management, Vol. 98 , pp.553–562, ISSN 0378-3774
Turc, L. (1954). Calcul du bilan de l'eau evaluation en function des precipitations et des
temperatures. In Association International d'Hydrology, Assemblée Génrale de Rome,
Tome III , No.3, pp. 188–202
Vespremeanu, E. (2000). The Danube Delta tourist map 1:200 000. Ed Amco Press, Bucureşti,
România
Evapotranspiration – Remote Sensing and Modeling
272
Vespremeanu, E. (2004). Geography of the Black Sea, Ed. Univ. din Bucureşti, ISBN 973-575-
925-X, Bucureşti, România
Walter, H. (1955). Die Klimadiagramme als Mittel zur Beurteilung der Klimaverhältnisse für
ökologische, vegetationskundliche und landwirtschaftliche Zwecke. Berichte der
Deutschen Botanischen Gesellschaft Vol. 68, pp. 331-344
Walter, H., & Lieth, H. (1960). Kimadiagramm-Weltatlas, Fischer-Verlag, Jena
Walter, H. (1999). Vegetation und Klimazonen. Grundriß der globalen Ökologie. Ulmer,
ISBN 3-8252-0014-0, Stuttgart, Germania
***Climate of Romania (2008). National Meteorological Administration. Ed. Academiei
Române, Bucureşti, România
13
Evapotranspiration of Partially
Vegetated Surfaces
L.O. Lagos
1,2
, G. Merino
1
, D. Martin
2
, S. Verma
2
and A. Suyker
2
1
Universidad de Concepción Chile
2
University of Nebraska-Lincoln
1
Chile
2
USA
1. Introduction
Latent heat flux equivalent to Evapotranspiration (ET) is the total amount of water lost via
transpiration and evaporation from plant surfaces and the soil in an area where a crop is
growing. Since 80-90% of precipitation received in semiarid and subhumid climates is
commonly used in evapotranspiration, accurate estimations of ET are very important for
hydrologic studies and crop water requirements. ET determination and modelling is not
straightforward due to the natural heterogeneity and complexity of agricultural and natural
land surfaces. In evapotranspiration modelling it is very common to represent vegetation
assuming a single source of energy flux at an effective height within the canopy. However,
when crops are sparse, the single source/sink of energy assumption in such models is not
entirely satisfied. Improvements using multiple source models have been developed to
estimate ET from crop transpiration and soil evaporation. Soil evaporation on partially
vegetated surfaces over natural vegetation and orchards includes not only the soil under the
canopy but also areas of bare soil between vegetation that contribute to ET. Soil evaporation
can account for 25-45% of annual ET in agricultural systems. In irrigated agriculture,
partially vegetated surfaces include fruit orchards (i.e. apples, oranges, vineyards, avocados,
blueberries, and lemons among others), which cover a significant portion of the total area
under irrigation.
In semiarid regions, direct soil evaporation from sparse barley or millet crops can account
for 30% to 60% of rainfall (Wallace et al., 1999). On a seasonal basis, sparse canopy soil
evaporation can account for half of total rainfall (Lund & Soegaard, 2003). Allen (1990)
estimated the soil evaporation under a sparse barley crop in northern Syria and found that
about 70% of the total evaporation originated from the soil. Lagos (2008) estimated that
under irrigated maize conditions soil evaporation accounted for around 26-36% of annual
evapotranspiration. Under rain-fed maize conditions annual evaporation accounted for 36-
39% of total ET. Under irrigated soybean the percentage was 41%, and under rainfed
soybean conditions annual evaporation accounted for 45-47% of annual ET. Massman (1992)
estimated that the soil contribution to total ET was about 30% for a short grass steppe
measurement site in northeast Colorado. In a sparse canopy at the middle of the growing
season, and after a rain event, more than 50% of the daily ET corresponds to directly soil
evaporation (Lund & Soegaard, 2003). Soil evaporation can be maximized under frequent
Evapotranspiration – Remote Sensing and Modeling
274
rainfall or irrigation events, common conditions in agricultural systems for orchard with
drip or micro sprinklers systems. If some of this unproductive loss of water could be
retained in the soil and used as transpiration, yields could be increased without increased
rainfall or the use of supplemental irrigation (Wallace et al., 1999). The measurement and
modelling of soil evaporation on partially vegetated surfaces is crucial to estimate how
much water is lost to the atmosphere via soil evaporation. Consequently, better water
management can be proposed for water savings.
Partially vegetated surface accounts for a significant portion of land surface. It occurs
seasonally in all agricultural areas and throughout the year in or chard and natural land
covers. Predictions of ET for these conditions have not been thoroughly researched. In Chile,
agricultural orchards with partially vegetated surfaces include apples, oranges, avocados,
cherries, vineyards, blueberries, and berries, among others. According to the agricultural
census (INE, 2007) the national orchard surface covers more than 324,000 ha, representing
30% of the total surface under irrigation.
Similar to the Shuttleworth and Wallace (1985), Choudhury and Monteith (1988) and Lagos
(2008) models, the modelling of evapotranspiration for partially vegetated surfaces can be
accomplished using explicit solutions of the equations that define the conservation of heat
and water vapor fluxes for partially vegetated surfaces and soil. Multiple-layer models offer
the possibility to represent these conditions to solve the surface energy balance and
consequently, estimate evapotranspiration. Modelling is essential to predict long-term
trends and to quantify expected outcomes. Since ET is such a large component of the
hydrologic cycle in areas with partially vegetated surfaces, small changes in the calculation
of ET can result in significant changes in simulated water budgets. Thus, good data and
accurate modelling of ET is essential for predicting not only water requirements for
agricultural crops but also to predict the significance of irrigation management decisions
and land use changes to the entire hydrologic cycle.
Currently, several methods and models exist to predict natural environments under
different conditions. More complex models have been developed to account for more
variables affecting model performance. However, the applicability of these models has been
limited by the difficulties and tedious algorithms needed to complete estimations.
Mathematical algorithms used by multiple-layer models can be programmed in a software
package to facilitate and optimize ET estimation by any user. User-friendly software
facilitates the use of these improved methods; users (i.e. students) can use the computer
model to study the behaviour of the system from a set of parameters and initial conditions.
Accordingly, in this chapter, a review of models that estimate ET for partially covered
surfaces that occur normally in agricultural systems (i.e. orchards or vineyards) is presented,
and the needs for further research are assessed.
2. ET modelling review
Evapotranspiration (ET) is the total amount of water lost via transpiration and evaporation
from plant surfaces and the soil in an area where a crop is growing. Traditionally, ET from
agricultural fields has been estimated using the two-step approach by multiplying the
weather-based reference ET (Jensen et al., 1971; Allen et al., 1998 and ASCE, 2002) by crop
coefficients (Kc) to make an approximate allowance for crop differences. Crop coefficients
are determined according to the crop type and the crop growth stage (Allen et al., 1998).
However, there is typically some question regarding whether the crops grown compare
with the conditions represented by the idealized Kc values (Parkes et al., 2005; Rana et al.,
Evapotranspiration of Partially Vegetated Surfaces
275
2005; Katerji & Rana, 2006; Flores, 2007). In addition, it is difficult to predict the correct crop
growth stage dates for large populations of crops and fields (Allen et al., 2007).
A second method is to make a one-step estimate of ET based on the Penman-Monteith (P-M)
equation (Monteith, 1965), with crop-to-crop differences represented by the use of crop-
specific values of surface and aerodynamic resistances (Shuttleworth, 2006). ET estimations
using the one-step approach with the P-M model have been studied by several authors
(Stannard, 1993; Farahani & Bausch, 1995; Rana et al., 1997; Alves & Pereira, 2000; Kjelgaard
& Stockle, 2001; Ortega-Farias et al., 2004; Shuttleworth, 2006; Katerji & Rana, 2006; Flores,
2007; Irmak et al., 2008). Although different degrees of success have been achieved, the
model has generally performed more satisfactorily when the leaf area index (LAI) is large
(LAI>2). Results shows that the “big leaf” assumption used by the P-M model is not
satisfied for sparse vegetation and crops with partial canopy cover.
A third approach consists of extending the P-M single-layer model to a multiple-layer model
(i.e. two layers in the Shuttleworth-Wallace (S-W) model (Shuttleworth-Wallace, 1985) and
four layers in the Choudhury-Monteith (C-M) model (Choudhury & Monteith, 1988).
Shuttleworth and Wallace (1985) combined a one-dimensional model of crop transpiration and
a one-dimensional model of soil evaporation. Surface resistances regulate the heat and mass
transfer in plant and soil surfaces, and aerodynamic resistances regulate fluxes between the
surface and the atmospheric boundary layer. Several studies have evaluated the performance
of the S-W model to estimate evapotranspiration (Farahani & Baush,1995; Stannard, 1993;
Lafleur & Rouse, 1990; Farahani & Ahuja, 1996; Iritz et al. 2001; Tourula & Heikinheimo, 1998;
Anadranistakis et al., 2000; Ortega-Farias et al., 2007). Field tests of the model have shown
promising results for a wide range of both agricultural and non-agricultural vegetation.
Farahani and Baush (1995) evaluated the performance of the P-M model and the S-W model
for irrigated maize. Their main conclusion was that the Penman-Monteith model performed
poorly when the leaf area index was less than 2 because soil evaporation was neglected in
calculating surface resistance. Results of the S-W model were encouraging as it performed
satisfactorily for the entire range of canopy cover. Stannard (1993) compared the P-M, S-W
and Priestley-Taylor ET models for sparsely vegetated, semiarid rangeland. The P-M model
was not sufficiently accurate (hourly r
2
=0.56, daily r
2
=0.60); however, the S-W model
performs significantly better for hourly (r
2
=0.78) and daily data (r
2
=0.85). Lafleur and Rouse
(1990) compared the S-W model with evapotranspiration calculated from the Bowen Ratio
Energy Balance technique over a range of LAI from non-vegetated to fully vegetated
conditions. The results showed that the S-W model was in excellent agreement with the
measured evapotranspiration for hourly and day-time totals for all values of LAI. Using the
potential of the S-W model to partition transpiration and evaporation, Farahani and Ahuja
(1996) extended the model to include the effects of crop residues on soil evaporation by the
inclusion of a partially covered soil area and partitioning evaporation between the bare and
residue-covered areas. Iritz et al. (2001) applied a modified version of the S-W model to
estimate evapotranspiration for a forest. The main modification consisted of a two-layer soil
module, which enabled soil surface resistance to be calculated as a function of the wetness of
the top soil. They found that the general seasonal dynamics of evaporation were fairly well
simulated with the model. Tourula and Heikinheimo (1998) evaluated a modified version of
the S-W model in a barley field. A modification of soil surface resistance and aerodynamic
resistance, over two growing seasons, produced daily and hourly ET estimates in good
agreement with the measured evapotranspiration. The performance of the S-W model was
evaluated against two eddy covariance systems by Ortega-Farias et al. (2007) over a Cabernet
Evapotranspiration – Remote Sensing and Modeling
276
Sauvignon vineyard. Model performance was good under arid atmospheric conditions with a
correlation coefficient (r
2
) of 0.77 and a root mean square error (RMSE) of 29 Wm
-2
.
Although good results have been found using the Shuttleworth-Wallace approach, the model
still needs an estimation or measurement of soil heat flux (G) to estimate ET. Commonly, G is
calculated as a fixed percentage of net radiation (Rn). Shuttleworth and Wallace (1985)
estimated G as 20% of the net radiation reaching the soil surface. In the FAO56 method, Allen
et al. (1998) estimated daily reference ET (ETr and ETo), assuming that the soil heat flux
beneath a fully vegetated grass or alfalfa reference surface is small in comparison with Rn (i.e.
G=0). For hourly estimations, soil heat flux was estimated as one tenth of the Rn during the
daytime and as half of the Rn for the night time when grass was used as the reference surface.
Similarly, G was assumed to be 0.04xRn for the daytime and 0.2xRn during the night time for
an alfalfa reference surface. A more complete surface energy balance was presented by
Choudhury and Monteith (1988). The proposed method developed a four-layer model for the
heat budget of homogeneous land surfaces. The model is an explicit solution of the equations
which define the conservation of heat and water vapor in a system consisting of uniform
vegetation and soil. An important feature was the interaction of evaporation from the soil and
transpiration from the canopy expressed by changes in the vapor pressure deficit of the air in
the canopy. A second feature was the ability of the model to partition the available energy into
sensible heat, latent heat, and soil heat flux for the canopy/soil system.
Similar to Shuttleworth-Wallace (1985), the Choudhury-Monteith model included a soil
surface resistance to regulate the heat and mass transfer at the soil surface. However,
residue effects on the surface energy balance are not included in the model. Crop residue
generally increases infiltration and reduces soil evaporation. Surface residue affects many of
the variables that determine the evaporation rate. These variables include Rn, G,
aerodynamic resistance and surface resistances to transport of heat and water vapor fluxes
(Steiner, 1994; Horton et al., 1996; Steiner et al., 2000).
Caprio et al. (1985) compared evaporation from three mini-lysimeters installed in bare soil
and in a 14 and 28 cm tall standing wheat stubble. After nine days of measurements,
evaporation from the lysimeter with stubble was 60% of the evaporation measured from
bare soil. Enz et al. (1988) evaluated daily evaporation for bare soil and stubble-covered soil
surfaces. Evaporation was always greater from the bare soil surface until it was dry, then
evaporation was greater from the stubble covered-surface because more water was
available. Evaporation from a bare soil surface has been described in three stages. An initial,
energy-limited stage occurs when enough soil water is available to satisfy the potential
evaporation rates. A second, falling rate stage is limited by water flow to the soil surface,
while the third stage has a very low, nearly constant evaporative rate from very dry soil
(Jalota & Prihar, 1998). Steiner (1989) evaluated the effect of residue (from cotton, sorghum
and wheat) on the initial, energy-limited rate of evaporation. The evaporation rate relative
to bare soil evaporation was described by a logarithmic relationship. Increasing the amount
of residue on the soil surface reduced the relative evaporation rate during the initial stage.
Bristow et al. (1986) developed a model to predict soil heat and water budgets in a soil-
residue-atmosphere system. Results from application of the model indicate that surface
residues decreased evaporation by roughly 36% compared with simulations from bare soil.
With the recognition of the potential of multiple-layer models to estimate ET, a modified surface
energy balance model (SEB) was developed by Lagos (2008) and Lagos et al. (2009) to include
the effect of crop residue on evapotranspiration. The model relies mainly on the Schuttleworth-
Wallace (1985) and Choudhury and Monteith (1988) approaches and has the potential to predict
Evapotranspiration of Partially Vegetated Surfaces
277
evapotranspiration for varying soil cover ranging from partially residue-covered soil to closed
canopy surfaces. Improvements to aerodynamic resistance, surface canopy resistance and soil
resistances for the transport of heat and water vapor were also suggested.
2.1 The SEB model
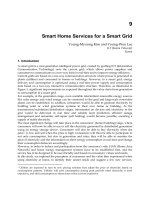
The modified surface energy balance (SEB) model has four layers (Figure 1), the first
extended from the reference height above the vegetation and the sink for momentum within
the canopy, a second layer between the canopy level and the soil surface, a third layer
corresponding to the top soil layer and a lower soil layer where the soil atmosphere is
saturated with water vapor. The soil temperature at the bottom of the lower level was held
constant for at least a 24h period.
The SEB model distributes net radiation (Rn), sensible heat (H), latent heat (E), and soil heat
fluxes (G) through the soil/residue/canopy system. Horizontal gradients of the potentials are
assumed to be small enough for lateral fluxes to be ignored, and physical and biochemical
energy storage terms in the canopy/residue/soil system are assumed to be negligible. The
evaporation of water on plant leaves due to rain, irrigation or dew is also ignored.
The SEB model distributes net radiation (Rn) into sensible heat (H), latent heat (λE), and soil
heat fluxes (G) through the soil-canopy system (Figure 2). Total latent heat (λE) is the sum of
latent heat from the canopy (λEc), latent heat from the soil (λEs) and latent heat from the
residue-covered soil (λEr). Similarly, sensible heat is calculated as the sum of sensible heat
from the canopy (Hc), sensible heat from the soil (Hs) and sensible heat from the residue
covered soil (Hr).
Fig. 1. Fluxes of the surface energy balance model (SEB).
The total net radiation is divided into that absorbed by the canopy (Rnc) and the soil (Rns)
and is given by Rn = Rnc + Rns. The net radiation absorbed by the canopy is divided into
latent heat and sensible heat fluxes as Rnc = λEc +Hc. Similarly, for the soil Rns = Gos + Hs,
Evapotranspiration – Remote Sensing and Modeling
278
where Gos is a conduction term downwards from the soil surface and is expressed as Gos =
λEs + Gs, where Gs is the soil heat flux for bare soil. Similarly, for the residue-covered soil Rns
= Gor + Hr where Gor is the conduction downwards from the soil covered by residue. The
conduction is given by Gor = λEr + Gr where Gr is the soil heat flux for residue-covered soil.
Total latent heat flux from the canopy/residue/soil system is the sum of the latent heat from
the canopy (transpiration), latent heat from the soil and latent heat from the residue-covered
soil (evaporation), calculated as:
λE=λE
+
(
1−fr
)
∙λE
+fr∙λE
(1)
where fr is the fraction of the soil affected by residue. Similarly, the total sensible heat is given by:
H=H
+
(
1−fr
)
∙H
+fr∙H
(2)
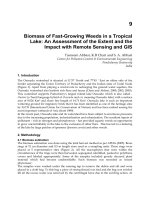
The differences in vapor pressure and temperature between levels can be expressed with an
Ohm’s law analogy using appropriate resistance and flux terms (Figure 2). The sensible and
latent heat fluxes from the canopy, from bare soil and soil covered by residue are expressed
by (Shuttleworth & Wallace, 1985):
H
=
ρ∙c
∙(T
−T
)
r
and
λE
=
ρ∙C
∙(e
∗
−e
)
γ∙(r
+r
)
(3)
H
=
ρ∙C
∙
(
T
−T
)
r
and
λE
=
ρ∙C
∙(e
∗
−e
)
γ∙(r
+r
)
(4)
H
=
ρ∙C
∙(T
−T
)
r
+r
and
λE
=
ρ∙C
∙(e
∗
−e
)
γ∙(r
+r
+r
)
(5)
where, ρ is the density of moist air, C
p
is the specific heat of air, γ is the psychrometric
constant, T
1
is the mean canopy temperature, T
2
is the temperature at the soil surface, T
b
is the
air temperature within the canopy, T
2r
is the temperature of the soil covered by residue, r
1
is
an aerodynamic resistance between the canopy and the air, r
c
is the surface canopy resistance,
r
2
is the aerodynamic resistance between the soil and the canopy, r
s
is the resistance to the
diffusion of water vapor at the top soil layer, r
rh
is the residue resistance to transfer of heat, r
r
is
the residue resistance to the transfer of vapor acting in series with the soil resistance r
s
, e
b
is
the vapor pressure of the atmosphere at the canopy level, e
1
*
is the saturation vapor pressure in
the canopy, e
L
*
is the saturation vapor pressure at the top of the wet layer, and e
Lr
*
is the
saturation vapor pressure at the top of the wet layer for the soil covered by residue.
Conduction of heat for the bare-soil and residue-covered surfaces are given by:
G
=
ρ∙C
∙
(
T
−T
)
r
and
G
=
ρ∙C
∙(T
−T
)
r
(6)
G
=
ρ∙C
∙(T
−T
)
r
and
G
=
ρ∙C
∙(T
−T
)
r
(7)
where; r
u
and r
L
are resistance to the transport of heat for the upper and lower soil layers,
respectively, T
L
and T
Lr
are the temperatures at the interface between the upper and lower
layers for the bare soil and the residue-covered soil, and T
m
is the temperature at the bottom
of the lower layer which was assumed to be constant on a daily basis.
Evapotranspiration of Partially Vegetated Surfaces
279
Choudhury and Monteith (1988) expressed differences in saturation vapor pressure between
points in the system as linear functions of the corresponding temperature differences. They
found that a single value of the slope of the saturation vapor pressure, Δ, when evaluated at
the air temperature, T
a,
gave acceptable results for the components of the heat balance. The
vapor pressure differences were given by:
e
∗
−e
∗
=∆∙
(
T
−T
)
e
∗
−e
∗
=∆∙
(
T
−T
)
e
∗
−e
∗
=∆∙
(
T
−T
)
(8)
and e
∗
−e
∗
=∆∙(T
−T
)
The above equations were combined and solved to estimate fluxes. Details are provided by
Lagos (2008). The solution gives the latent and sensible heat fluxes from the canopy as:
λE
=
∆∙r
∙
R
n
+ρ∙C
∙(e
∗
−e
)
∆∙r
+γ∙(r
+r
)
and
H
=
γ∙
(
r
−r
)
∙
R
n
−ρ∙C
∙(e
∗
−e
)
∆∙r
+γ∙(r
+r
)
(9)
Fig. 2. Schematic resistance network of the Surface Energy Balance (SEB) model a) Latent
heat flux and b) Sensible heat flux.
Evapotranspiration – Remote Sensing and Modeling
280
Similarly, latent and sensible heat fluxes from bare soil surfaces are estimated by:
λE
=
R
n
∙∆∙r
∙r
+ρ∙C
∙
[
(
e
∗
−e
)
∙
(
r
+r
+r
)
+
(
T
−T
)
∙∆∙
(
r
+r
)
]
γ∙
(
r
+r
)
∙
(
r
+r
+r
)
+∆∙r
∙(r
+r
)
(10)
H
=
R
n
∙r
∙∆−λE
∙
[
r
∙∆+γ∙(r
+r
)
]
+ρ∙C
∙(e
∗
−e
)−ρ∙C
∙∆∙(T
−T
)
r
∙∆
(11)
The latent and sensible heat fluxes from the residue-covered soil are simulated with:
λ
E
=
Rn
∙∆∙(r
+r
)∙r
+ρ∙C
∙[(e
∗
−e
)∙(r
+r
+r
+r
)+(T
−T
)∙∆∙(r
+r
+r
)]
γ∙
(
r
+r
+r
)
∙
(
r
+r
+r
+r
)
+∆∙r
∙(r
+r
+r
)
(12)
H
=
Rn
∙r
∙∆−λE
∙r
∙∆+γ∙(r
+r
+r
)
+ρ∙C
∙
(
e
∗
−e
)
−ρ∙C
∙∆∙(T
−T
)
r
∙∆
(13)
Values for T
b
and e
b
are necessary to estimate latent heat and sensible heat fluxes. The
values of the parameters can be expressed as:
e
=T
∙(∆∙A
−A
)+
A
ρ∙C
−∆∙A
∙T
+A
∙e
∗
+T
∙A
+
e
γ∙r
∙
γ∙r
1+A
∙γ∙r
(14)
T
=
B
ρ∙C
+T
∙
1
r
−∆∙B
+
(
e
∗
−e
)
∙B
+T
∙B
∙
r
1−∆∙B
∙r
+B
∙r
(15)
where, r
ah
is the aerodynamic resistance for heat transport, r
aw
is the aerodynamic resistance
for water vapor transport, e
a
is the vapor pressure at the reference height, and e
a
*
is the
saturated vapor pressure at the reference height. Six coefficients (A
1
, A
2
, A
3
and B
1
, B
2
and B
3
)
are involved in these expressions. These coefficients depend on environmental conditions and
other parameters. The expressions to compute the coefficients are given by (Lagos, 2008):
A
=
∆∙r
∙Rn
∆∙r
+γ∙
(
r
+r
)
+
(
1−f
)
∙
Rn
∙∆∙r
∙r
γ∙
(
r
+r
)
∙
(
r
+r
+r
)
+∆∙r
∙
(
r
+r
)
+
f
∙
Rn
∙∆∙(r
+r
)∙r
γ∙
(
r
+r
+r
)
∙
(
r
+r
+r
+r
)
+∆∙r
∙(r
+r
+r
)
(16)
A
=
1
∆∙r
+γ∙
(
r
+r
)
+
(
1−f
)
∙
(
r
+r
+r
)
γ∙
(
r
+r
)
∙
(
r
+r
+r
)
+∆∙r
∙
(
r
+r
)
+
f
∙
(r
+r
+r
+r
)
γ∙
(
r
+r
+r
)
∙
(
r
+r
+r
+r
)
+∆∙r
∙(r
+r
+r
)
(17)
A
=
(
1−f
)
∙
∆∙
(
r
+r
)
γ∙
(
r
+r
)
∙
(
r
+r
+r
)
+∆∙r
∙
(
r
+r
)
+f
∆∙(r
+r
+r
)
γ∙
(
r
+r
+r
)
∙
(
r
+r
+r
+r
)
+∆∙r
∙(r
+r
+r
)
(18)
Evapotranspiration of Partially Vegetated Surfaces
281
B
=Rn
∙
γ∙
(
r
+r
)
∆∙r
+γ∙
(
r
+r
)
+Rn
∙
(
1−f
)
∙
(
1−∆∙r
∙r
∙X
)
+
f
∙
(
1−∆∙
(
r
+r
)
∙r
∙X
)
(19)
B
=
−1
∆∙r
+γ∙
(
r
+r
)
+
(
1−f
)
∙
1
r
∆
−
(
r
+r
+r
)
∙X
+
∙
1
∆
−(
+
+
+
)∙
(20)
B
=
(
1−f
)
∙
−∆∙(r
+r
)∙X
+f
∙
−∆∙(r
+r
+r
)∙X
(21)
X
=
1
γ∙
(
r
+r
)
∙
(
r
+r
+r
)
+∆∙r
∙(r
+r
)
(r
∙∆+γ∙(r
+r
))
r
∙∆
and
X
=
1
γ∙
(
r
+r
+r
)
∙
(
r
+r
+r
+r
)
+∆∙r
∙(r
+r
+r
)
(r
∙∆+γ∙(r
+r
+r
))
r
∙∆
(22)
These relationships define the surface energy balance model which is applicable to
conditions ranging from closed canopies to surfaces with bare soil or those partially covered
with residue. Without residue, the model is similar to that by Choudhury and Monteith
(1988).
2.1.1 Determination of the SEB model parameters
In the following sections, the procedures to compute parameter values for the model are
detailed. The parameters are as important as the formulation of the energy balance
equations.
2.1.1.1 Aerodynamic resistances
Thom (1972) stated that heat and mass transfer encounter greater aerodynamic resistance
than the transfer of momentum. Accordingly, aerodynamic resistances to heat (r
ah
) and
water vapor transfer (r
aw
) can be estimated as:
r
=r
+r
and
r
=r
+r
(23)
where r
am
is the aerodynamic resistance to momentum transfer, and r
bh
and r
bw
are excess
resistance terms for heat and water vapor transfer.
Shuttleworth and Gurney (1990) built on the work of Choudhury and Monteith (1988) to
estimate r
am
by integrating the eddy diffusion coefficient over the sink of momentum in the
canopy to a reference height z
r
above the canopy, giving the following relationship for r
am
:
r
=
1
k∙u
∗
∙Ln
z
−d
h−d
+
h
α∙
K
∙expα∙1−
z
+d
h
−1
(24)
where k is the von Karman constant, u* is the friction velocity, z
o
is the surface roughness, d
is the zero-plane displacement height, K
h
is the value of eddy diffusion coefficient at the top
of the canopy, h is the height of vegetation, and is the attenuation coefficient. A value of
= 2.5, which is typical for agricultural crops, was recommended by Shuttleworth and
Wallace (1985) and Shuttleworth and Gurney (1990).
Evapotranspiration – Remote Sensing and Modeling
282
Verma (1989) expressed the excess resistance for heat transfer as:
r
=
k∙B
k∙u
∗
(25)
where B
-1
represents a dimensionless bulk parameter. Thom (1972) suggests that the product
kB
-1
equal approximately 2 for most arable crops.
Excess resistance was derived primarily from heat transfer observations (Weseley & Hicks
1977). Aerodynamic resistance to water vapor was modified by the ratio of thermal and
water vapor diffusivity:
r
=
k∙B
k∙u
∗
k
D
(26)
where, k
1
is the thermal diffusivity and D
v
is the molecular diffusivity of water vapor in air.
Similarly, Shuttleworth and Gurney (1990) expressed the aerodynamic resistance (r
2
) by
integrating the eddy diffusion coefficient between the soil surface and the sink of
momentum in the canopy to yield:
r
=
h∙exp(α)
α∙
K
∙exp
−α∙z
´
h
−exp
−α∙(d+z
)
h
(27)
where z
o
' is the roughness length of the soil surface. Values of surface roughness (z
o
) and
displacement height (d) are functions of leaf area index (LAI) and can be estimated using the
expressions given by Shaw and Pereira (1982).
The diffusion coefficients between the soil surface and the canopy, and therefore the
resistance for momentum, heat, and vapor transport are assumed equal although it is
recognized that this is a weakness in the use of the K theory to describe through-canopy
transfer (Shuttleworth & Gurney, 1990). Stability is not considered.
2.1.1.2 Canopy resistances
The mean boundary layer resistance of the canopy r
1
, for latent and sensible heat flux, is
influenced by the surface area of vegetation (Shuttleworth & Wallace, 1985):
r
=
r
2∙LAI
(28)
where r
b
is the resistance of the leaf boundary layer, which is proportional to the
temperature difference between the leaf and surrounding air divided by the associated flux
(Choudhury & Monteith, 1988). Shuttleworth and Wallace (1985) noted that resistance r
b
exhibits some dependence on in-canopy wind speed, with typical values of 25 s m
-1
.
Shuttleworth and Gurney (1990) represented r
b
as:
r
=
100
α
∙
w
u
∙1−exp
−α
2
(29)
where w is the representative leaf width and u
h
is the wind speed at the top of the canopy.
This resistance is only significant when acting in combination with a much larger canopy
surface resistance, and Shuttleworth and Gurney (1990) suggest that r
1
could be neglected
Evapotranspiration of Partially Vegetated Surfaces
283
for foliage completely covering the ground. Using r
b
= 25 s m
-1
with an LAI = 4, the
corresponding canopy boundary layer resistance is r
1
= 3 s m
-1
.
Canopy surface resistance, r
c
, can be calculated by dividing the minimum surface resistance
for a single leaf (r
l
) by the effective canopy leaf area index (LAI). Five environmental factors
have been found to affect stomata resistance: solar radiation, air temperature, humidity, CO
2
concentration and soil water potential (Yu et al., 2004). Several models have been developed
to estimate stomata conductance and canopy resistance. Stannard (1993) estimated r
c
as a
function of vapor pressure deficit, leaf area index, and solar radiation as:
r
=C
∙
LAI
LAI
∙
C
C
+VPD
∙
Rad∙(Rad
+C
)
Rad
∙(Rad+C
)
(30)
where LAI
max
is the maximum value of leaf area index, VPD
a
is vapor pressure deficit, Rad
is solar radiation, Rad
max
is the maximum value of solar radiation (estimated at 1000 W m
-2
)
and C
1
, C
2
and C
3
are regression coefficients. Canopy resistance does not account for soil
water stress effects.
2.1.1.3 Soil resistances
Farahani and Bausch (1995), Anadranistakis et al. (2000) and Lindburg (2002) found that soil
resistance (r
s
) can be related to volumetric soil water content in the top soil layer. Farahani
and Ahuja (1996) found that the ratio of soil resistance when the surface layer is wet relative
to its upper limit depends on the degree of saturation (θ/θ
s
) and can be described by an
exponential function as:
r
=r
∙exp−β∙
θ
θ
and r
=
∙
∙∅
(31)
where L
t
is the thickness of the surface soil layer, τ
s
is a soil tortuosity factor, D
v
is the water
vapor diffusion coefficient and ∅ is soil porosity, θ is the average volumetric water content
in the surface layer, θ
s
is the saturation water content, and β is a fitting parameter.
Measurements of θ from the top 0.05 m soil layer were more effective in modeling r
s
than θ
for thinner layers.
Choudhury and Monteith (1988) expressed the soil resistance for heat flux (r
L
) in the soil
layer extending from depth L
t
to L
m
as:
r
=
ρ∙C
∙(L
−L
)
K
(32)
where K is the thermal conductivity of the soil. Similarly, the corresponding resistance for
the upper layer (r
u
) of depth L
t
and conductivity K' as:
r
=
ρ∙C
∙L
K´
(33)
2.1.1.4 Residue resistances
Surface residue is an integral part of many cropping systems. Bristow and Horton (1996)
showed that partial surface mulch cover can have dramatic effects on the soil physical
environment. The vapor conductance through residue has been described as a linear
function of wind speed. Farahani and Ahuja (1996) used results from Tanner and Shen
(1990) to develop the resistance of surface residue (r
r
) as: