Food Production Approaches, Challenges and Tasks Part 15 doc
Bạn đang xem bản rút gọn của tài liệu. Xem và tải ngay bản đầy đủ của tài liệu tại đây (1.36 MB, 16 trang )
Genetic Characterization of Global Rice Germplasm for Sustainable Agriculture
255
explained the genetic diversity in the core collection. Analysis of molecular variance
(AMOVA) showed that 38% of the variance was due to genetic differentiation among the
populations (Table 3). The remaining 62% of the variance was due to the differences
within the populations. The variances among and within the populations were highly
significant (P<0.001).
Source df SS MS Est. Var. % Φ
ST
P-value
a
Among Pops
4 57383 14346 43 38 0.38 <0.001
Within Pops
1781 124086 70 70 62 0.62 <0.001
Total
1785 181470 112 100
a
Probability of obtaining a more extreme random value computed from non-parametric procedures
(1,000 permutations).
Table 3. Analysis of molecular variance (AMOVA) for the 1,763 core accessions and 23
reference cultivars for five populations (Pops) of ARO, AUS, IND, TEJ and TRJ based on 72
DNA markers.
390000
410000
430000
450000
470000
490000
510000
530000
550000
570000
590000
23456789
Number of populations (K)
DIC
0
10000
20000
30000
40000
50000
60000
70000
2345678
Number of populations (K)
Δ
K
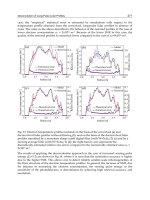
Fig. 6. Five populations should be structured based on both the log-likelihood values
(Deviance Information Criterion, DIC) and the change rate of log-likelihood values (∆K) for
estimated number of populations over 50 structure replicated runs using TESS program.
Where relatively flat change of both DIC and ∆K occurs indicates the most likely number of
populations.
Food Production – Approaches, Challenges and Tasks
256
Among 40 reference cultivars, 20 that are known tropical japonica (TRJ) were classified in K1,
four known temperate japonica (TEJ) in K2, eight known indica (IND) in K3, three known AUS
(AUS) in K4 and five known aromatic (ARO) in K5, indicating the correspondent ancestry of
each population. Based on the references, each accession was clearly assigned to a single
population when its inferred ancestry estimate was 0.6 or larger and admixture between
populations when its estimate was less than 0.6. Admixture was based on proportion of the
estimate, i.e. GSOR 310002 was assigned TEJ-TRJ because of its estimate 0.5227 in K2 and
0.4770 in K1.
K1 or TRJ population included 353 (19.8%) absolute accessions, 41 (2.3%) admixtures with
K2 or TEJ population, 26 (1.5%) admixtures with K3 or IND and one admixture with K4 or
AUS. In K2, 420 (23.5%) accessions had absolute ancestry, 52 (2.9%) admixed with K1 and
seven admixed with other populations. K3 or IND population had 625 (35.0%) accessions
among which 595 were clearly assigned, twelve admixed with K4 or AUS, and 18 admixed
with other populations. One hundred sixty-five (9.8%) accessions were clearly grouped in
K4, 13 were admixed with K3 and two admixed with K5 or ARO population. Seventy-two
(4.0%) accessions were clearly structured in K5, five were admixed with K2 and three
admixed with other population.
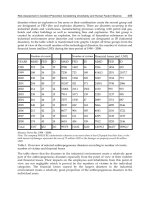
Fig. 7. Principle coodinates analysis of five populations inferred by highlighted reference
cultivars (temperate japonica – TEJ, tropical japonica – TRJ, indica - IND, aus - AUS and aromatic
- ARO) for the core accessions genotyped with 72 DNA markers.
Genetic Characterization of Global Rice Germplasm for Sustainable Agriculture
257
4.3 Genetic relationship and global distribution of ancestry populations
All pair-wise estimates of F
ST
using AMOVA for the populations were highly significant
ranging from 0.240 to 0.517 (Table 4). IND was equally distant from ARO and AUS, but
more distant from TEJ and TRJ. AUS and IND were mostly differentiated from TEJ.
However, TEJ, TRJ and ARO were close to each other in comparison with others. These
relationships were consistent with structure analysis revealed by the PCA (Fig. 7).
ARO AUS IND TEJ TRJ
ARO
0.001 0.001 0.001 0.001
AUS
0.253 0.001 0.001 0.001
IND
0.284 0.308 0.001 0.001
TEJ
0.317 0.517 0.500 0.001
TRJ
0.240 0.475 0.462 0.273
Table 4. Pairwise estimates of F
ST
(lower diagonal) and their corresponding probability
values (upper diagonal) for five rice populations, K5 - aromatic (ARO), K4 - aus (AUS), K3 -
indica (IND), K2 - temperate japonica (TEJ) and K1 - tropical japonica (TRJ) for 1,763 core
accessions genotyped with 72 DNA markers based on 999 permutations.
Among 421 accessions of TRJ rice in the core collection, the majority is collected from Africa
(23%) and South America (21%), followed by Central America (15%), North America (13%),
South Pacific (6%), Southeast Asia and Oceania (5% each) (Fig. 8A). North America had 75
accessions in total and 55 were grouped in TRJ, which was the highest percentage (73%)
among 14 regions, followed by Central America (56%), Africa (49%) and South America
(41%). Among 112 countries, the U.S. in North America had the highest percentage (92%) of
accessions, followed by Cote d’lvoire and Zaire (91%) in Africa and Puerto Rico (72%) in
Central America.
Most TEJ rice is collected from Western and Eastern Europe (20% each), followed by North
Pacific (14%), South America (10%), Central Asia (7%) and North China (7%) (Fig. 8B).
Similarly, Western and Eastern Europe had the highest percentage (85% each) of TEJ, followed
by North Pacific (55%) and South America (20%). Hungary accessions had the highest
percentage (97%), followed by Italy (89%), Russian Federation and Portugal (83% each).
Based on United Nations’ classification, region China includes Mongolia, Hong Kong,
Taiwan and China itself. Most IND rice (25%) is collected from region China, followed by
the South Asia (14%), South America (13%), Southeast Asia and Africa (10% each) (Fig. 8C).
Region China had the highest percentage (72%) of IND, followed by South Pacific (57%),
Southeast Asia (53%), Southern Asia (38%) and Africa (29%). Also, country China had the
highest percentage (84%) of IND, followed by Columbia (81%), Sri Lanka (80%) and
Philippines (68%).
About half of the AUS rice in the collection was sampled from the South Asia (48%),
followed by Africa (16%), Middle East (11%), South America and Southeast Asia (7% each)
(Fig. 8D). South Asia had the highest percentage (40%) of AUS, followed by
Middle East (21%), Africa (14%) and Southeast Asia (10%). Bangladesh had the highest
percentage (63%) of AUS, followed by Iraq (64%), Pakistan (49%) and India (40%).
Food Production – Approaches, Challenges and Tasks
258
Aromatic rice in the collection originated mainly from Pakistan (20%) and Afghanistan
(13%) in the South Asia and Azerbaijan (15%) in Central Asia, representing 37%, 44% and
57% of total core accessions from these countries, respectively (Fig. 8E).
A B
C D
E
Fig. 8. Global distribution of core accessions in each population resulted from cluster
analysis and inferred by reference cultivars based on geographical coordinates of latitude
and longitude in K1 (tropical japonica – TRJ), A; K2 (temperate japonica – TEJ), B; K3 (indica –
IND), C; K4 (aus – AUS), D and K5 (aromatic – ARO), E.
Genetic Characterization of Global Rice Germplasm for Sustainable Agriculture
259
4.4 Genetic diversity of the populations
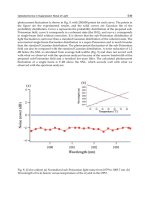
Average alleles per locus were the highest in IND, followed by AUS, ARO, TRJ and TEJ (Fig.
9). IND had 45% more alleles per locus than TEJ. ARO had the highest polymorphic
information content (PIC), followed by AUS, IND, TRJ and TEJ. The PIC value of TEJ was
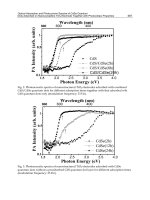
72% less than that of ARO. AUS had the most alleles per locus corrected for difference in
sample size distinctly (Fig. 10A) and privately (Fig. 10B) from others. Although IND and
ARO had same distinct alleles per locus, which was next to AUS, there were much more
private alleles per locus in IND than in ARO. TEJ had either the lowest distinct alleles or
private alleles per locus among the populations.
Genetic characterization of the USDA rice world collection for genetic structure, diversity,
and differentiation will help design cross strategy to avoid sterility for gene transfer and
exchange in breeding program and genetic studies, thus better serve the global rice
community for improvement of cultivars and hybrids because this collection is
internationally available, free of charge and without restrictions for research purposes. Seed
may be requested from GRIN (GRIN, 2011) for the whole collection, and from GSOR (GSOR,
2011) for the core collection.
Fig. 9. Average alleles per locus and polymorphic information content for five populations
resulted from cluster analysis and inferred by reference cultivars K1 (tropical japonica – TRJ),
K2 (temperate japonica – TEJ), K3 (indica – IND), K4 (aus – AUS) and K5 (aromatic – ARO).
5. USDA rice mini-core collection
Development of core collections is an effective tool to extensively characterize large
germplasm collections, and the utilization of a mini-core sub-sampling strategy further
increases the effectiveness of genetic diversity analysis at detailed phenotype and molecular
levels (Agrama et al., 2009). Using the advanced M strategy, Kim et al. (2007) presented
PowerCore software that possesses the power to represent all the alleles identified by
molecular markers and classes of the phenotypic observations in the development of core
collections.
Food Production – Approaches, Challenges and Tasks
260
0
1
2
3
4
5
6
7
8
9
10
2
11
20
29
38
47
56
65
74
83
92
101
110
119
128
137
146
155
164
173
182
191
200
209
218
227
236
245
254
263
272
281
290
299
308
317
326
335
344
353
362
371
380
389
398
Sample size (g )
Mean number of alleles per locus
IND
AUS
ARO
TRJ
TEJ
0
0.1
0.2
0.3
0.4
0.5
0.6
0.7
0.8
0.9
1
1.1
1.2
2
7
12
17
22
27
32
37
42
47
52
57
62
67
72
77
82
87
92
97
102
107
112
117
122
127
132
137
142
147
152
157
162
167
172
177
182
187
192
197
202
207
212
217
222
227
232
Sample size (g )
Mean number of alleles per locus
AUS
IND
TRJ
TEJ
ARO
Fig. 10. The mean number of (A) distinct alleles per locus and (B) private alleles per locus to
each of five populations, K1 (tropical japonica – TRJ), K2 (temperate japonica – TEJ), K3 (indica –
IND), K4 (aus – AUS) and K5 (aromatic – ARO), as functions of standardized sample size g.
5.1 Phenotypic and genotypic data used to develop the USDA rice mini-core
collection
Data of 26 phenotypic traits, 69 SSRs and one indel marker generated from 1,794 accessions
in the USDA rice core collection at Stuttgart, Arkansas, USA were used to develop the mini-
core. The phenotypic traits included 13 for morphology, two for cooking quality, 10 for rice
blast disease resistance ratings from individual races of Magnaporthe oryzae Cav., and one for
physiological disease, straighthead. Field evaluations of blast were conducted at the
University of Arkansas Experiment Station, Pine Tree, AR following inoculation using a
mixture of the most prevalent races (IB-1, IB-49, IC-17, IE-1, IE-1K, IG-1 and IH-1) found in
the southern US rice production region using the method described by Lee et al. (2003). In
greenhouse, seven blast races, IB-1, IB-33, IB-49, IC-17, IE-1K, IG-1, and IH-1 were
individually inoculated and rated in a scale from 0 (no lesions) to 9 (dead).
Distinct alleles
Private alleles
Genetic Characterization of Global Rice Germplasm for Sustainable Agriculture
261
5.2 Sampling strategy and representation analysis
Sampling the core collection was performed by the PowerCore software with an effort to
maximize both the number of observed alleles at SSR loci and the number of phenotypic
trait classes using the advanced M (maximization) strategy implemented through a
modified heuristic algorithm (Agrama et al., 2009). The phenotypic traits were
automatically classified into different categories or classes by the PowerCore program
based on Sturges’ rule = 1 + Log
2
(n), where n is the number of observed accessions (Kim
et al., 2007).
The resulting mini-core was compared with the original core collection to assess its
homogeneity. Nei genetic diversity index (Nei, 1973) was estimated for each molecular
marker in both the core and mini-core collections. Chi-squared (χ
2
) tests were used to test
the similarity for number of marker alleles and frequency distribution of accessions.
Homogeneity was further evaluated for the 26 phenotypic traits using the Newman-Keuls
test for means, the Levene test (Levene, 1960) for variances, and the mean difference
(MD%), variance difference (VD%), coincidence rate of range (CR%) and variable rate of
coefficient of variance (VR%) according to Hu et al. (2000). Coverage of all the phenotypic
traits in the original core collection was estimated in the mini-core as proposed by Kim et
al. (2007):
Coverage (%) =
1
1
100
m
j
Dc
mDe
=
×
Where Dc is the number of classes occupied in the mini-core and De is the number of classes
occupied in the original core collection for each trait and m is the number of traits which is
26 in this case.
5.3 Distribution frequency of accessions in the core and mini-core collections
The heuristic search based on the 26 phenotypic traits and the 70 markers sampled 217
accessions (12.1%) out of 1,794 accessions in the core collection. The 217 mini-core entries
originated from 76 countries covering all the 15 geographic regions (Table 5). Five regions,
Subcontinent, South Pacific, Southeast Asia, Africa and China accounted for the majority,
63.6% of the mini-core entries, while the fewest entries came from three regions, Australia,
Mideast and North America, accounting for 5.5%. Two accessions in the mini-core are of
unknown origin.
The similarity of distribution frequencies between the core and mini-core collections for
each of the 15 regions was tested using χ
2
with one degree of freedom (Table 5). All 15
regions had non-significant χ
2
values ranging from 0.095 to 0.996 with probability (P)
from 0.303 to 0.758, which proved a homogeneous distribution between the two
collections.
Among the 217 mini-core Oryza entries, eight belong to O. glaberrima; two each of O. nivara
and rufipogon; one each of O. glumaepatula, latifolia, and the remaining 203 entries belong to
O. sativa.
Food Production – Approaches, Challenges and Tasks
262
Region USDA Rice Core
collection
Mini-core
χ
2
P
Number % Number %
Africa 198 11.0 24 11.1 0.996 0.318
Australia 24 1.3 1 0.5 0.513 0.474
Balkans 61 3.4 9 4.2 0.786 0.375
Central
America
116 6.5 12 5.5 0.787 0.375
China 208 11.6 20 9.2 0.602 0.438
Eastern
Europe
102 5.7 9 4.2 0.624 0.430
Mideast 91 5.1 5 2.3 0.308 0.579
North
America
71 4.0 6 2.8 0.646 0.422
North Pacific 108 6.0 11 5.1 0.775 0.379
South
America
224 12.5 15 6.9 0.206 0.650
South Pacific 152 8.5 24 11.1 0.558 0.455
Southeast Asia 114 6.4 23 10.6 0.303 0.303
Subcontinent 215 12.0 47 21.7 0.095 0.758
Western
Europe
101 5.6 9 4.2 0.635 0.425
Unknown 9 0.5 2 0.9 0.725 0.725
Total 1794 100 217 100
*χ
2
values with one degree of freedom and the corresponding probability (P).
Table 5. Distribution frequency comparison of origin of accessions between the USDA rice
core and mini-core collections among 15 geographical regions.
5.4 Phenotypic diversity in the core and mini-core collections
Comparative analysis of the ranges, means and variances for 26 phenotypic traits
demonstrated that the mini-core covered full range of variation for each trait. The Newman-
Keuls test results indicate the presence of homogeneity of means between the core collection
and mini-core for 22 traits (85%). Sixteen (62%) of the traits had homogeneous variances
revealed by the Levene’s test. Among the 10 traits having heterogeneous variances, five
morphological traits and amylose content had greater variances in the mini-core than in the
core collection. However, hull cover and color, and two disease traits had smaller variances.
The mean difference percentage (MD%), the variance difference percentage (VD%), the
coincidence rate (CR%) and the variable rate (VR%) are designed to comparably evaluate
Genetic Characterization of Global Rice Germplasm for Sustainable Agriculture
263
the property of core collection with its initial collection. Over the entire 26 phenotypic traits,
the MD% was 6.3%, far less than the significance level of 20%. The VD% was 16.5%, less
than the significance level of 20%, and six traits had much greater variances in the mini-core
than in the core collection (Table 6). The VR% compares the coefficient of variation values
and determines how well the variance is being represented in the mini-core. More than
100% of VR is required for a core collection to be representative of its original collection (Hu
et al., 2000). The mini-core had 102.7% VR over its originating core, indicating good
representation.
USDA Rice Core
Collection
Mini-core Test
1
Range Mean
Vari-
ance
Range Mean
Vari-
ance
N-K Lev
Morphology
Days to flower 42 - 174 95.8 355.5 46 - 166 96.2 469.6 n.s. *
Plant height cm 60 - 212 125.8 627.3 70 - 202 135.7 646.6 ** n.s.
Plant type
2
1 - 9 2.7 2.82 1 - 9 2.7 3.01 n.s. n.s.
Lodging
2
0 - 9 2.3 4.98 0 - 9 3.1 7.71 ** **
Panicle type
2
1 - 9 4.9 1.20 1 - 9 4.8 2.31 n.s. *
Awn type
2
0 - 9 1.2 8.27 0 - 9 2.0 12.56 ** **
Hull cover
2
1 - 6 3.6 1.20 1 - 6 3.7 0.78 n.s. *.
Hull color
2
1 - 8 3.5 3.55 1 - 8 3.7 1.94 n.s. *
Bran color
2
1 - 7 2.3 1.09 1 - 7 2.5 1.75 n.s. *
Kernel length
mm
4.2 -10.0 6.5 0.63 4.2 - 10.1 6.5 0.95 n.s. n.s.
Kernel width
mm
1.5 - 3.5 2.6 0.11 1.5 - 3.5 2.6 0.10 n.s. n.s.
Kernel
Length/Width
2.0 - 5.0 2.6 0.35 2.0 - 5.0 2.6 0.45 n.s. n.s.
1000 kernel
weight g
6.72 -
37.4
21.2 14.76 10 .0 -
37.4
21.0 18.45 n.s. n.s.
Quality
Amylose % 0 - 26.9 19.9 25.57 0.10 –
26.5
10.5 38.46 n.s. *
ASV
2
2.1 - 7 5.1 1.59 2.3 – 7.0 4.9 1.47 n.s. n.s.
Disease
Leaf blast 0 - 9 4.5 7.50 0.3 - 9 4.9 7.88 n.s. n.s.
Early panicle
blast
0 - 9 4.1 8.63 0 - 9 4.1 8.26 n.s. n.s.
Final panicle 0 - 9 5.0 8.00 0 - 9 4.9 8.40 n.s. n.s.
Food Production – Approaches, Challenges and Tasks
264
USDA Rice Core
Collection
Mini-core Test
1
blast
Blast IB-1 0 - 8 4.0 9.24 0 - 8 3.9 8.60 n.s. n.s.
Blast IB-33 0 - 8 6.1 1.7 0 - 8 6.1 1.74 n.s. n.s.
Blast IB-49 0 - 8 5.0 9.27 0 - 8 5.0 8.60 n.s. n.s.
Blast IC-17 0 - 8 4.0 10.58 0 - 8 3.4 9.93 * n.s.
Blast IG-1 0 - 8 4.0 10.68 0 - 8 4.0 9.73 n.s. *
Blast IE-1K 0 - 8 4.3 8.74 0 - 8 4.6 7.75 n.s. *
Blast IH-1 0 - 8 1.8 5.78 0 - 8 2.0 5.45 n.s. n.s.
Straighthead
2
1 - 9 7.3 1.90 1.3 - 9 7 5 1.83 n.s. n.s.
1
Means were tested using Newman-Keuls test (N-K) and variances were tested by Levene’s test (Lev)
for homogeneity between the USDA rice core collection and mini-core, * and ** significant at 0.05 and
0.01 probability, respectively.
2
Categorical data as described in the GRIN (GRIN, 2011).
Table 6. Comparison of range, mean and variance between the USDA rice core collection
and the mini-core for 26 phenotypic traits.
The coincidence rate (CR%) indicates whether the distribution ranges of each trait in the
mini-core are well represented when compared to the core collection. The resulting CR
over the 26 traits was 97.5%, indicating homogeneous distribution ranges of the
phenotypic traits because it was larger than the recommended 80% (Kim et al., 2007). The
calculated Coverage value for the resulting mini-core was 100%, suggesting there is full
coverage of all the diversity present in each class of phenotypic traits in the USDA rice
core collection.
5.5 Molecular diversity in the core and mini-core collections
Both the USDA rice core collection and mini-core contained the same total number of
polymorphic alleles (= 962 alleles) produced by the 70 markers, with an average of 14 alleles
per locus, ranging from two for RM338 to 37 for RM11229 (Fig. 7A). Total alleles per locus
ranged from 2 to 9 for 24 markers, from 10 to 19 for 32 markers and from 20 to 37 for 14
markers. The Nei genetic diversity index values reveal the allelic richness and evenness in
the population. Distributions of the Nei indices among the 70 markers were very similar
between the core and mini-core collections (Fig. 7B). The core collection had an average Nei
diversity index of 0.72 with a minimum of 0.24 for AP5625-1 and maximum of 0.94 for
RM11229 and RM302, while the average was 0.76 with a minimum of 0.37 for RM338 and
AP5625-1 and maximum of 0.95 for RM11229 and RM302 in the mini-core. The minor
difference of the molecular diversity was not statistically significant. Similarly, none of the
70 markers had significantly different Nei diversity index between the core and mini-core
collections, indicated by the χ
2
test with values ranging from 0.000 to 0.022 and probabilities
ranging from 0.882 to 0.999. More than 60% of the markers have a diversity index higher
than 0.60 indicating high diversity across the markers (Fig. 7).
Genetic Characterization of Global Rice Germplasm for Sustainable Agriculture
265
Fig. 7. Distribution of number of alleles per locus and Nei diversity index among the 70
DNA markers in the USDA rice core collection (Core) and mini-core (Mini-core). The
markers were placed according to their potion within the rice genome.
6. Use the USDA rice mini-core collection for mining valuable genes
Demonstrated both phenotypically and genotypically, the USDA rice mini-core collection of
217 entries is a good representative of the core of 1,794 entries as well as the entire rice
global genebank of more than 18,000 accessions in the US (Yan et al., 2007; Agrama et al.,
2009). The vast genetic diversity means the richness of valuable genes that could be
extracted for cultivar improvement (Li et al., 2010). The reasonable number of entries in the
mini-core allows extensively phenotyping and genotyping for mining valuable genes. The
phenotyping could be performed in replicated tests and in multi-locations for the traits that
are largely affected by environments such as yield (Li et al., 2011) and that require large
amount of resources such as biotic and abiotic stresses. The genotyping could be done
A
B
Food Production – Approaches, Challenges and Tasks
266
genome-wide with high density of molecular markers such as simple sequence repeat (SSR)
or single nucleotide polymorphism (SNP), or with sequencing the entire genome. The
reliably phenotyping and densely genotyping genome-wide will improve the efficiency and
accuracy of mining valuable genes for a globally sustainable agriculture. The core and mini-
core collections are managed by the Genetic Stock Oryza Collection (GSOR, 2011) at the
USDA-ARS Dale Bumpers National Rice Research Center and are available to the global
research community.
7. Acknowledgement
The author thanks J.N. Rutger, R.J. Bryant, H.E. Bockelman, R.G. Fjellstrom, M.H. Chen,
T.H. Tai, A.M. McClung, H.A. Agrama, F.N. Lee, M. Jia, T. Sookaserm, T. Beaty, A. Jackson,
L. Bernhardt and Y. Zhou for their assistance to the project
8. References
Agrama H.A., W.G. Yan, F.N. Lee, R. Fjellstrom, M-H. Chen, M. Jia and A. McClung. 2009.
Genetic assessment of a mini-core developed from the USDA rice genebank. Crop
Sci. 49:1336-1346.
Agrama H.A., W.G. Yan, M. Jia, R. Fjellstrom and A.M. McClung. 2010. Genetic structure
associated with diversity and geographic distribution in the USDA rice world
collection. Natural Science 2:247-291.
Agrama, H.A. and W.G. Yan. 2010. Genetic diversity and relatedness of rice cultivars
resistant to straighthead disorder. Plant Breeding 129:304-312.
Bockelman, H.E., R.H. Dilday, W. Yan, and D.M. Wesenberg. 2002. Germplasm collection,
preservation, and utilization. C.W. Smith and R. H. Dilday (eds.) Rice: Origin,
History, Technology, and Production. Crop Production, pp. 597-625. Ser. #6149. John
Wiley & Sons, Inc. New York, NY.
Botstein, D., R.L. White, M. Skolnick, and M.R. Davis. 1980. Construction of a genetic
linkage map in man using restriction fragment length polymorphisms. American J.
of Human Genet. 32:314–331.
Bretting, P.K. 2007. The U.S. national plant germplasm system in an era of shifting
international norms for germplasm exchange. Proc. XXVII IHC-S1 Plant Gen. Reso.
Acta Hort. 760:55-60.
Brown, A.H.D. 1989. Core collections: a practical approach to genetic resources
management. Genome, 31: 818-824.
Caicedo, A.L., S.H. Williamson, R.D. Hernandez, A. Boyko, et al. 2007. Genome-wide patterns
of nucleotide polymorphism in domecticated rice. PloS Genetics 3:1745–1756.
Chen, C., E. Durand, F. Forbes, and O. François. 2007. Bayesian clustering algorithms
ascertaining spatial population structure: A new computer program and a
comparison study. Molecular Ecology Notes 7:747–756.
Excoffier. L., P.E. Smouse, and J.M. Quattro. 1992. Analysis of molecular variance inferred
from metric distances among DNA haplotypes: Application to human mitocondrial
DNA restriction sites. Genetics 131:479-491.
Genetic Characterization of Global Rice Germplasm for Sustainable Agriculture
267
FAO. 1996. Report on the state of the world’s plant genetic resources for food and
agriculture, prepared for the FAO International Technical Conference on Plant
Genetic Resources. FAO Leipzig, Germany, pp 17–23.
Fjellstrom, R.G., W. Yan, M.H. Chen, R.J. Bryant, H. Bockelman, and A.M. McClung. 2006.
Genotypic and phenotypic assessment of the NSGC rice core collection for amylose
content and alkali spreading value. Proc. 31st Rice Technical Working Group
Conference. Feb. 26-Mar. 1, 2006, Houston, TX.
François, O., M.G.B. Blum, M. Jakobsson, and N.A. Rosenberg. 2008. Demographic history of
European populations of Arabidopsis thaliana. PLoS Genetics 4(5): e1000075.
Garris, A.J., T.H. Tai, J. Coburn, S. Kresovich, and S. McCouch. 2005. Genetic structure and
diversity in Oryza sativa L. Genetics 169:1631–1638
Goovaerts, P. 1992. Factorial kriging analysis: a useful tool for exploring the structure of
multivariate spatial soil information. J Soil Sci 43:597–619.
Goudet, J. 1995. Fstat version 1.2: a computer program to calculate F statistics. J of Heredity
86: 485–486.
GRIN, 2011. Germplasm Resources Information Network.
(Verified on September 12, 2011).
GSOR. 2011. Genetic Stock Oryza Cllection.
(Verified on September 12,
2011).
Hamilton, R.S., and R. Raymond. 2005. Toward a global strategy for the conservation of rice
genetic resources. In: Toriyama K, Heong KL, Hardy B (ed) Rice is life: scientific
perspectives for the 21
st
century. Proceedings of the World Rice Research
Conference held in Tsukuba, Japan, CD–ROM, pp 47–49.
Hu, J., J. Zhu, and H.M. Xu. 2000. Methods of constructing core collections by stepwise
clustering with three sampling strategies based on the genotypic values of crops.
Theor. Appl. Genet. 101:264–268.
Izawa, T. 2008. The process of rice domestication: a new model based on recent data. Rice
1:127–134.
Jakobsson, M., and N. A. Rosenberg. 2007. CLUMPP: a cluster matching and permutation
program for dealing with label switching and multimodality in analysis of
population structure. Bioinformatics 23:1801–1806.
Jia, L.M., W.G. Yan, H.A. Agrama, K. Yeater, X.B. Li, B.L. Hu, K. Moldenhauer, A. McClung
and D.X. Wu. 2011. Searching for germplasm resistant to sheath blight from the
USDA rice core collection. Crop Sci. 51:1507-1517.
Kim, K.W., H.K. Chung, G.T. Cho, K.H. Ma, D. Chandrabalan, J.G. Gwag, T.S. Kim, E.G.
Cho, and Y.J. Park. 2007. PowerCore: a program applying the advanced M strategy
with a heuristic search for establishing core sets. Bioinformatics 23:2155–2162.
Kumar, S., K. Tamura, and M. Nei. 2004. MEGA3: Integrated software for Molecular
Evolutionary Genetics Analysis and sequence alignment. Brief Bioinform. 5: 150–
163.
Lee, F.N., W.G. Yan, J.W. Gibbons, M.J. Emerson, and S.D. Clark. 2003. Rice blast and sheath
blight evaluation results for newly introduced rice germplasm. In R.J. Norman, J-F.
Food Production – Approaches, Challenges and Tasks
268
Meullenet (eds.) BR Wells Rice Research Studies 2002. Univ. of Arkansas, Agric.
Exp. Stn., Res. Ser. 504:85–92.
Levene, H. 1960. Robust test for equality of variances. In I. Olkin (ed). Contributions to
probability and statistics: essays in honor of Harold Hotelling. Stanford University
Press, Stanford, pp 278–292.
Li, X.B., W.G. Yan, H. Agrama, B.L. Hu, L.M. Jia, M. Jia, A. Jackson, K. Moldenhauer, A.
McClung and D.X. Wu. 2010. Genotypic and phenotypic characterization of genetic
differentiation and diversity in the USDA rice mini-core collection. Genetica
138:1221-1230.
Li, X.B., W.G. Yan, L.M. Jia, X. Sheng, A. Jackson, K. Moldenhauer, K. Yeater, A. McClung
and D.X. Wu. 2011. Mapping QTLs for improving grain yield using the USDA rice
mini-core collection. Planta, DOI 10.1007/s00425-011-1405-0.
Little, R. R., G. B. Hilder and E. H. Dawson. 1958. Differential effect of dilute alkali on 25
varieties of milled white rice. Cereal Chem. 35: 111-126.
Liu, K., and S.V. Muse. 2005. PowerMarker: integrated analysis environment for genetic
marker data. Bioinformatics 21:2128–2129.
Lynch, M., and B.G. Milligan. 1994. Analysis of population genetic structure with RAPD
markers. Mol. Ecol. 3: 91–99.
McClung, A., M. Chen, H.E. Bockelman, R.J. Bryant, W. Yan, and R. Fjellstrom. 2004.
Characterization of a core collection of rice germplasm and elite breeding lines in
the US with genetic markers associated with cooking quality. Proc. 2nd Int'l Sym.
Rice Functional Genomics, Poster 127, Tucson, AZ, Nov. 15-17, 2004.
McClung, A.M., W. Yan, Y. Jia, F.N. Lee, M.A. Marchetti, and R.G. Fjellstrom. 2006.
Genotypic and phenotypic assessment of the NSGC core collection of rice for
resistance to Pyricularia grisea. Proc. 31st Rice Technical Working Group
Conference. Feb. 26-Mar. 1, 2006, Houston, TX.
Nei, M. 1973. The theory and estimation of genetic distance. In: Morton NE (ed) Genetic
structure of populations, Uni. Press Hawaii, Honolulu, HI, USA: 45–54.
Nei, M. 1978. Estimation of average heterozygosity and genetic distance from a small
number of individuals. Genetics 89:583–590.
NSGC. 2011. National Small Grains Collection. />bin/npgs/html/site_holding.pl?NSGC (verified on August 29, 2011)
Paun, O., J. Greilhuber, E.M. Temsch, and E. Hörandl. .2006. Patterns, sources and ecological
implications of clonal diversity in apomictic Ranunculus carpaticola (Ranunculus
auricomus complex, Ranunculaceae). Mol Ecol 15:897–910.
Peakall, R., and P.E. Smouse. 2006. GenAlEx 6: Genetic analysis in Excel. Population genetic
software for teaching and research. Mol Ecol Notes 6:288–295.
Pérez, C. M., and B.O., Juliano. 1978. Modification of the simplified amylose test for milled
rice. Starch/Stärke, 30: 424-426.
Rice Descripotors. 2011. Multiple Descriptors Query for Rice. />bin/npgs/html/desc_form.pl?75 (Verified on September 12, 2011.
SAS Institute. 2004. SAS/STAT user’s guide. Version 9.1.3 ed. SAS Inst., Cary, NC.
Schneider, S., D. Roessli., and L. Excoffier. 2000. Arlequin: a software for population genetic
data. Genetics and Biometry Laboratory, University of Geneva, Switzerland.
Genetic Characterization of Global Rice Germplasm for Sustainable Agriculture
269
Spiegelhalter, D.J., N.G. Best, B.P. Carlin, and van der Linde A. 2002. Bayesian measures of
model complexity and fit (with discussion). J R Stat Soc B 64:583–639.
Steiner, J.J., P.R. Beuselinck, S.L. Greene, J.A. Kamn, J.H. Kirkbride, and C.A. Roberts. 2001.
A description and interpretation of the NPGS birdsfoot trefoil core subset
collection. Crop Sci. 41: 1968-1980.
Szpiech, Z.A., M. Jakobsson, and N.A. Rosenberg. 2008. ADZE: a rarefaction approach for
counting alleles private to combinations of populations. Bioinfor. 24:2498-2504.
UNSD. 2009. United Nations Statistics Division, Geographic regions and composition.
Venables, W.N. and B.D. Ripley. 1998. Modern Applied Statistics with S+, 2
nd
Edition. New
York: Springer.
Venables, W.N., D.M. Smith and Development Core Team. 2008. Notes on R: A
Programming Environment for Data Analysis and Graphics Version 2.8.1. Vienna:
R Foundation for Statistical Computing.
Wackernagel, H. 1994. Cokriging versus kriging in regionalized multivariate data analysis.
Geoderma 62:83–92.
Webb, B.D. 1972. An automated system of amylose analysis in whole-kernel rice. Cereal Sci.
Today, 30: 284.
Weir, B., and C.C. Cockerham. 1984. Estimating F statistics for the analysis of population
structure. Evolution 38:1358–1370.
Xin, Z., J.P. Velten, M.J. Oliver, and J.J. Burke. 2003. High-throughput DNA extraction
method suitable for PCR. Bio. Techniques 34:820-826.
Yan, W., F.N. Lee, J.Neil Rutger, K.A.K. Moldenhauer, and J.W. Gibbons. 2002. Chinese
germplasm evaluation for yield and disease resistance. R.J. Norman and J F.
Meullenet, (eds.). B.R. Wells Rice Research Studies 2001. pp. 349-358, Univ. of AR,
Agri. Exp. Sta., Res. Ser. 495.
Yan, W., J.Neil Rutger, R.J. Bryant, F.N. Lee, and J.W. Gibbons. 2003. Characteristics of
newly introduced accessions in the USDA-ARS rice quarantine program. R.J.
Norman and J F. Meullenet, (eds.). B.R. Wells Rice Research Studies 2002. pp. 112-
124, Univ. of AR, Agri. Exp. Sta., Res. Ser. 504.
Yan, W., J. Neil Rutger, H.E. Bockelman, and T.H. Tai. 2005a. Agronomic evaluation and
seed stock establishment of the USDA rice core collection. R.J. Norman, J F.
Meullenet and K.A.K. Moldenhauer, (eds.), B.R. Wells Rice Research Studies 2004. pp.
63-68, Univ. of AR, Agri. Exp. Sta., Res. Ser. 529.
Yan, W., J. Neil Rutger, H.E. Bockelman, and T.H. Tai. 2005b. Evaluation of kernel
characteristics of the USDA rice core collection. R.J. Norman, J F. Meullenet and
K.A.K. Moldenhauer, (eds.), B.R. Wells Rice Research Studies 2004. pp. 69-74, Univ. of
AR, Agri. Exp. Sta., Res. Ser. 529.
Yan, W., J. N. Rutger, R.J. Bryant, H.E. Bockelman, R.G. Fjellstrom, M.H. Chen, T.H.Tai, and
A.M. McClung. 2007. Development and evaluation of a core subset of the USDA
rice germplasm collection. Crop Sci. 47:869-878.
Yan, W.G., H. Agrama, M. Jia, R. Fjellstrom and A. M. McClung. 2010. Geographic
description of genetic diversity and relationships in the USDA rice world
collection. Crop Science 50:2406-2417.
Food Production – Approaches, Challenges and Tasks
270
Yang, X.C., and C.N. Hwa. 2008. Genetic modification of plant architecture and variety
improvement in rice. Heredity, 101:396-404.