Project Management Risk and Customer Relationship_10 potx
Bạn đang xem bản rút gọn của tài liệu. Xem và tải ngay bản đầy đủ của tài liệu tại đây (242.11 KB, 29 trang )
Page 338
Extremes
Lowest
Obs Highest Obs
0(
84821) 4577900( 23869)
0(
79629) 4828676( 19189)
0(
74719) 5451884( 69915)
0(
70318) 5745300( 17281)
0(
59675) 9250120( 13742)
Page 339
Age of File
Univariate Procedure
Variable=AGE_FIL
Weight= SMP_WGT
Moments
N
85404
Sum Wgts
729228
Mean
174.3028
Sum
1.2711E8
Std Dev
254.3212
Variance
64679.28
Skewness
.
Kurtosis
.
USS
2.768E10
CSS
5.5238E9
CV
145.9077
Std Mean
0.297818
T:Mean=0
585.2661
Pr>|T|
0.0001
Num ^= 0
85351
Num > 0
85351
M(Sign)
42675.5
Pr>=|M|
0.0001
Sgn Rank
1.8212E9
Pr>=|S|
0.0001
Page 340
Quantiles (Def=5)
100% Max
666
99%
347
75% Q3
227
95%
329
50% Med
169
90%
295
25% Q1
108
10%
52
0% Min
0
5%
31
1%
5
Range
666
Q3
-
Q1
119
Mode
214
Extremes
Lowest
Obs Highest Obs
0(
84242)
619(
84665)
0(
81481)
625(
58765)
0(
80706)
663(
38006)
0(
80589)
666(
10497)
0(
76936)
666(
71596)
TEAMFLY
Team-Fly
®
Page 341
Number of 30-Day Delinquencies
Univariate Procedure
Variable=NO30DAY
Weight= SMP_WGT
Moments
N
85404
Sum Wgts
729228
Mean
0.718138
Sum
523686
Std Dev
5.898548
Variance
34.79287
Skewness
.
Kurtosis
.
USS
3347494
CSS
2971415
CV
821.3675
Std Mean
0.006907
T:Mean=0
103.9667
Pr>|T|
0.0001
Num ^= 0
22303
Num > 0
22303
M(Sign)
11151.5
Pr>=|M|
0.0001
Sgn Rank
1.2436E8
Pr>=|S|
0.0001
Page 342
Quantiles (Def=5)
100% Max
43
99%
10
75% Q3
1
95%
4
50% Med
0
90%
2
25% Q1
0
10%
0
0% Min
0
5%
0
1%
0
Range
43
Q3
-
Q1
1
Mode
0
Extremes
Lowest
Obs Highest Obs
0(
85404)
37(
78590)
0(
85403)
38(
44354)
0(
85402)
38(
47412)
0(
85401)
43(
7285)
0(
85400)
43(
46812)
Page 343
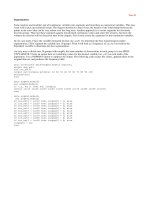
Replacing Missing Values for Income
The first frequency shows the distribution of HOME EQUITY. This is used to create the matrix that displays the mean
INCOME by HOME EQUITY range and AGE Group.
HOMEQ_R
Frequency
Percent
Cumulative
Frequency
Cumulative
Percent
$0-$100K
53723
62.9
53723
62.9
$100-$20
20285
23.8
74008
86.7
$200-$30
7248
8.5
81256
95.1
$300-$40
2269
2.7
83525
97.8
$400-$50
737
0.9
84262
98.7
$500-$60
339
0.4
84601
99.1
$600-$70
213
0.2
84814
99.3
$700K+
590
0.7
85404
100.0
Mean INCOME by HOME EQUITY and AGE Group
Age group
25
-
34
35
-
44
45
-
54
55
-
65
Home Equity
$47
$55
$57
$55
$0-$100K
$100-$20
$70
$73
$72
$68
$200-$30
$66
$73
$76
$68
$300-$40
$70
$80
$84
$76
$400-$50
$89
$93
$94
$93
$500-$60
$98
$101
$102
$97
$600-$70
$91
$105
$109
$104
$700K+
$71
$102
$111
$107
The following regression used INFERRED AGE, HOME EQUITY, CREDIT LINE and TOTAL BALANCES to predict missing values for
INCOME.
Step 0 All Variables Entered R-square = 0.66962678
C(p) = 5.000000000
DF
Sum of Squares
Mean Square
Regression
4
372912001.28200
93228000.320499
43230.8
Error
85315
183983294.99609
2156.51755255
Total
85319
556895296.27809
Parameter
Standard
Type II
Variable
Estimate
Error
Sum of Squares
INTERCEP
36.87607683
0.25721498
44325117.661102
20554.0
INFD_AGE2
0.11445815
0.00602800
777500.06857066
360.54
HOM_EQU2
-
0.00000343
0.00000040
158246.95496857
73.38
CREDLIN2
0.00011957
0.00000120
21410199.091371
9928.14
TOT_BAL2
-
0.00000670
0.00000136
52180.72203473
24.20
Bounds on condition number:
19.28444,
161.5108
Page 345
All variables left in the model are significant at the 0.1000 level.
OBS _MODEL_ _TYPE_ _DEPVAR_ _RMSE_ INTERCEP INFD_AG2
1 INC_REG PARMS INC_EST2 46.4383 36.8761 0.11446
OBS HOM_EQU2 CREDLIN2 TOT_BAL2 INC_EST2
1
-
.0000034348 .00011957
-
.0000067044
-
1
The following print output displays the values for INCOME after regression substitution.
OBS
INC_EST2
INC_EST3
436
.
43.3210
2027
.
44.5382
4662
.
40.2160
5074
.
43.5390
5256
.
41.6833
5552
.
43.1713
6816
.
41.4527
8663
.
62.8130
10832
.
42.3638
11052
.
42.4500
14500
.
41.6961
14809
.
41.2255
15132
.
63.4676
15917
.
41.2685
16382
.
41.8029
16788
.
40.8224
16832
.
34.2062
16903
.
42.0813
17201
.
43.5734
17419
.
42.8501
17540
.
43.9865
17700
.
40.3016
18045
.
42.4653
18147
.
43.5607
18254
.
41.3758
18296
.
41.3878
18362
.
41.5944
18597
.
40.7010
18931
.
51.3921
19058
.
42.4845
20419
.
42.0720
20640
.
40.1936
22749
.
42.1277
23201
.
42.6050
23334
.
42.4007
23651
.
41.7607
24227
.
34.0227
24764
.
39.8351
25759
.
42.0662
continues
Page 346
(Continued)
OBS
INC_EST2
INC_EST3
26608
.
54.4467
30922
.
42.8928
31141
.
41.6508
32963
.
42.6343
32986
.
41.2255
34175
.
41.2114
34702
.
41.6541
35897
.
47.0708
36616
.
42.7077
42978
.
41.3285
44612
.
53.0752
45165
.
43.7436
45959
.
41.1110
46242
.
41.9122
46428
.
41.6833
46439
.
42.5990
47002
.
42.0267
47400
.
41.8678
48237
.
51.3944
49472
.
44.1610
50012
.
41.7293
50059
.
43.1998
50236
.
42.3850
50446
.
42.0642
51312
.
42.6312
52741
.
42.0676
53961
.
42.1993
53972
.
43.8084
54715
.
43.3766
55422
.
44.0192
57848
.
45.8676
59262
.
41.3399
59450
.
41.4544
59512
.
43.7946
59675
.
41.4544
60545
.
46.7328
64254
.
52.3536
66336
.
42.3752
69200
.
43.4159
70318
.
41.5689
72152
.
41.6255
72540
.
42.5443
74479
.
42.8142
75718
.
42.3963
76936
.
42.8469
Page 347
APPENDIX B—
UNIVARIATE ANALYSIS OF CATEGORICAL VARIABLES
In this appendix you will find simple frequencies of the categorical variables discussed in chapter 3.
Categorical Variables
POP_DEN Frequency Percent
Cumulative
Frequency
Cumulative
Percent
143889
19.7
143889
19.7
A
46934
6.4
190823
26.2
B
267947
36.7
458770
62.9
C
270458
37.1
729228
100.0
TRAV_CD Frequency Percent
Cumulative
Frequency
Cumulative
Percent
220060
30.2
220060
30.2
1
509168
69.8
729228
100.0
BANKCRD Frequency Percent
Cumulative
Frequency
Cumulative
Percent
N
40817
5.6
40817
5.6
Y
688411
94.4
729228
100.0
APT_IND Frequency Percent
Cumulative
Frequency
Cumulative
Percent
N
600369
82.3
600369
82.3
Y
128859
17.7
729228
100.0
(table continued on next page)
Page 348
(table continued from previous page)
Categorical Variables
CLUSTR1 Frequency Percent
Cumulative
Frequency
Cumulative
Percent
594
0.1
594
0.1
A1
1854
0.3
2448
0.3
A2
947
0.1
3395
0.5
A3
2278
0.3
5673
0.8
A4
2269
0.3
7942
1.1
B1
1573
0.2
9515
1.3
B2
1306
0.2
10821
1.5
B3
1668
0.2
12489
1.7
B4
1120
0.2
13609
1.9
C1
2518
0.3
16127
2.2
C2
5759
0.8
21886
3.0
C3
404
0.1
22290
3.1
C4
1194
0.2
23484
3.2
D1
59097
8.1
82581
11.3
D2
7114
1.0
89695
12.3
D3
8268
1.1
97963
13.4
D4
14128
1.9
112091
15.4
E1
1614
0.2
113705
15.6
E2
1091
0.1
114796
15.7
E3
13479
1.8
128275
17.6
E4
7695
1.1
135970
18.6
E5
3808
0.5
139778
19.2
F1
878
0.1
140656
19.3
F2
1408
0.2
142064
19.5
F3
1272
0.2
143336
19.7
G1
5459
0.7
148795
20.4
G2
28935
4.0
177730
24.4
G3
33544
4.6
211274
29.0
G4
14517
2.0
225791
31.0
G5
3862
0.5
229653
31.5
H1
41
0.0
229694
31.5
H2
153
0.0
229847
31.5
H3
1550
0.2
231397
31.7
TEAMFLY
Team-Fly
®
H4
1321
0.2
232718
31.9
H5
1757
0.2
234475
32.2
I1
121832
16.7
356307
48.9
I2
24836
3.4
381143
52.3
I3
29429
4.0
410572
56.3
I4
6902
0.9
417474
57.2
I5
65318
9.0
482792
66.2
J1
180767
24.8
663559
91.0
J2
65669
9.0
729228
100.0
(table continued on next page)
Page 349
(table continued from previous page)
Categorical Variables
INC_GRP Frequency Percent
Cumulative
Frequency
Cumulative
Percent
750
0.1
750
0.1
A
566
0.1
1316
0.2
B
12040
1.7
13356
1.8
C
41007
5.6
54363
7.5
D
64095
8.8
118458
16.2
E
82088
11.3
200546
27.5
F
62449
8.6
262995
36.1
G
47412
6.5
310407
42.6
H
40136
5.5
350543
48.1
I
41641
5.7
392184
53.8
J
43885
6.0
436069
59.8
K
43091
5.9
479160
65.7
L
40647
5.6
519807
71.3
M
35647
4.9
555454
76.2
N
30169
4.1
585623
80.3
O
24702
3.4
610325
83.7
P
20056
2.8
630381
86.4
Q
17819
2.4
648200
88.9
R
81028
11.1
729228
100.0
SGLE_IN Frequency Percent
Cumulative
Frequency
Cumulative
Percent
N
627089
86.0
627089
86.0
Y
102139
14.0
729228
100.0
FINL_ID Frequency Percent
Cumulative
Frequency
Cumulative
Percent
A
24293
3.3
24293
3.3
M
11908
1.6
36201
5.0
N
693027
95.0
729228
100.0
HH_IND Frequency Percent
Cumulative
Frequency
Cumulative
Percent
119833
16.4
119833
16.4
H
609395
83.6
729228
100.0
GENDER Frequency Percent
Cumulative
Frequency
Cumulative
Percent
F
293331
40.2
293331
40.2
I
124038
17.0
417369
57.2
M
311859
42.8
729228
100.0
(table continued on next page)
Page 350
(table continued from previous page)
Categorical Variables
SSN_IND Frequency Percent
Cumulative
Frequency
Cumulative
Percent
N
283
0.0
283
0.0
Y
728945
100.0
729228
100.0
DRIV_IN Frequency Percent
Cumulative
Frequency
Cumulative
Percent
A
338410
46.4
338410
46.4
N
333066
45.7
671476
92.1
O
57752
7.9
729228
100.0
MOB_IND Frequency Percent
Cumulative
Frequency
Cumulative
Percent
437608
60.0
437608
60.0
N
246167
33.8
683775
93.8
Y
45453
6.2
729228
100.0
MORTIN1 Frequency Percent
Cumulative
Frequency
Cumulative
Percent
163498
22.4
163498
22.4
M
185182
25.4
348680
47.8
N
78226
10.7
426906
58.5
Y
302322
41.5
729228
100.0
MORTIN2 Frequency Percent
Cumulative
Frequency
Cumulative
Percent
322189
44.2
322189
44.2
M
87986
12.1
410175
56.2
N
175422
24.1
585597
80.3
Y
143631
19.7
729228
100.0
AUTOIN1 Frequency Percent
Cumulative
Frequency
Cumulative
Percent
261487
35.9
261487
35.9
A
135457
18.6
396944
54.4
N
127951
17.5
524895
72.0
Y
204333
28.0
729228
100.0
(table continued on next page)
Page 351
(table continued from previous page)
Categorical Variables
AUTOIN2 Frequency Percent
Cumulative
Frequency
Cumulative
Percent
386914
53.1
386914
53.1
A
57109
7.8
444023
60.9
N
206299
28.3
650322
89.2
Y
78906
10.8
729228
100.0
INFD_AG Frequency Percent
Cumulative
Frequency
Cumulative
Percent
25
13682
1.9
13682
1.9
26
11819
1.6
25501
3.5
27
11137
1.5
36638
5.0
28
12633
1.7
49271
6.8
29
12336
1.7
61607
8.4
30
12522
1.7
74129
10.2
31
15535
2.1
89664
12.3
32
15653
2.1
105317
14.4
33
17603
2.4
122920
16.9
34
18485
2.5
141405
19.4
35
20648
2.8
162053
22.2
36
27641
3.8
189694
26.0
37
29476
4.0
219170
30.1
38
30475
4.2
249645
34.2
39
33801
4.6
283446
38.9
40
32400
4.4
315846
43.3
41
28286
3.9
344132
47.2
42
27794
3.8
371926
51.0
43
26004
3.6
397930
54.6
44
26421
3.6
424351
58.2
45
21694
3.0
446045
61.2
46
24183
3.3
470228
64.5
47
24773
3.4
495001
67.9
48
24662
3.4
519663
71.3
49
24190
3.3
543853
74.6
50
25831
3.5
569684
78.1
51
22334
3.1
592018
81.2
52
19074
2.6
611092
83.8
53
16752
2.3
627844
86.1
54
16067
2.2
643911
88.3
55
15032
2.1
658943
90.4
56
10454
1.4
669397
91.8
57
9350
1.3
678747
93.1
58
8349
1.1
687096
94.2
59
7780
1.1
694876
95.3
60
8172
1.1
703048
96.4
61
7487
1.0
710535
97.4
62
5336
0.7
715871
98.2
63
4489
0.6
720360
98.8
64
4486
0.6
724846
99.4
65
4382
0.6
729228
100.0
(table continued on next page)
Page 352
(table continued from previous page)
AGE_IND Frequency Percent
Cumulative
Frequency
Cumulative
Percent
E
204132
28.0
204132
28.0
F
525096
72.0
729228
100.0
Categorical Variables
DOB_YR Frequency Percent
Cumulative
Frequency
Cumulative
Percent
0000
193460
26.5
193460
26.5
1900
10672
1.5
204132
28.0
1933
4382
0.6
208514
28.6
1934
4486
0.6
213000
29.2
1935
4489
0.6
217489
29.8
1936
5205
0.7
222694
30.5
1937
5074
0.7
227768
31.2
1938
5203
0.7
232971
31.9
1939
5264
0.7
238235
32.7
1940
5668
0.8
243903
33.4
1941
6100
0.8
250003
34.3
1942
7242
1.0
257245
35.3
1943
11260
1.5
268505
36.8
1944
12115
1.7
280620
38.5
1945
12240
1.7
292860
40.2
1946
14302
2.0
307162
42.1
1947
16127
2.2
323289
44.3
1948
15912
2.2
339201
46.5
1949
16367
2.2
355568
48.8
1950
16709
2.3
372277
51.1
1951
17097
2.3
389374
53.4
1952
16767
2.3
406141
55.7
1953
17725
2.4
423866
58.1
1954
18232
2.5
442098
60.6
1955
18541
2.5
460639
63.2
1956
18244
2.5
478883
65.7
1957
19008
2.6
497891
68.3
1958
19885
2.7
517776
71.0
1959
19833
2.7
537609
73.7
1960
18873
2.6
556482
76.3
1961
18967
2.6
575449
78.9
1962
18945
2.6
594394
81.5
1963
17876
2.5
612270
84.0
1964
16903
2.3
629173
86.3
1965
15641
2.1
644814
88.4
1966
14213
1.9
659027
90.4
1967
13757
1.9
672784
92.3
1968
11442
1.6
684226
93.8
1969
10731
1.5
694957
95.3
1970
10476
1.4
705433
96.7
1971
8726
1.2
714159
97.9
1972
7703
1.1
721862
99.0
1973
7366
1.0
729228
100.0
(table continued on next page)
Page 353
(table continued from previous page)
HOMEQ_R Frequency Percent
Cumulative
Frequency
Cumulative
Percent
$0-$100K
449255
61.6
449255
61.6
$100-$20
178739
24.5
627994
86.1
$200-$30
64218
8.8
692212
94.9
$300-$40
20089
2.8
712301
97.7
$400-$50
6650
0.9
718951
98.6
$500-$60
3003
0.4
721954
99.0
$600-$70
1932
0.3
723886
99.3
$700K+
5342
0.7
729228
100.0
Categorical Variables
CHILDIN Frequency Percent
Cumulative
Frequency
Cumulative
Percent
N
577499
79.2
577499
79.2
Y
151729
20.8
729228
100.0
HOMEVLR Frequency Percent
Cumulative
Frequency
Cumulative
Percent
239556
32.9
239556
32.9
C
51
0.0
239607
32.9
D
2135
0.3
241742
33.2
E
12731
1.7
254473
34.9
F
30353
4.2
284826
39.1
G
45397
6.2
330223
45.3
H
52762
7.2
382985
52.5
I
53632
7.4
436617
59.9
J
48610
6.7
485227
66.5
K
42960
5.9
528187
72.4
L
35313
4.8
563500
77.3
M
53132
7.3
616632
84.6
N
34544
4.7
651176
89.3
O
21226
2.9
672402
92.2
P
14080
1.9
686482
94.1
Q
15300
2.1
701782
96.2
R
8364
1.1
710146
97.4
S
5114
0.7
715260
98.1
T
3317
0.5
718577
98.5
U
2340
0.3
720917
98.9
V
8311
1.1
729228
100.0
(table continued on next page)
TEAMFLY
Team-Fly
®
Page 354
(table continued from previous page)
CLUSTR2 Frequency Percent
Cumulative
Frequency
Cumulative
Percent
698544
95.8
698544
95.8
1
2138
0.3
700682
96.1
2
1765
0.2
702447
96.3
3
795
0.1
703242
96.4
4
1999
0.3
705241
96.7
A
9784
1.3
715025
98.1
B
6651
0.9
721676
99.0
C
4710
0.6
726386
99.6
D
2842
0.4
729228
100.0