Sustainable Natural Resources Management Part 4 ppt
Bạn đang xem bản rút gọn của tài liệu. Xem và tải ngay bản đầy đủ của tài liệu tại đây (1.98 MB, 14 trang )
Upstream Landscape Dynamics of
US National Parks with Implications for Water Quality and Watershed Management
31
Measure Source data Years
Spatial
resolution
Reference
Populatio
n
US Census Bureau
2000
Census block
g
roups
US Census Bureau, 2001;
NPS, 2010a
Housin
g
Spatiall
y
Explicit
Regional Growth
Model
(
SERGoM
)
2010
100 m cells
Theobald, 2005; NPS, 2010b
Roads Environmental
Systems Research
Institute (ESRI)
Varies, up
to 2005
Varies
ESRI, 2010; NPS, 2010c
Land cover National Land
Cover Data
(NLCD)
2006
30 m cells
NPS, 2010d; Fr
y
et al., 2011
Conservation
status
Protected Areas
Database of the US
(
PAD-US
)
Varies, up
to 2010
Varies
NPS, 2011a; USGS Gap
Analysis Program, 2011
Table 1. NPScape data sources used to compute the landscape variables (listed in Table 2).
Measure Variable
Units
Comments
Populatio
n
Population densit
y
count/km
2
Based on population totals
Housin
g
Housin
g
densit
y
# units/km
2
Based on mid-points of rural,
exurban, suburban , and urba
n
Rural housin
g
% area
0-6 units/km
2
Exurban housin
g
% area
7-145 units/km
2
Suburban housin
g
% area
146-1,234 units/km
2
Urban housin
g
% area
>1,234 units/km
2
Commercial/industrial
% area
Business –
no
n
-residential
Roads Wei
g
hted road densit
y
km/km
2
Hi
g
hwa
y
wei
g
hted b
y
a factor
of 3, interstates by 10
Land cover Impervious surface
%, area
weighted
Anthropo
g
enic sources onl
y
Developed
% area
Anderson Level I
Developed open space
% area
Anderson Level II
Low intensit
y
development
% area
Anderson Level II
Medium intensit
y
development
% area
Anderson Level II
Hi
g
h intensit
y
development
% area
Anderson Level II
A
g
riculture
% area
Anderson Level I
Cultivated crops
% area
Anderson Level II
Ha
y
/pasture
% area
Anderson Level II
Conservation
status
Protected
% area
Based on Gap Anal
y
sis Pro
g
ram
(GAP) codes 1 and 2
Landowner densit
y
count/km
2
All owners of conservation
lands, including NGO & private
Table 2. NPScape variables used in the present analyses.
Sustainable Natural Resources Management
32
In addition to NPScape variables, we included the percentage of each watershed in private
ownership (derived from USGS Gap Analysis Program, 2011), and we obtained data on
river impoundments and nitrogen (N) deposition. The US National Inventory of Dams
database now contains more than 83,000 records of significant impoundments in US states
and territories (US Army Corps of Engineers, 2010). These impoundments have dramatically
altered hydrological flow regimes, sedimentation processes, inhibited or prevented
biological migrations and other movements, and influenced virtually every ecological
process in some catchments (Ward & Stanford, 1979). Following Sabo et al., (2010) and
Lawrence et al., (2011) we used the density of impoundments (count/km
2
) in the
contributing watershed as an indicator of river fragmentation. A future refinement to our
analyses is to include additional information on the characteristics of dams and their effects
on aquatic resources. For example, watersheds in the eastern US tend to have a higher
density of dams than western watersheds, but because the size of dams varies, the storage
capacity as a portion of annual flow is nearly the same in the east and west (Sabo et al.,
2010). Thus western rivers generally have fewer but larger dams, so fragmentation is greater
in the east but dams in the west alter hydrological dynamics more.
Anthropogenic activities now contribute more nitrogen (N) to the global cycle than all natural
sources combined (Vitousek, 1997). Nitrogen is, or was, a key limiting element in many aquatic
systems, but these limits are now exceeded in many parks (Baron et al., 2011). Baron et al.,
(2011) reviewed studies on N limitations in North American lakes. These studies revealed a
consistent pattern of historical N limitations, especially in nutrient-poor environments typical
of high elevations, and undisturbed temperate and boreal forests. Broad patterns of response
to atmospheric N deposition further supported assertions that the majority of lakes in the
Northern Hemisphere may have been N-limited prior to increased N deposition from
anthropogenic sources. Atmospheric deposition of N has sufficiently altered the balance of N
and Phosphorous (P) so that P limitations are now more commonly observed in North
American lakes. These results emphasize the need to incorporate aspects of global change in
broad-scale studies. Our analyses of N deposition are based on measurement of inorganic N
wet deposition from the National Atmospheric Deposition Program (NADP), corrected for
topographic precipitation differences using PRISM (Parameter-elevation Regressions on
Independent Slopes Model) climate data as described in Baron et al., (2011). These data
underestimate total N deposition because they do not account for dry deposition. We did not
attempt to account for terrestrial runoff or other N inputs.
2.3 Upstream watersheds and the headwater index
Watersheds that are either upstream or downstream with respect to a particular
management unit may be calculated from Digital Elevation Models (DEMs) using GIS
(Djokic & Ye, 1999). The park upstream watersheds considered here were calculated by
NPScape using this basic methodology (NPS, 2011b). However, rather than relying on
source DEM data, NPScape was able to take advantage of published DEM-derived datasets
that serve as standardized pre-processed inputs to watershed calculations: the National
Hydrology Dataset Plus (NHD Plus, 2010) vector flowlines, NHD Plus flow accumulation
rasters, and NHD Plus flow direction rasters. In addition to these inputs, our calculations
required NPS current administrative vector boundaries (NPS, 2011c) to determine pour
points from the flowlines.
Upstream Landscape Dynamics of
US National Parks with Implications for Water Quality and Watershed Management
33
We used these four datasets (flowlines, flow accumulation grids, flow direction grids, and
park boundaries) as inputs to the NPScape ArcGIS watershed toolbox (NPS, 2011b) to
generate upstream catchments for all 261 natural resource parks in the contiguous US. Most
parks had multiple upstream catchments originating from different sets of pour points
around park boundaries. We dissolved catchment boundaries by park to derive final park
upstream watersheds. Importantly, watersheds were computed with respect to the entire
network of parks, meaning that upstream catchments were delineated based on the most
proximate park in the NPS system. This decision was made in order to evaluate the
landscape factors that relate directly to each park. Furthermore, because many parks occur
in major river systems, it helped ensure that upstream watersheds were small enough to be
practical for park management considerations, yet still ecologically relevant when
considered in a larger NPS context.
From these outputs we applied a series of quality-control filters to eliminate park upstream
watersheds with obvious inaccuracies (NPS, 2011b). We eliminated park watersheds where
there were obvious errors with the source NHD Plus data, parks that were too small in
relation to the spatial resolution and mapping accuracy of the source data, and parks that
were in areas with complex hydrography (e.g., coastal, marine). These filters eliminated 110
of the 261 natural resource parks in the contiguous US, leaving a total of 151 focal parks and
their contributing upstream watersheds that were considered in the analyses (Fig. 2).
Fig. 2. Focal parks and upstream watersheds considered in the present analyses. Labelled
parks are referred to in the text. NP = National Park, NRA = National Recreation Area, NMP
= National Military Park, NM = National Monument, NMem = National Memorial, WSR =
Wild and Scenic River.
Sustainable Natural Resources Management
34
We used the park boundaries and upstream watersheds to compute a geometric index of the
degree to which a park includes its own headwaters. The headwater index was calculated by
intersecting each park with its upstream watershed, then dividing that area by the total area of
the upstream watershed. The resulting proportion ranged from zero (i.e., all upstream areas
flowing into the park) to one (i.e., all upstream areas flowing out of the park).
2.4 Water quality variables and data sources
We derived estimates of water quality inside focal parks from two sources: the NPS
Hydrographic and Impairment Statistics (HIS) database (
and the Environmental Protection Agency (EPA) Storage and Retrieval System (STORET; EPA,
2011). The HIS provided data for each park on the total length of waterway (rivers, streams,
canals, etc), as well as the total length of ‘impaired’ waterway identified by states according to
the federal Clean Water Act sections 303(d) and 305(b). We used these two variables to
estimate the percentage of total waterway in each focal park that was impaired (impairment
data were not available for the Rio Grande Wild and Scenic River). In addition, we
downloaded water chemistry data from STORET for the area within a 3 km buffer outside
park boundaries for all parks in this study, restricting the data to observations from 1995-
present, and to samples from rivers/streams, lakes, and reservoirs. Although STORET
provides access to a very large number of chemical and biological variables, we restricted our
analyses to acid neutralizing capacity, ammonia-nitrogen as N, dissolved oxygen, nitrogen-
nitrate, pH, phosphate-phosphorus as P, dissolved solids, and specific conductance.
2.5 Analyses
We used a combination of univariate and multivariate methods to address our starting
questions. Where possible we tried to emphasize univariate approaches, which are
methodologically more intuitive and straightforward to interpret in a management context.
However, because we considered a large number of landscape variables, we also needed a
means to simplify analysis of the many correlated variables. To do so, we used principal
component analysis (PCA) to identify broad orthogonal groupings of variables that
explained most variation in park upstream watershed context. All statistical analyses were
performed in R (R Development Core Team, 2011). Corresponding maps of select results
were produced in ArcMap (ESRI, 2011); all maps are Albers equal area conic, NAD83.
The PCA was conducted using the landscape variables in Table 2, plus mean N deposition and
dam density. Owing to non-normal distributions of the raw variables, arcsine transformations
were first applied to all percentage (proportion) variables, and log transformations were used
on all density variables. We excluded the headwater index from the PCA because we wanted
to evaluate the major factors responsible for landscape-level change and management
response (i.e., human drivers and conservation context) in park upstream watersheds,
irrespective of their relatively static spatial geometries. We used the loadings of each
transformed variable on principal components 1 and 2 (PC1, PC2) to interpret the meaning of
each axis. Park-specific scores on PC1 and PC2 were then evaluated both geographically and
in relation to the headwater index. For the latter, we regressed each principal component
(dependent variable) on the arcsine transformed headwater index in order to explore the
residuals and characterize the management potentials of non-headwater parks.
Upstream Landscape Dynamics of
US National Parks with Implications for Water Quality and Watershed Management
35
For water quality, we used Pearson’s product moment correlation to characterize the
association between the percentage of park waterway impaired (arcsine transformed) and
PC1. We limited this correlation to PC1 because it explained the majority of landscape
variation among park upstream watersheds. Meanwhile, an initial examination of STORET
water quality data revealed implausible observations (outliers) for some variables. To
reduce the effect of outliers in our analyses, we calculated the 95
th
percentile of the
distribution for each variable and then multiplied this value by 3 (P3) and by 20 (P20). We
removed all observations with values greater than P20. For observations with values
between P3 and P20, we changed the observed value to the value of P3 (i.e., we truncated
the distribution to ± P3). To obtain a single value for each variable and each park, we first
calculated the median value of the observation for each site within a specific park area of
analysis. We then calculated the mean of the site-specific medians for that area. We used
linear regression with the park-specific mean values and our predictor variables (i.e., PC1,
PC2, and a subset of NPScape variables in Table 2) to explore relationships between water
quality and landscape attributes. After filtering the STORET data for date, location, and
outliers, our analyses were based on usable data for 29-117 parks (mean = 78).
3. Results and discussion
3.1 What is the general context of park upstream watersheds?
Park upstream watersheds are potentially threatened by a number of landscape-level factors
related to park-watershed geometry, housing development, habitat conversion and resource
extraction, and N deposition (Fig. 3). Of the 151 park upstream watersheds considered, 81%
have more than 50% of their watersheds extending beyond park boundaries, 77% have less
than 50% area formally protected, 61% have greater than 10% rural development, and 37%
have values for N deposition exceeding 3.5 kg N ha
-1
yr
-1
– a conservative critical load for
most parts of the contiguous US (Baron et al., 2011). Taken in combination, these numbers
suggest that most parks do not directly control most of their watersheds, and that both
physical and chemical stressors originating beyond park boundaries will likely affect water
resources inside park boundaries. However, despite these challenges, it is equally
noteworthy that park upstream watersheds are relatively unthreatened by converted land
cover, including high-intensity human land use (Fig. 3). Of the 151 park upstream
watersheds, just 12% are greater than 50% converted land cover, 17% are greater than 10%
developed land cover, and 30% are greater than 10% agricultural land cover.
Several of these patterns merit further discussion. The low-level of protection afforded most
park upstream watersheds is due in large part to the working definition of ‘protected’. We
consider parks and other areas ‘protected’ if they have permanent protection from conversion
of natural land cover and a mandated management plan to maintain a primarily natural state.
This definition follows from the US Geological Survey (USGS) Gap Analysis Program (GAP),
which uses a series of four codes to rank areas based on their level of protection (USGS Gap
Analysis Program, 2011). Our definition is based on GAP status codes 1 and 2 and includes
most parks and all wilderness areas, but it excludes most lands managed by the Bureau of
Land Management (BLM) and US Forest Service (USFS). These two Federal agencies combined
manage approximately 1.8 million km
2
, which irrespective of their use and reduced level of
protection represent significant areas for natural resource conservation. We revisit this subject
below in the context of watershed management opportunities for parks (Section 3.4).
Sustainable Natural Resources Management
36
Fig. 3. Univariate distributions of select landscape variables for upstream contributing
watersheds of 151 National Parks in the contiguous US. Dashed lines show means; dotted
lines show medians.
Upstream Landscape Dynamics of
US National Parks with Implications for Water Quality and Watershed Management
37
Park upstream watersheds are bimodally distributed with respect to N deposition (Fig. 3).
This bimodality is strongly influenced by a combination of longitude and elevation. Based
on critical loads from Baron et al., (2011), all park upstream watersheds in the east exceed the
critical load of 3.5 kg N ha
-1
yr
-1
reported for the northeast; Yosemite, Sequoia, and Kings
Canyon National Parks all exceed the critical load of 1.5 kg N ha
-1
yr
-1
reported for the Sierra
Nevada; and, all parks in the Central Rockies exceed the critical load of 1.0 kg N ha
-1
yr
-1
reported for the Rocky Mountains (Fig. 4). Hence, despite geographic variation in N
deposition across parks in the contiguous US, most park upstream watersheds considered
here have values exceeding critical loads for their respective geographies. Future work is
needed to incorporate more detailed geographic estimates of critical loads for N deposition.
Fig. 4. N deposition in park upstream watersheds, with legend categories reflecting critical
loads described by Baron et al., (2011) for different areas of the US.
Rural development (<7 housing units km
-2
; Theobald, 2005) has already occurred over
extensive areas in most park upstream watersheds, and there is great concern about the rate
of development of rural landscapes around parks (Hansen et al., 2005; Wade & Theobald,
2009; Radeloff et al., 2010). Increases in the extent of low-density housing in previously
undeveloped areas has numerous biological impacts (Hansen et al., 2002, 2005) and housing
development is increasingly recognized as a primary driver of ecological processes and as a
threat to biodiversity (McKinney, 2002; Miller & Hobbs, 2002). In the Greater Yellowstone
Ecosystem, which is threatened by exurban development, riparian habitat, elk winter range,
migration corridors, and other important habitat and biodiversity indices are expected to
experience substantial conversion (between 5% and 40%) by 2020 (Gude et al., 2007). Hence,
this driver will be increasingly important for ongoing and future management of park
watersheds.
Lastly, dam density is characteristically low in most park upstream watersheds (Fig. 3; mean
= 0.02 dams/km
2
), but it is important to note that ecologically relevant thresholds for this
Sustainable Natural Resources Management
38
variable are also low and likely close to this mean for many natural resources, especially
when considered in the context of dam size. For example, a single large dam may affect
water temperatures and benthic communities for hundreds of kilometres downstream
(Baxter, 1977). In addition, higher densities of small dams may have cumulative effects on
physicochemistry and macroinvertebrate diversity that exceed those of large dams (Mantel
et al., 2010). Single dams may also create serious obstacles to the long-range movement of
fish, either upstream (e.g., anadromous salmon) or downstream (e.g., catadromous eels). In
brief, dams have pervasive and varied effects on aquatic resources (Ward & Stanford, 1979),
and the analyses presented here would greatly benefit from an expanded set of ecologically
informative variables and thresholds related to impoundments.
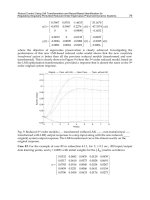
3.2 Which landscape factors explain most variation in park upstream watersheds?
Using the human driver and conservation context variables shown in Figure 3, plus
additional physical landscape variables described under landscape variables and data
sources (Section 2.2), we conducted a PCA to understand which of the 21 landscape factors
explained most of the among-park variation in upstream watershed context. Principal
components 1 and 2 (PC1, PC2) explained 51% and 15% (respectively) of the variation (66%
total). PC1 loaded positively on several variables related to urban development, while PC2
loaded positively on variables related to both agriculture and N deposition, and negatively
on the amount of protected area (Table 3). According to both axes, higher values (denoting
higher urban development, agriculture, and N deposition; less protected area) are associated
with parks east of the Rocky Mountains (Fig. 5). Dam density loaded most strongly on PC4,
but this axis explained only 6% of the variation and is thus not shown.
Variable PC1
PC2
Urban development 0.29
-0.12
Low intensity development 0.29
-0.12
Population density 0.28
0.04
Suburban housing 0.28
-0.14
Urban housing 0.27
-0.12
Medium intensity development 0.27
-0.18
Developed open space 0.27
-0.01
High intensity development 0.26
-0.18
Agriculture 0.17
0.42
Cultivated crops 0.09
0.38
Rural housing -0.04
0.38
Pasture/hay 0.18
0.31
Nitrogen deposition 0.16
0.30
Protected area -0.14
-0.28
Commercial/industrial 0.25
-0.21
Housing density 0.24
0.16
Exurban housing 0.23
0.20
Impervious surface 0.22
-0.08
Weighted road density 0.17
-0.08
Owner density 0.06
-0.13
Dam density 0.13
-0.04
Table 3. Principal component analysis loadings by variable for axes 1 and 2 (PC1, PC2). Values
are grouped on each column to facilitate interpretation of the axes.
Upstream Landscape Dynamics of
US National Parks with Implications for Water Quality and Watershed Management
39
Fig. 5. Principal component scores 1 (A) and 2 (B) shown for park upstream watersheds.
Orange and red colours denote watersheds that have higher PC scores (higher threat), in
units of standard deviations (SD).
A
B
Sustainable Natural Resources Management
40
3.3 What can we infer about the condition of park freshwater resources?
Based on the percentage of impaired waterway, 62%, 64%, and 70% of parks (respectively)
have less than 5%, 10%, and 20% of their total waterways in non-compliance with federal
Clean Water Act sections 303(d) and 305(b) (Fig. 6). However, in this context it is important
to note that ‘impairment’ standards vary by state and are generally less stringent than
critical ecological thresholds in most parks. Furthermore, the sources of waterway
‘impairment’ do not all originate from park upstream watersheds. For these reasons, one
would not a priori expect a substantial amount of among-park variation in waterway
impairment to be explained solely by the landscape dynamics of upstream watersheds. We
find that the percentage of park waterway impaired is positively correlated with PC1, and
that this variable explains approximately 26% of variation.
Fig. 6. The percentage of impaired waterway in focal parks. Note that the summary statistic
was calculated for each park, but results are symbolized here by park upstream watershed
to facilitate comparisons with the other maps.
When compared to ecological threshold values for poor or good water quality (e.g., Van
Sickle et al., 2006; Wazniak et al., 2007; Riva-Murray et al., 2010), water quality in and near
most parks is in a good range. These results reflect the landscape location of most park
watersheds, which tend to include a high portion of natural land cover and a relatively
small area of cropland or intensive development. Using simple regression analyses, we
generally found weak relationships between STORET water chemistry variables and
watershed landscape variables. Certain attributes of the data likely contributed to our
inability to link these factors. We wished to evaluate the ability of large, broad-extent
databases to inform regional and national-scale analyses, and we thus began our analyses
Upstream Landscape Dynamics of
US National Parks with Implications for Water Quality and Watershed Management
41
with approximately 2 million observations. The large number of observations required
automated processes to screen data. For these preliminary analyses, we did not attempt to
correct for factors such as season, variation in sampling effort, or flow regime. Despite the
absence of strong statistical associations between water chemistry and landscape context,
regional patterns were apparent for most of the chemistry variables we examined, such as
phosphate-phosphorus (Fig. 7).
Fig. 7. Concentration of phosphate-phosphorus in focal parks, with legend categories
reflecting conservative critical thresholds described by Van Sickle et al., (2006) for total P.
Note that concentrations were calculated for each park with 3 km buffer, but results are
symbolized here by park upstream watershed in order to facilitate comparisons with the
other maps. Watersheds in light grey denote parks that were not sampled for this metric.
The absence of strong statistical relationships between landscape and water quality
variables in our national-scale assessment indicates the need for more sophisticated analyses
when working at these very broad scales and with generalized databases. Other studies
have found considerably stronger relationships between land cover and water chemistry
(e.g., King et al., 2005; Wickham et al., 2005; Riva-Murray et al., 2010). Our future efforts will
include more sophisticated processes for screening water chemistry data, and additional
analyses. For example, King et al., (2005) evaluated a water quality index based on binary (0,
1) values for predictor variables that were above or below a quality threshold. Their index
was the sum or four predictor variables. The binary transformation effectively addresses
issues with high variance in the predictor variables, and it simplifies estimation and
interpretation of the index. In addition, evaluations of the relative contributions of land
cover versus broad-scale environmental setting to determining water chemistry are
Sustainable Natural Resources Management
42
ambiguous and clearly scale-dependent (e.g., compare King et al., 2005; Wickham et al., 2005;
Goldstein et al., 2007). Our analyses combined all samples for a given park so we could reach
conclusions at the scale of an aggregated park upstream watershed. In some cases, this
procedure merged samples from contributing watersheds that differed dramatically in land
use patterns and threats to small-scale watersheds (e.g., Delaware Water Gap; Gross et al.,
2011). Future analyses of land use effects on park water resources will likely need to resolve
data at a finer spatial scale, perhaps in the form of hierarchical models. An appropriate
management-relevant improvement would be to conduct local and regional-scale analyses
on watersheds upstream of sampling sites, and then extrapolate these results to park
watersheds within relevant ecological regions (Rohm et al., 2002).
3.4 What are the major challenges and opportunities for managing park upstream
watersheds?
Among the 151 focal parks, the big challenges identified by these analyses for managing
park upstream watersheds relate to three major categories: urban development (PC1, Fig.
5A), agriculture and diffuse rural development (PC2, Fig. 5B), and N deposition (Fig. 4).
Habitat fragmentation and alteration due to dams is undoubtedly a fourth major challenge,
but one that we were unable to adequately quantify in this analysis. Nonetheless, the
assessment of landscape context revealed that practically all parks are threatened in their
respective geographies by N deposition, and parks east of the Rocky Mountains are
especially threatened by development and agriculture. Importantly, this is not to say that
parks in the western US are unthreatened by historical changes in land cover and land use.
When compared to eastern parks the upstream watersheds of western parks are not
presently as impacted by these factors, but critical ecological thresholds may still be
exceeded in certain areas (e.g., Porter et al., 2005; Porter & Johnson, 2007). Furthermore,
human population and housing projections suggest that many western parks will be
increasingly challenged by development pressures in the coming decades (Theobald, 2005;
Radeloff et al., 2010).
Fig. 8. Principal component scores 1 (A) and 2 (B), versus the headwater index (arcsine
transformed), for 151 focal park upstream watersheds.
Upstream Landscape Dynamics of
US National Parks with Implications for Water Quality and Watershed Management
43
In the face of these monumental challenges, opportunities for managing park upstream
watersheds are generally positively related to the headwater index – the proportion of the
upstream watershed that exists within park boundaries. Managers of headwater parks
obviously have the greatest direct management control over upstream watershed issues.
Examples in this category include large National Parks in the western US: Yellowstone,
Rocky Mountain, Sequoia and Kings Canyon, Yosemite, and Mount Rainier. In addition,
owing to the strong human land cover and land use variables loading into PC1 and PC2, the
two axes are negatively related to the headwater index (Fig. 8). From these relationships we
can identify particular parks that – based on their headwater index – have characteristically
low values for PC1 or PC2. In effect, these are parks with upstream watersheds that are
relatively unchallenged by human drivers of landscape change, at least considering that
significant portions of their upstream watersheds lie beyond park boundaries. Management
opportunities for these parks lie in working collaboratively with other land owners to
maintain protection of the upstream watershed. Example parks in this regard include
Guilford Courthouse National Military Park (PC1), Chattahoochee River National
Recreation Area (PC1), Effigy Mounds National Monument (PC2), and Arkansas Post
National Memorial (PC2).
Fig. 9. Dominant owners of conservation land in focal park upstream watersheds. NPS =
National Park Service, BLM = Bureau of Land Management, USFS = US Forest Service,
USFWS = US Fish & Wildlife Service, DOD = Department of Defense.
Conservation partnerships are challenging to promote, in part due to varied and sometimes
conflicting missions of the partners, and perhaps also due to an insular history of managing
for resources within ownership boundaries. Nevertheless, partnership opportunities may
Sustainable Natural Resources Management
44
initially be evaluated using a simple landscape metric like the density of landowners that
manage lands for conservation. Although this variable did not emerge as a major factor
explaining among-park variation in watershed context (Table 3), it can be very useful for
particular parks seeking to understand the potential diversity of partners that need to be
engaged, as well as the dominant landowners that control most areas upstream (Fig. 9). The
recognition that neighbouring landowners share a common responsibility for managing
resources in the face of landscape-level anthropogenic change has motivated actions at local
to national scales to form new partnerships. It has also recently stimulated the establishment
of the Department of Interior (DOI) Landscape Conservation Cooperatives (LCCs) and
regional Climate Science Centers (DOI Secretarial Order 3289).
Private lands not held for conservation pose a separate and distinct set of challenges and
opportunities for managing park upstream watersheds. Although not shown in Figure 9,
non-conservation private lands encompass approximately 61% of the US, and they thus
dominate many park upstream watersheds (Fig. 10). While it is challenging to coordinate a
large number of different private landowners, such coordination may be facilitated when
private lands share a common land use. For example, private landowners in an area
dominated by cultivated crops may share problems with ditch erosion (i.e., increased time
and costs with ditch maintenance), which also poses sedimentation challenges to water
resources in a downstream park. Despite different concerns over the threat, there would be
a united interest in identifying creative solutions to the problem. Non-governmental
organizations (NGOs) have traditionally played an especially important role in coordinating
private-public partnerships. Such partnerships may also be promoted through newly
established LCCs.
3.5 Next steps
There are several important ways to build upon the analyses presented here. To evaluate a
wider range of anthropogenic landscape stressors and pollutants, it is important to consider
other areas of analysis besides upstream watersheds. Other ecologically informative areas of
analysis could include downstream watersheds, ecoregions, or a local area that is proximate
to the management unit (e.g., 30 km buffer or a protected area centered ecosystem, PACE;
Hansen et al., 2011). Using these varied areas of analysis would extend our framework to
consider other water quality response variables that are affected by pollutants that traverse
the landscape in different ways. In addition to new water resource response variables, it
would also be useful to extend the analyses to consider point source drivers and their spatial
proximity to parks based on flow length. However, given that these can vary so
dramatically by geography, both in terms of point source type and magnitude, the
explanatory power of these additional landscape predictors may prove most useful in
analyses of parks at local to regional scales. Beyond the human drivers and conservation
context of park upstream watersheds considered here, future analyses need to explicitly
consider the ecological benefits and buffering potentials of natural systems. While some of
these variables – like the percentage of natural land cover types – will be inversely
correlated with many of the landscape stressors (e.g., percentage urban, percentage
agriculture), others related to landscape pattern (Riitters et al., 1995, 2007, 2009a, 2009b) and
habitat connectivity (Hilty et al., 2006; Theobald, 2006; Goetz et al., 2009; Galpern et al., 2011)
will provide key management insights at local to regional scales.