Báo cáo nghiên cứu nông nghiệp " Agriculture Sector Research Priorities and Investment Framework 2011-2015 " pptx
Bạn đang xem bản rút gọn của tài liệu. Xem và tải ngay bản đầy đủ của tài liệu tại đây (500.21 KB, 17 trang )
Collaboration for Agriculture and Rural Development (CARD) Program
Ministry of Agriculture &
Rural Development
Agriculture Sector Research
Priorities and Investment Framework
2011-2015
Priority Setting Workshop
Hanoi
December 2010
Agriculture Sector Research Priorities
i
TABLE OF CONTENTS
1 Introduction 1
2 Methodology 3
2.1 Research Priority Framework 3
2.2 Pre-Workshop Preparation 4
2.2.1 Organisation and Planning 4
2.2.2 Training in Priority Setting Methodology 4
2.2.3 Agriculture Research Opportunity Areas & Resource Material 4
2.2.4 Data & Evaluation Sheets and Workshop Instructions 5
2.3 Workshop Format 5
2.3.1 Workshop Venues and Format 5
2.3.2 Workshop Chairpersons and Group Facilitators 5
2.3.3 Workshop Process 5
3 Workshop Results 6
3.1 Return on Investment 6
3.1.1 Comment 6
3.2 Attractiveness 7
3.2.1 Comment 7
3.3 Feasibility 8
3.3.1 Comment 8
4 Interpretation of Results 9
4.1 Limitations of Results 9
5 Investment Portfolio 10
5.1 Cross Sub-Sectors 10
5.2 Across and Within Sub-Sectors 12
6 The Next Steps 12
Attachments
1. Agriculture Sector Research Priority Setting Workbook
2. PowerPoint Presentations
Agriculture Sector Research Priorities
1
1 Introduction
The Government of Vietnam’s (GoV) Socio-Economic Plan outlines the government’s
expectations for agriculture and rural development. The Agriculture Sector GDP in 2009 was
220 trillion VND, approximately 18% of total GDP. Agriculture's share of GDP has steadily
declined GoV and while the GDP increased by 5.3% during 2009, the agriculture GDP increased
by only 1.8%. Never-the-less government expects GDP growth in the agriculture sector to
increase annually by 3 – 5 %.
Research intensity
1
in Vietnam is less than 0.2% which is lower that most developing countries
of 0.5% and much lower than developed country average of 1.5%. GoV has targeted a 12%
increase of central government funding levels from 2006 – 2011 and to date total funding
increases in agricultural research funding have exceeded that level. MARD research funding
provides approximately 65% of all forms of local funding in Vietnam. Provincial budget provide
the bulk of the remaining 35%, but as GoV policies of decentralistion are further implemented it
is expected that both the total funding (Central & Provincial) will significantly increase and the
proportion of total funds sourced from Provincial budgets will also increase.
In spite of these increases, in real terms the budget has effectively kept pace with inflation.
Currently the use of Cost Norms for determining research project budgets is a major constraint.
Although these norms perhaps enable support for a greater number of research projects they have
restrict the scope, size and impact of research. Planned reforms in research funding are likely to
see research costs becoming more market related and the cost of salaries included in the budgets
of research proposals. Both these factors mean that even if funding continues to grow at 12% per
year, research intensity will not change much and funds for agricultural research will remain
very scarce and still well below that of other developing countries.
At the moment research funding decisions follow a traditional approach with incremental funds
based on funding from the previous year. Changes in the proportion of budget allocated to
different subsectors change by only small amounts (1 - 3%) over one or more years. In the past
most research was focused on the crop sector (mainly rice) for obvious food security reasons.
However as the agriculture sector is now expected to become more competitive (both for local
and export markets) research fund allocation based on historical allocations may not result in
effective use of limited resources (funds, human resources, facilities) for research.
This situation makes it imperative that MARD reviews its allocation of research budget based on
a research priority framework and through a consultative approach with key stakeholders.
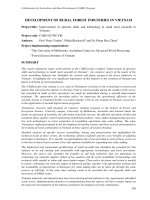
The MARD Investment framework for the period 2006 – 2011 is shown in Figure 1.32% of total
funding is for the Crops-Plant Protection sector but most Agriculture and Post-Harvest
Technology research is also focused on the crop sector meaning in reality 36% of funding
support is for this sector. It is perhaps surprising that investment in the fisheries and livestock
sub-sectors is less than for forestry and that investment in economic and environmental research
is as low as it is. One of the objectives of the Agriculture Sector Priority Setting Workshop is to
determine if the current resource allocation is correct, or if modification is justified based on an
objective, criterion based assessment of priorities.
Figure 1
1
Research intensity = public sector expenditure on agricultural research as proportion of agricultural GDP
Agriculture Sector Research Priorities
2
The CARD program received approval from the Program Coordinating Committee and support
from AusAID contract amendments to assist STED to develop methodologies for research
priority setting as a guide to revising its agriculture research investment framework. From 2006 –
2009 CARD assisted in facilitating workshops to determine priorities in the Crops, Livestock,
Forestry, Fisheries and Economic and Policy sub-sectors.
Using the established methodologies a final workshop was facilitated to prioritize the agriculture
sector. This workshop had the following objectives:
To assist MARD to develop mechanisms for determining agriculture research priorities as a
basis for investment decisions for high priority opportunities for agriculture research
programs and projects across all areas of the agriculture sector.
To prepare a draft set of research priorities the agriculture sector using objective and
subjective data and information and results of previous priority setting workshops at the
subsector level.
Agriculture Sector Research Priorities
3
This report details the methodology and results obtained from the Agriculture Sector (Crops,
Livestock, Forestry & Fisheries Sub-sectors) at the ASEAN Resort, Huyen Thac That, Hanoi on
December 14
th
2010.
2 Methodology
2.1 Research Priority Framework
Priority analysis is based on a criterion based analytical framework
2
, which has been adapted to
conditions in different developing countries. The conceptual framework is shown in Figure 2.
Figure 2 Research Priority Framework
The Methodology was detailed in a Workshop Workbook (Attachment 1) which also included
inputs from key authors on the contribution of each of the four subsectors to the economic, social
and environmental well-being in Vietnam.
The workshop aim was to create ownership through developing a consensus between users and
providers of research for the research priorities. Nearly sixty stakeholders, representing
researchers and research managers, extension workers, universities and the private sector
enterprise and researchers participated in the workshop.
The workshop process required individual participants to score each of the four subsectors for
each of the 4 criteria (Potential Benefits, Ability (or constraints) to Capture Benefits, Research
Potential and Research Capacity) before they attended the workshop. Working groups,
facilitated by trained facilitators discussed the reasons behind individual priority scores and each
participant was invited to rescore if they desired. Individual Scoring Sheets were collected and
entered in an EXCEL Spreadsheet.
2
Foster, R.N., Linden, L.H., Whiteley, R.L., and Kantrow, A.M., Improving the Return on R & D, in ‘Measuring
and Improving the Performance and Return on R & D’ IRI, New York (originally published in Research
Management January 1985.
Agriculture Sector Research Priorities
4
2.2 Pre-Workshop Preparation
2.2.1 Organisation and Planning
MARD established a Research and Development Priority Setting Working Group (WG)to assist
in the development of methodologies and processes that could be applied across all sub-sectors
of the Primary Sector (Agriculture, Forestry, Fisheries and Livestock). The sub-sectors for
research were expanded to include Economic and Policy Research. The WG’s task was to
provide the authority and direction for establishment of agricultural research priorities. A
workshop outlining the priority setting process was presented to the WG and individual WG
members undertook to promote the process and facilitate and chair priority setting workshops.
2.2.2 Training in Priority Setting Methodology
MARD established a Monitoring and Evaluation Network (M&EN). The M&EN consisted of
staff from the Science, Technology and Environment Department (STED) and staff from
research institutes with responsibility for monitoring and evaluation. Two workshops were
completed with the M&EN and at the conclusion of these workshops 12 M&EN members had
demonstrated their understanding of the methodology. M&EN members facilitated priority
setting planning workshops and provided group facilitation services at national priority setting
workshops. In the Economic & Policy Research Opportunities, additional staff from IPSARD
were trained to gain an understanding of the methodology and their contribution as leaders of
workshop working groups.
2.2.3 Agriculture Research Opportunity Areas& Resource Material
An agreement with STED resulted in four Areas of Research Opportunity (AROs) being
evaluated. These were:
ARO 1: Crops (or Cultivation) including: Rice, Upland Crops, Legumes,
Industrial Crops, Fruit, Vegetables, Flowers & Ornamentals, Animal
Feeds and New Crops
ARO 2: Livestock including: Large Animals, Small Ruminant Animals, Pig
Production, Poultry, Productive Insects, Veterinary Vaccines & Animal
Remedies, and Animal Feed Processing & Conservation
ARO 3: Forestry including: Large Timber Production, Pulp and Small Log Products,
Bamboo and Rattan, Non Timber Forest Products, Bio-diversity and
Conservation, Environment and Services, and Forest Policy
ARO 4: Fisheries including: Marine Finfish, Cold Water Fish, Crustaceans,
Molluscs, Fresh Water Fish, Post-Harvest, Processing & Value Adding,
Extraction of Bio-Active Compounds, Resource Management &
Conservation, and Mechanisation
Terms of Reference were prepared for development of resource material for the workshop and
incorporation into workbooks. Contracts based on these Terms of Reference and for presentation
of working papers at the workshop were signed for the following inputs.
Agriculture Sector Research Priorities
5
Table 1. Working Papers for Priority Setting Workshop
Topic Institute Key Author
Economic/Production and Market Statistics/ IPSARD Phan Van Dan
Crops VAAS Nguyen Van Bo
Livestock STED Nguyen Viet Hai
Forestry STED Trieu Van Hung
Fisheries RIA1 Le Thanh Luu
2.2.4 Data & Evaluation Sheets and Workshop Instructions
Research Priority Setting Methodology and sub-sector discussion papers were edited and
incorporated into a Workbook which was distributed to workshop participants prior to the
workshop. Each workshop participant was asked to read all workshop material and make a
preliminary score for each of the four evaluation criteria.
2.3 Workshop Format
2.3.1 Workshop Venues and Format
One workshop was facilitated at the ASEAN Resort, Huyen Thac That, Hanoi on December
14
th
2010.
2.3.2 Workshop Chairpersons and Group Facilitators
Dr Nguyen Van Bo (VASS), as a result of unforeseen unavailability of Dr Hung (STED)
undertook the responsibility for chairing the Priority Setting Workshop. Mr Keith Milligan
(CARD Program) facilitated the workshop.
Workshop Working Group facilitators were:
1. Vu Chi Cuong: Animal Husbandry Research Institute
2. Pham Duc Chien, Forestry Research Institute
3. Ngo Doan Dam, Food Crops Research Institute
4. Nguyen Kim Chien, DSTE
5. Do Xuan Lan, DSTE
2.3.3 Workshop Process
The workshop followed the following steps:
1. Workshop format and process outlined, including a brief description of the methodology
and an outline of the priority framework
2. Presentation by each key author of the working papers outlined in Table 1.
3. Detailed description of the Potential Benefit evaluation criteria including the key
assessment issues
4. Preliminary scoring for Potential Benefits for each ARO by each workshop participant
5. Working group discussion on reasons for high and low scores for Potential Benefits and
reassessment of preliminary scores by each participant
6. Collection of individual scoring sheets and entry of individual scores for Potential Benefit
for each ARO.
7. Repetition of steps 2 – 5 for each of the remaining evaluation criteria (Ability to Capture,
Research Potential and Research Capacity
Agriculture Sector Research Priorities
6
8. Presentation of workshop results to participants
3 Workshop Results
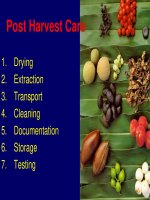
3.1 Return on Investment
Return on investment is the product of attractiveness and feasibility. The relative return on
investment in each area of research opportunity is summarised below
Figure 3: Return on Investment in Agricultural Research
1 = Crops: 2 = Livestock 3 = Forestry 4 = Fisheries
3.1.1 Comment
The main points arising from the workshop’s Return on Investment assessment are:
• ARO 1 (Crops) has the highest return on investment. The Crops sub-sector has both the
highest attractiveness and highest feasibility. This means that investment in the Crops
sub-sector should be higher than for each of the other 3 sub-sectors.
• The Fisheries sub-sector is highly attractive, but feasibility is lower. Some of this lower
feasibility is a function of a lower capacity and improving fisheries research capacity is
likely to provide greater gains than capacity improvement in each of the other three sub-
sectors.
• The Livestock sub-sector is less attractive than Crops or Fisheries and has moderate
feasibility. The return on additional investment in livestock is likely to be lower that the
Crops and Fisheries sub-sectors.
• The Forestry sub-sector scores the lowest on both attractiveness and feasibility and this
suggests that return on investment is likely to be lowest.
Agriculture Sector Research Priorities
7
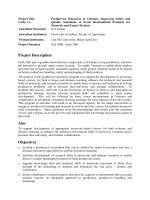
3.2 Attractiveness
Attractiveness is a realistic estimate of the relative benefits likely to be achieved. It is assessed
by plotting ARD Potential Benefits to Vietnam against the Ability to Capture those benefits
(Likelihood of Uptake). The Figure below summarises the scores provided by individual
participants at the workshop.
Figure 4: Attractiveness
1 = Crops: 2 = Livestock 3 = Forestry 4 = Fisheries
3.2.1 Comment
The main points arising from the workshop’s Attractiveness assessment are:
• AROs 1 & 4 (Crops and Fisheries) were assessed as having high potential benefits. This is
not surprising as both sub-sectors have a significant contribution to agriculture GDP and to
export earnings.
• ARO 3 – Forestry was considered to have the lowest potential benefit. This probably
reflects the contribution that forestry makes to agriculture GDP. However it is possible
that the social and environmental contribution that Forestry makes to rural community
well-being was discounted by workshop participants.
• Forestry was also scored lowly on the likelihood of uptake. This is understandable in that
trees take a long time to provide financial benefits and the drivers for change are not as
strong.
• Interestingly livestock was considered to have lower uptake than fisheries and crops. From
discussion during the workshop one possible reason for this is that small scale household-
based livestock production (especially pigs and beef cattle) is seen as high risk, with major
Agriculture Sector Research Priorities
8
disease risks. Scaling up to semi- or commercial production involves significant
investment in infrastructure (housing, waste treatment and disposal etc.) and also probably
requires increasing proportions of feed to be sourced from outside the household.
Investment costs, risks and time to generate income also act as an inhibitor to change.
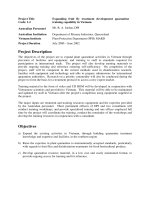
3.3 Feasibility
Relative feasibility is a realistic estimate of the likely contribution research would make to
achieve the potential impact. It is determined by plotting research and development potential
against research and development capacity. The Figure below summarises the workshop results.
Figure 5: Feasibility
1 = Crops: 2 = Livestock 3 = Forestry 4 = Fisheries
3.3.1 Comment
The main points arising from the workshop’s Feasibility assessment include:
R&D Potential
• The workshop assessment was that the research potential of the Crops and Livestock sub-
sectors was similar and higher than the research potential of the fisheries and forestry sub-
sectors.
• The difference in research potential between all four sub-sectors is not great. Differences
in research potential can relate to the complexity of research problems or opportunities and
may also relate to a view that on-going development of the sub-sector is constrained by
issues other than those where research may have a contribution. For example in the
forestry sub-sector issues related to land use, or remoteness of forest lands from markets,
Agriculture Sector Research Priorities
9
inability to sustainably exploit forests due to lack of infrastructure or even security may be
reasons for a slightly lower research potential.
• The complexity of management of plant and animal pests and diseases and the
development of more commercial production systems may be some of the reasons behind a
higher research potential, whereas commercial production systems in aquaculture might be
less complicated and workshop participants may think that many of the main research
opportunities may be well on the way to being resolved.
R&D Capacity
• It seems clear from the workshop results that most participants considered that research
capacity for the Crops sub-sector was well in excess of the research potential. Research
capacity in the other 3 sub-sectors was considered pretty much in balance with the
perceived research potential.
• This result does not indicate that any or all of the sub-sectors would not benefit from
improved research capacity, but it does indicate that given a limited research capacity
resource the spread of capacity across all research areas is unbalanced. Therefore from a
policy perspective, as opportunities to improve capacity arise, either through greater
numbers of researchers or further development of existing researcher skills (i.e. post-
graduate studies etc.), less emphasis on the Crops sub-sector and greater emphasis on other
sub-sectors (including economic/policy and environment) may be appropriate.
4 Interpretation of Results
12
Interpretation of Results
S
t
r
o
n
g
E
m
p
h
a
s
i
s
ATTRACTIVENESS
FEASIBILITY
S
t
r
o
n
g
E
mp
h
a
s
i
s
Se
l
e
ct
i
v
e Em
pha
si
s
L
im
i
t
e
d Suppor
t
I
NCREASE
D
S
EL
E
C
T
I
VI
TY
This graph provides the basis for
interpretation of results. The level
of investment (%) of total funds for
high priority AROs should be high
and for low priority AROs there
should be limited, but very specific
support. The results from this
workshop suggest that total
investment in research should be
highest for the Crops sub-sector,
next highest for the Fisheries sub-
sector followed by the Livestock
and Forestry sub-sectors.
4.1 Limitations of Results
The reliability of workshop results depends on the rigor and accuracy of the inputs (Workbooks)
and the representative nature of the participants. Larger workshops with a broad multi-sector
representation involving both the users and the suppliers of research will increase the confidence
in the quality of the results and therefore the use of the results in the research funding allocation
process.
Agriculture Sector Research Priorities
10
In this workshop, because of time limitations, private sector representation was not as great as it
should be. The majority of the participants were research providers. Some users of research,
including provincial representatives and extensionists participated, but the private sector was not
well represented. However there was balanced representation across the four sub-sectors.
The four subsectors compared in this workshop account for almost 75% of the total 2006-2011
research budget allocation. Because not all sub-sectors were compared it is difficult to provide a
total investment portfolio for all agricultural research funded by MARD.
5 Investment Portfolio
5.1 Cross Sub-Sectors
Even though there are some limitations of the results, it is useful to demonstrate how results such
as these can be used in the research funding allocation process. The example below looks at the
proportion of investment in each sub-sector from the 2006-2011 budget allocations provided by
STED and compared that with an interpretation of the workshop results. It looks at allocation
between sub-sectors and within sub-sectors using the results of sub-sector workshops held from
2008 – 2010.
The workshop did not address all of the budget areas depicted in Figure 1 because not all sub-
sectors/areas had been through a similar prioritisation process. So for comparative purposes just
the current budget for the four subsectors (Crops, Livestock, Forestry and Fisheries) has been
used. Current allocations show that almost half the total investment in the four subsectors is for
Crops and Plant Protection. Forestry is has approximately 23% with the lowest percentage of
investment in the Fisheries sub-sector (Figure 6).
Agriculture Sector Research Priorities
11
Figure 6: Current Investment Portfolio 2006-2011
The workshop suggests that research funding allocations for the 2011-2015 SEDP should be
modified (Figure 7) to reflect the return on investment for each subsector.
Figure 7: Suggested Revised Investment Portfolio
Figure 7 shows a significant increase in the proportion of the research budget in the Fisheries
subsector. It also shows an increase in investment in Husbandry and Veterinary sub-sector and a
decrease in the proportion of investment in the Crops and Forestry sub-sectors. It is important to
recognize that Figure 7 suggests a directional shift in funding and the percentages shown are
Agriculture Sector Research Priorities
12
indicative rather than absolute recommendations. Many other factors will need to be considered
by MARD/STED before final decisions on funding targets can be made. For example it is
difficult to assess the intrinsic environmental or conservation values of forestry (both in terms of
land stability and bio-diversity) and the workshop participants may have discounted these values
and over-emphasised the economic values associated with production and income.
If changes, such as those suggested above, are accepted, it will be important to manage the rate
of change in funding levels. It is unlikely that major change will be able to be made in one year.
The targets suggested above should be seen as something that funding levels could move towards
over the next 5 years. One mechanism for doing this is to keep existing funds at similar levels
and to use the annual budget increases (i.e. additional funds) predominantly for the fisheries and
livestock sub-sectors until the proportion of funding approaches the target levels.
This approach is likely to make effective use of existing investments and capacity, while at the
same time signaling a gradual change in funding emphasis. It will also enable capacity
development, especially in the Fisheries sub-sector and if the results of the workshop are to be
acted upon, it is suggested that available resources for capacity development (e.g. scholarship
programs) also target the Fisheries sub-sector.
5.2 Across and Within Sub-Sectors
If the results of the Agriculture Sector and the four sub-sector workshops are to be used, it is
possible to develop a comprehensive research investment framework. Figure 8 provides an
example of how this could be achieved.
6 The Next Steps
The workshop results are used as an example of how research priority setting methodology can
be used to develop an agricultural research investment framework that is most likely to provide
an improvement in the effectiveness and impact of investment in research. Agriculture research
in Vietnam is often perceived as having a relatively low return on investment and while
agriculture research intensity is well below developing country norms improvement in
effectiveness of research is a step in the right direction.
The suggestions above are just that – suggestions. The results have some limitations and as such
need to be viewed with some caution. However the methodology and approach is useful for
MARD and these results could be used as a basis for further consultation with key stakeholders.
There will no doubt be some disagreement in the results and conclusions, especially from those
sub-sectors where a reduction in the proportion of funding is suggested. In this agriculture sector
workshop each of the sub-sectors was well represented and all participant’s views were included
in the ranking results. If this process is to be used in the future the next steps suggested include:
1. Circulate workshop results to all key stakeholders, including balance representation of
research providers and users, key policy makers in MARD MoST and MoF.
2. Seek comment and constructive suggestions on the relevance and confidence in the
workshop results and suggested investment portfolio.
3. Modify the investment portfolio based on consistent comment and suggestions.
4. Obtain appropriate approvals of the investment portfolio as an input into agriculture
research’s contribution to the MARD and GoV SEDP.
Agriculture Sector Research Priorities
13
5. Repeat the research prioritisation process in year 4 of the current SEDP in readiness for
the next 5-year SEDP.
Agriculture Sector Research Priorities
14
Figure 8: Potential 2011-2015 Research Investment Targets
LargeAnimals
15%
SmallRuminant
Animals
2%
PigProduction
20%
Poultry
19%
ProductiveInsects
3%
Veterinary
Vaccines&
Animal
Remedies
21%
AnimalFeed
Processing&
Conse r v ation
15%
Non‐Allocated
5%
Livestock
Pulp&SmallLog
Products
38%
LargeTimber
22%
Bamboo&
Rattan
13%
Non‐Timber
ForestProducts
9%
ForestPolicy
5%
Environment
&Services
4%
Biodiversity&
Conservation
4%
Unallocated
5%
Forestry
Crustaceans
23%
FreshwaterFish
21%
MarineFinfish
18%
Mollusks
12%
Post‐harvest
Processing&Value
Adding
9%
Resource
Management&
Conservation
8%
Extractionof
Bioactive
Compounds
2%
ColdWaterFish
1%
Mechanisation
1%
Non‐Allocated
5%
Fisherie s
Rice
28%
Industri a lCrops
22%
Fruit
14%
UplandCrops
10%
Vegetables
9%
Legum es
7%
Flowers&
Ornamentals
3%
AnimalFeeds
1%
NewCrops
1%
Non‐Allocated
5%
Crops&PlantProtection
Agriculture Sector Research Priorities
1