Báo cáo nghiên cứu nông nghiệp " Agriculture Sector Research Priorities " docx
Bạn đang xem bản rút gọn của tài liệu. Xem và tải ngay bản đầy đủ của tài liệu tại đây (1.29 MB, 97 trang )
AgricultureSectorResearchPriorities
ResearchPriorityWorkbook
Hanoi:December14:2010
1
Contents
1 Today’sTask 3
2 ResearchPrioritySetting 3
3 IssuesinPrioritySetting 3
3.1 Complexity 3
3.2 CuttingtheCake 5
3.3 GainingConsensus 5
3.4 ResourceAllocation 5
3.5 TheChallengeforAgricultureResearch 5
4 ResearchPrioritySettingMethodology 6
4.1 ChoosingtheMethodology 6
4.2 PrioritySettingFramework 8
5
WorkshopAreasofResearchOpportunity 9
6 ASSESSINGPOTENTIALBENEFITS 11
EconomicBenefits 12
Size 12
Value 13
Exports&Imports 15
Export&ImportofCropProducts 15
ImportandExportofLivestockProducts 18
ImportandExportofFisheriesProducts 19
ImportandExportofForestryProducts 20
AgricultureInputs 20
Fertiliser 20
AnimalFeeds 21
Social&
EnvironmentalBenefits 22
EnvironmentalBenefits 23
7 ASSESSINGFACTORSFOR&AGAINSTACHIEVEMENTOFPOTENTIALBENEFITS 25
AdoptionRatesandProfitability 26
AgricultureDevelopmentStrategy 26
8 ASSESSINGRESEARCHPOTENTIAL. 38
Crops 39
Livestock 59
Forestry 68
Fisheries 81
9 ASSESSINGRESEARCHCAPACITY 89
Crops 90
2
Livestock 90
Forestry 93
Fisheries 95
3
1 Today’sTask
Objective:
To assist MARD to develop mechanisms for determining agriculture research priorities as a basis
for investment decisions for high priority opportunities for agriculture research programs and
projects across all areas of the agriculture sector.
To prepare a draft set of research priorities the agriculture sector using objective and subjective
data and information and results of previous priority setting workshops at the subsector level.
2 ResearchPrioritySetting
TheprimaryobjectivebehindResearch&Development(R&D
1
)priorityassessmentistodeterminethe
broadresearchprogrammesthatwillprovideVietnamwiththegreatestreturnoninvestmentinR&D
providedbygovernmentandothermajorstakeholders.
Priority se tting is the central issue of research and extensi on management.It is a complex task.It
mustbedone
inasystematicframeworkabletoallowtheresultstosupportopenan drobus tdecisi on‐
makingaboutresearchandextensionresourceallocationandmanagement.The highest priorityR&D
isthatwhichhasthehighesteconomic,socialandenvironmentalvaluetothenation .
Choices must be made about the
Areas Research Opportunity (AROs)to support, and which not to
support.If there are no established priorities, then the choi ces made will be unlikel y to produce
resultsofmaximum benefittoVietnam.Atworst,theresultswillbeirreleva ntandprovidenoreturn
forthepublicinvestmentinvolved.
Because priori tysetting
is considered verycomplex, it is oftenput inthe “too hard basket”. How to
decide the proportion of the available budget to allocate to agricul tu re sub‐sectors (e.g. Crops,
Live stock,Fisheries,Forestry,Environment,Policyetc.)andthenwith ineachsubsectorwhatshouldbe
the budget allocation to all the different
crops and p roducts?In many cases (including MARD)
decisionsaremadealongbudgetlines.Howmuchwasthebudgetforthepreviousyearandshouldit
bemodified?Usuallyadecisionismadetoeithe r increaseordecreasetheproportionofexpenditure
by very small amounts and little attention is
paid to the likely results or outcomes expected from
research expendi t ure.In general the end result is that there is often duplication in research effort,
researchersfocus on whatisalreadyknown,thechallenge andinnovationexpectedfrom researchis
absentandthereturnoninvestmentforresearchispoor.
3 IssuesinPrioritySetting
3.1 Complexity
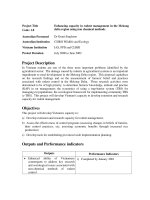
The main difficulty in priority setting for agriculture and rural development is that there are many,
manyresearchopportunitiestoconsider.Howcancomparisonsbetwee nthemanydifferentcropsor
products fr om research be made? One way of resolving this dilemma is to break research priority
setting down into manageable pieces,
bydeveloping a research priorityframework and hierarchyof
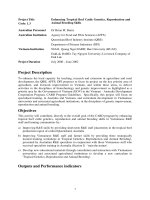
priorities.Figure1providesanexampleofapriorityhierarchy.
1
Developmentincludestechnologydevelopmentandtransferusingtransfermechanismsincludingextension
4
HIERARCHY OF PRIORITIES & RESOURCE ALLOCATION
WHOLE OF
GOVERNMENT
AGRICULTURE &RURAL
DEVELOPMENT
SERVICESCONSTRUCTION
AGRICULTURE &
RURAL DEVELOPMENT
POLICY
RESEARCH &
DEVELOPMENT
QUARANTINE & BIO-
SECURITY
FINANCE &
ADMINISTRATION
FOREIGN RELATIONS
& TRADE
PIGS
HORTICULTURE
CROPS
STAPLE
CROPS
INDUSTRIAL
CROPS
LARGE
ANIMALS
POULTRY
FOOD
PROCESSING
VALUE
ADDING
LARGE
TIMBER
OTHER
SECTORS ???
FRESH
WATER
FISH
MOLLUSCS
MARINE
FINFISH
CRUSTACEANS
LIVESTOCK CROPS
NON-WOOD
FOREST
PRODUCTS
FISHERIES FORESTRY
SMALL
RUMINANTS
RICE
PULP &
SMALL
LOGS
BAMBOO
RATTAN
CONSERVATION
VACCINES
ANIMAL
REMEDIES
FEEDSTUFFS
COLD
WATER
FISH
POST
HARVEST &
PROCESSING
PRIORITY PROGRAMS
PRIORITY PROGRAMSPRIORITY PROGRAMS
PRIORITY PROGRAMS
5
TheCARDProgramhasworkedwithMARDtodemonstratethemethodol ogyatthesub‐sector(Crops,
Live stock,Fisheries,Forestry&Economic&Policy)levels.
3.2 CuttingtheCake
Whatproportionofthenationalscienceandtechnologybudgetshouldbeallocatedtoeachofthe
foursub‐sectors?Dependingonyourscientificinterestsandexpertiseanumberofscenariosmay
beputforward.ThesecouldbedepictedasinFigures1&2below.
3.3 GainingConsensus
“Whoisright? ”Whichoneoftheallocationsaboveiscorrect?Doanyofthemreflectthebestoptions
for thefuture?Consensusis a major issue asopinions varyof what is priority and what isnot, and
biasesand conflictsofinterestcanimpactontherobustnessand quality
ofprioritysetting.It isnot
possible to get absolute agreement on priori ties, but provided a broad cross ‐section of key
stakeholders are involved and contribute individually and collectively to priority setting a consensus
canbereached.In mostcasestheconsensusisseenbyallparticipantsasmakingsense
withgeneral
agreemen t on high and low priorities, but some differences in opinion for the middle range of
priorities.
3.4 ResourceAllocation
Having determined research priorities, it is assumed that high priority research will receive
preferentialfunding.Inmanycountriesthefundingdecisionsfollowthehierarchypriorities.Central
governmenthastheresponsibilitytodecidesontheallocationacrossbroadsectorsoftheeconomy
(i.e. Agriculture & Rural Development, Construction and Services). Within sectors
the Ministry
responsible has the mandate to make decisions about the resourcing of sub‐sector and thematic
research areas. Within sub‐sectors Departments of Science & Technology have r esponsibility for
allocation of resources. The overallaim of asystematic process is toimprove the economic, social
andenvironmentalreturnon
governmentinvestmentinresearch.
3.5 TheChallengeforAgricultureResearch
OverthelastfewyearsthecontributionofagriculturetotheGDPhasdeclinedinrelativeterms.
Figure2: PercentageofGDPbySector(1994prices)
23.3
20.4
17.6
35.4
39.4
41.6
41.3
40.3 40.8
0%
10%
20%
30%
40%
50%
60%
70%
80%
90%
100%
2000 2004 2008
Trade and Services
Industry and Construction
Extended Agriculture
6
This assessment probably underestimates the contribution of the agriculture sector as the
proportion of the population in rural areas is >65% and much of this is of a subsistence nature,
contributinginaninformalwayandrepresentsahighproportionofthepoor.
Figure3: Urban:RuralPovertyRates
0
5
10
15
20
25
30
35
40
45
50
1998 2002 2004 2006 2008
Urban
Rural
Note:PovertylinefromGSOandWB:1998:expenditure/per/month:149kVND;2002:expenditure/per/month:
160k VND; 2004: expenditure/per/month: 173k VND; 2006: expenditure/per/month: 213k VND; 2008:
expenditure/per/month:280kVND
Thechallengefor agricultureresearchis to ensurethatagriculture’scontributiontoGDPisat least
maintained, if not impr oved, and that it contributes to social and environmental indicators. This
challengewillbeeasiertoachieveifahighproportionoftheresourcesavailableforresearchtarget
highpriorityareas.
4 ResearchPrioritySettingMethodology
4.1 ChoosingtheMethodology
2
There is a range of methodologies available for R & D priority setting.Selection of the most
appropriatemethodologyforVietnamisdrivenby:
1. The need to use a consultation process that involves a large number and diverse range of
stakeholders;
2. The need to develop ownership of priorities amongst
MARD and research institute staff,
farmers,exporters,processorsandmarketers.
3. The absence ofdetailedandreliablestatistical data onproduction, profitability,andmarkets
and the absence of analysis of the impact of research on national, regional and household
GDP;
4. TheneedtomovefromR&Dfocussed
onproductionandsubsistence/foodsecuritytoR&D
emphasising an empowering policy environment to generate improved agriculture
sustainability,profitability,q uality,ma rke tingandcommercialsystems;
5. The need to use an objective process that evaluates the likely economic, social and
environmentalbenefitstoVietnam;
6. Thecapacitytoundertakeappr opriateresearch.
An important principle is to implement the process and learn from experience, doing what make
senseratherthanworryingaboutacademicperfection.
Specificprinciplesaboutprioritysettinginclude:
2
CSIROAustraliahasappliedthebasicmodeldescribedhereatcorporateanddivisionlevelsandithasbee nusedinmorethan
60otherresearchorganisationsinAsi a,AustraliaandNew Zealand,USAandEurope.Theconceptualanal yticframeworkis
basedontheonepublishedbythe IndustrialResear c hInstitute,New
York in1986,viz:RNFoster,LHL i nden ,RLWhiteleyand
AMKantrow,ImprovingthereturnonR&D ‐I,in 'MeasuringandImprovingthePerformanceandRe tu rnonR&D',IRI, New
York(originallypublis he dinResearchManageme nt,January1985).
7
• Consider areas that are easily related to the benefits from research (the purpose of the
research) not research disciplines – in this case defined as Areas of Research Opportunity
(ARO)
• These areas should be mutually ex clusive and collectively exhaustive, co nsistently based,
forwardlookingandmanageableinnumber
• Linked
toandconsistentwiththeresearchfinancingtheprocess
• Criteriaareindependent
• Thecriteriausedshouldconsider:
o The potential economic, environmental, social, institutional and scientific
benefitsfromsuccessfulresearch
o Thecontextwithinwhichresearchproductsandserviceswillbeused
o The state of development of
required research tools and techniques and the
healthofappropriatedisciplines
o Theavailabilityofresearchskillsandinfrastructure
• Importantly, priorities are relative; the lower the priority of an area the greater the
selectivityinchoosingprojectswithinthem,asillustratedinFigure2.
Themodelrecommendedforuse
inVie tnamisasi x‐stepprocess.
1. DefinebroadAreasofResea r chOpportunity(AROs)atthesub‐sectorlevel
2. PrioritiseAROsatthesub‐sectorlevel
3. Prioritisecrops/produc tswithinAROsatthesu b‐sectorlevel
4. From theresults of the sub ‐sector prioritisa tionestablishprioritiesat
thesectorlevel (thesemay
combinesomeofthesub‐sectorlevelprioritiesintoalargergrouping.
5. UndertakeSectorlevelresearchprioritisation
6. Prepareworkshoprepo rtsandaNationalR&DInvestmentPortfolioandPolicyStat ement
Figure2:UseofPrioritiestoAssistinSelection ofResearchPrograms/Projects
S
t
ro
n
g
E
m
p
h
a
s
i
s
ATTRACTIVENESS
FEASIBILITY
S
t
r
o
n
g
E
m
p
h
a
s
i
s
Selective Emphasis
Limit
e
d Support
I
NCREASED SELE
C
T
I
VI
TY
InthepasttheresearchanddevelopmentprogramisdrivenbyMARDstaffusinganallocativeprocess.
ItispossibleinthefutureMARDtofundresearchunderanopenandcontestableprocesswithoutbias.
The aim is to improve the efficiency and effectivenessof investment into research and todevelop
a
researchenvironmentthatencouragesahighdegree ofinnovation.UnderthisprocessMARDwould
clarifytheprioritiesforresearchinvestmentanddefinethebroadoutcomesexpectedthatinvestmen t.
Theresearchproviderswillsubmitresearchproposalsandbudgetsthatwillcontributetoachievement
of these outcomes.In a “perfect world”
those projects that offer the best valu e for money will be
supported.
8
4.2 PrioritySettingFramework
The model used to form Research priorities is relatively simple.It asks participants to evaluate the
overall merit of Research investment in each ARO, in terms of Attractiveness to Vietnam and its
Feasibility in Vietnam.A scoring scheme is used to compare and rank the AROs. Scoring is an
effective
waytoallow a grouptotake all factorscriticaltothedecision intoaccount inalogicaland
openway.Therelative scoresforeachAROaredevelopedinstructuredgroupdiscussionsintermsof
fourindependentcriteria.Theseare:
1. PotentialBenefitsforVietnam
2. FactorsWorkingFor&
Agai nstAchievementof Potentials
3. PotentialContributionofR&DtoDevelopme nt
4. R&DCapacityWithi nVietnam
Thecriteriaaredefinedasfollows:
Potentialimpact
• PotentialBenefits
• maximumadditionalbenefitsforVietnam(economic,environmental,social)
fromsuccessfulresearch
• FactorsWorkingForandAgainstAchievementof
Potentials
• likelihoodoftheresultsofsuccessfulresearchbeingutilizedbyVietnam
Feasibility
• PotentialContributionofResearchtoDevelopment
• scope for growth in knowledge in the relevant scientific fields and
improvementsinresearchtoolsandtechniques
• Researchcapacity
• Vietnam’s ability to competitively assemble research teams to
deliver
researchoutputstousers
Therelationshipbetweenthesefourcriteriaisshowninthea ssessmentframeworkbelow.
The relative rankings and positions of the AROs are important.They indicate the best “areas” for
research and/or extension investment.When the priority‐setting group represen ts researche rs ,
extension workers an d academics, farmers, politicians an d the agri cultural indu stry and other
stakeholders,themethodologyensuresthatthe bestrecommendationspossibleatth e
timearemade.
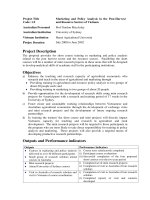
Anexampleoftheoutcomeoftheprioritysettingprocess
Figure3. Plotof attractivenessversus feasibilityfor ahypothetical set of eight AROsshowingtheir
priorityratingonthebasisoftheirreturntoVietnam.
9
RETURN FROM R&D FOR EACH AREA OF RESEARCH OPPORTUNITY
Feasibility
Attractiveness
0
10
20
30
40
50
60
70
80
90
100
0 102030405060708090100
1
2
3
4
5
6
7
8
InFigure1,twoAROs(#1and#8)scorethehighestforbothattractivenessandfeasibility.Theyarelocatedin
thetop right hand corner ofthe graph.They warrant strong research and extension emphasis, and are the
highest priority groupof AROs.Thoselocatedmore towards the
centre ofthegraph (# 3, # 5,# 6 and # 7)
warrantselectiveresearchandextensionemphasisandcanbeclassedasmoderatepriority.Thetwowithlow
scoresforbothattractivenessandfeasibility(#2and#4)justifyonlylimitedsupportandhavealowpriority.
AROs
# 3 and # 5 have similar attractiveness scores, but ARO # 5 scores higher on feasibility.In this
hypotheticalexamplethelowerfeasibilityscoreforARO#3occursbecausetheskillsavailabletocarryoutthe
researchandorextensionareconsideredtobeinadequate.Whenthenecessary
skillsareacquired,thetwo
AROs would otherwise be equal claimants for research resources.Attractiveness is determined by factors
otherthanresearchandextension,suchasmarkets,profits,employment,socialandculturalbenefits,sowhile
AROs#5and#7havesimilarfeasibilityscores,#5ismoreattractive,andcouldbeallocatedmoreresources
forresearchandextension.
5 WorkshopAreasofResearchOpportunity
FordemonstrationpurposesfourAROsareselected.Theyare:
1 Crops (or Cultivation) including:Rice, Upland Crops, Legumes, Industrial Crops, Fruit,
Vegetables,Flowers&Ornamentals,AnimalFeedsandNewCrops
2 Livestock including: Large Animals, Small Ruminant Animals, Pig Production, Poultry,
ProductiveInsects,VeterinaryVaccines&AnimalRemedies,andAnimalFeed
Processing
&Conservation
3 Forestry including: Large Timber Production, Pulp and Small Log Products, Bamboo and
Rattan, Non Timber Forest Products, Bio‐diversity an d Conservation, Environment
andServices,andForestPolicy
4 Fisheries including: Marine Finfish, Cold Water Fish, Crustaceans, Molluscs, Fresh Water
Fish, Post‐Harvest, Processing & Value Adding,
Extraction of Bio‐Active Compounds,
ResourceManagement&Conservation,andMechanisation
10
PRE‐WORKSHOPASSESSMENTOFAROs
[PurposeistoundertakeapreliminaryassessmentoftherelativepriorityofAROsagainst
PotentialImpactandFeasibilitycriteriatoenhancethelevelofdiscussionduringtheworkshop]
Steps
1) ReadalltheInformationandDataincludedinthisworkbookforallAROs
• Carefullyre adalltheInformationandDataforeachofthepriorityevaluationcriteriato
obtainanoverviewofallfourAROs
• Makebriefnotesinthemarginsofthethingsfromyourownviewsandexperienceyou
thinkareimportantfortheon‐goingResearchprogramforeachARO.
2) PrepareindividualpreliminaryAROScores
i) Instructionsforpreliminaryscoring
Participants should score each ARO before coming to the workshop and make note of their
reasoningtosupporttheirargumentsindiscussion.Spaceisprovidedin the workbookagainst
eachARO.
• Step 1‐For each criteria inturn, read the information and analysis for each of the
AROs,startingwithPotentialBenefits
• Step2–Now,inyourviewselectthehighestAROsandthenthelowest
• Step 3 –Now, score theHIGHEST ARO7, and the LOWEST ARO1. Finally, scorethe
MEDIUM ARO’s using scores 3 and 5.The aimof theevaluation is to examine the
relative differences between AROs, so a wide spread of scores is desirable.A low
scoredoes
notmeanthatanareaisunimportant–itjustmeansthatinyourviewitis
lessimportantthantheothers.
• Step4–repeattheprocessforthenextthreecriteria
• Step 5 – Having recorded your scores and reasoning in the Workbook for the four
criteria,transferyourscorestotheconsolidatedscoresheetandbringitwithyouto
theworkshop.Allscoreswillbetabulatedandmadeavailableattheworkshop.
The purpose behind this procedure is to achieve
as much discrimination between the AROs as
possible.Weare interestedinexploringtherelativedifferencesbetweenAROs.Itisimportant to
rememberthatprioritiesareRELATIVE.Alowscoredoesnotmeanthatanareaisunimportantper
se.However, when resources are limited, decisions need to be made
about where to focus the
efforttoachievethegreatestimpactforVietnam.
11
6 ASSESSINGPOTENTIALBENEFITS
[PurposeistoprovideanassessmentoftherelativePotentialBenefitsfromeachoftheAROs]
Potential Benefits reflectmaximum additional benefits for Vietnam (economic, environmental, and
social)fromsuccessfulresearch
Potentialbenefitsincrease
– Thelargerthesize
– Thefastertheeconomicgrowth(productionandvalue)
– Opportunitiesfor
increasedexportsand/orimportsubstitution
– Thegreaterthereductionincosts
– Thehighertheresearchintensity
– Thegreaterthepositiveenvironmentalandsocialimpact
Procedure:
Tablegroups
• Discuss potential benefits arising from each ARO using preliminary scoring to initiate
discussion
• Discussreasonsforhighand
lowscoringandobtaineachgroupmember’sviews
• Eachparticipanttore‐scoreeachAROifnecessary
• Scorescollected
NOTES
12
EconomicBenefits
Considerthefollowinganalysisofthefoursectors.
Size
Contribution to Agricultural Output (Percentage at current prices)
GrossOutputbySector(1994prices)
13
Value
GrossOutputforCultivation/CropsSector(BillionVND1994prices)
GrossOutputforFisheriesSector(BillionVND1994prices)
GrossOutputforForestrySector(BillionVND,1994prices)
14
GrossOutputfortheLivestockSector(BillionVND1994prices)
0
5000
10000
15000
20000
25000
Biganimals
Poultry
Non‐meatproduct
15
Exports&Imports
ExportbySector(MillionUSD)
Export&ImportofCropProducts
ExportofCrops/CultivationProducts(MilUSD
16
17
Tea Export
0
20
40
60
80
100
120
140
160
2000 2001 2002 2003 2004 2005 2006 2007 2008 Prel.
2009
Volume (000 tons)
40
60
80
100
120
140
160
180
200
value (mil.$)
Volume (000 tons)
Value (mil.$)
ImportofCrops/CultivationProducts(000USD)
0
100000
200000
300000
400000
500000
600000
rice
coffee
tea
pe pper
pesticide
fruit&vegetables
ri ce
Pes ticide
Fruit&Vegetab les
18
ImportandExportofLivestockProducts
ImportandExportofLivestockProducts(MeatandEdibleOffal$US000)
0
20000
40000
60000
80000
100000
120000
140000
160000
180000
200000
2000 2001 2002 2003 2004 2005 2006 2007 2008 2009
Imp ort
Export
Importofmilk/milkproducts(mil.USD)
0
100
200
300
400
500
600
1995 96 97 98 99 00 01 02 03 04 05 06 07 08 2009
19
ImportandExportofFisheriesProducts
ExportofFishproducts(mill$)
Importvalueoffishproducts($US)
0
50000000
10000000
15000000
20000000
25000000
30000000
35000000
2007 2008 2009
20
ImportandExportofForestryProducts
ImportandExportofForestryProducts(Wood,WoodArticles,Charcoal(US$‘000s)
0
200000
400000
600000
800000
1000000
1200000
1400000
1600000
1800000
2000000
2000 2001 2002 2003 2004 2005 2006 2007 2008 2009 2010
Import
Export
AgricultureInputs
Fertiliser
FertilizerimportvalueofVietnam(000USD)
0
200000
400000
600000
800000
1000000
1200000
1400000
1600000
2000 2001 2002 2003 2004 2005 2006 2007 2008 2009
21
Fertilizerdomesticproduction(000tons)
1500
1700
1900
2100
2300
2500
2700
2004 2005 2006 2007 2008 2009
AnimalFeeds
ValueofInputsforAnimalFeedandFeedProcessing
0
200,000
400,000
600,000
800,000
1,000,000
1,200,000
1,400,000
1,600,000
1,800,000
thousand USD
2001 2002 2003 2004 2005 2006 2007 2008
(estimate)
Year
Domesticproductionofthemaininputsforfeedproductionandestimateddemandforfeedinput
(1000tonnes)
Materialtype 2005 2006
1.Brokenrice,paddyandbran
3
6084 6090
2.Maize 3401 3437
3.Cassavaandpotato 2421 2785
4.Soybeanandsoybeancake 114 127
5.Fishmeal 35 112
6.Mineralandpremix 68 138
Totaldomesticoutputforfeed
production 12123 12975
Feedinputdemand 13630 15864
EstimatedDeficit ‐1507‐2889
3
Brokenrice is3%equivalenttorice;paddy for feed productionisequalto3%ofitsproductionandbranis
equalto11%.Theshareforfeedproductionofmaizeis90%;cassavaandpotato80%andsoybean33%.
22
Source:StrategyforLivestockDevelopmentto2020,DepartmentofLivestockProduction(2007)
QuantityofimportedfeedinputstoVietnamin2006(‘000t)
Feedinput 2006 2007 2008
Maize 564.5 612.8 467.8
Extractedricebran 190.2 488.0 199.9
Wheatbran,flour 490.6 333.6 639.5
Vegetableoil,fishoil 26.4 54.2‐
Soybeancake 1591.8 1686.3 2161.8
Soybean 17.6 17.7 293.3
Maizegluten 35.0 54.0 23.5
Animalnutrition 10.7 18.7 166.4
Lactose‐25.9 10.1
Fishmeal 54.8 41.2 153.8
Animalby‐products 84.2‐ ‐
Premixvitamin 8.3 37.5 0.7
Aminoacid(Lyz,Met,Thre) 21.9 19.3 51.9
Mineral,additive 74.7 98.8 16.1
Total 3170.7 3488 4184.8
Sources: Strategy for Livestock Development to 2020, Department of Livestock Production (2007,
2009)
Social&EnvironmentalBenefits
Employment
Theagriculturesectoristhelargestintermsoflabourforce.
Sector
2009
(persons.)
%
Agricultureandforestry 23022 48.5
Fishing 1766.5 3.7
Miningandquarrying 477.4 1.0
Manufacturing 6851.2 14.4
Electricity,gasandwatersupply 262.6 0.6
Construction 2692.8 5.7
Wholesaleandretailtrade;repairofmotorvehicles,motorcyclesandpersonaland
householdgoods
5275.7 11.1
Hotelsandrestaurants 816.4 1.7
Transport;storageandcommunications 1198.4 2.5
Financialintermediation
219.6 0.5
Scientificactivitiesandtechnology 27.3 0.1
Realestate,rendingandbusinessactivities 257.8 0.5
Publicadministrationanddefence;compulsorysocialsecurity 1818 3.8
Educationandtraining 1375 2.9
Healthandsocialwork 391.5 0.8
Recreational,culturalandsportingactivities 133.7 0.3
ActivitiesofPartyandofmembershiporganisations
198.1 0.4
Community,socialandpersonalserviceactivitiesandprivatehouseholdwithemployed
persons
959.6 2.0
Total 47443.6 100
Whataretheoff‐farmemploymentopportunitiesforeachofthefoursubsectors?
Thinkaboutemploymentintermsof:
• Thehouseholdlevel–useofhouseholdlabour
• Thelabourmarket–useofnon‐householdlabourforfarmactivities
23
• Theserviceproviders–provisionofinputs,advice,traders,marketers
• Thevalueaddingsector–manufacturing,processing,packaging,exporting,quality
assurance
• Thetransportsector–freight,shippingetc.
Ofthefoursub‐sectors,whatwillthegreatestopportunitiesforfutureemploymentbe?
EnvironmentalBenefits
Thinkaboutthepositive andnegativeenvironmentalimpactsofeachofthebroadsubsectors?For
somesub‐sectors(e.g.catfishanduseofagriculturechemicals,pesticidesetc)theenvironmental
andfoodsafetyissuesarewellknown.Forotherssuchasforestryforcatchmentmanagementanda
potentialcarbonsinkanddevelopment
ofmangroveareasforcoastalprotectiontheenvironmental
benefitsareintrinsicanddifficulttoestimate.
24
POTENTIALBENEFITS‐PRELIMINARYASSESSMENTANDSCORING
PleasecompleteyourpreliminaryevaluationbeforecomingtotheWorkshop
ARO SCORE
(1,3,5,7)
Reasonssupportingyourscore
1:CROPS
2:LIVEST OCK
3:FORESTRY
4:FISHERIES