Báo cáo nghiên cứu nông nghiệp " Research Priority Setting Workshop Agriculture Sector " docx
Bạn đang xem bản rút gọn của tài liệu. Xem và tải ngay bản đầy đủ của tài liệu tại đây (4.58 MB, 25 trang )
ro/02/2077
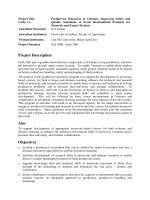
Key Issues
'
Gdernhent ofvietnam wdts
gwth
it
.g.iculture! .ontribution to GDPand dport3
'
Resedh
.an
fu.ther
.ontribute to
imp@ing
.odpetitive.ess ofvielnam's agriculture sector
I Good
policies
and
priontiessetthe
eNircnment for
economi. &
r*.rch management reform
!
Prioriti€s
paide.fcur
to impa€ the
efr€.tiv€nes
(impact)
or investm€nt in res€flh
-
focus on wh€re the m.jor b€nents will come frcm.
t
A difiicult ta.k so need to break it ddn so that it is
undeBtddable and manageabre
Key Issues
lcontirued)
'
Prioriti$ focus fi6ton
outputs
(i.e.Brcad Pbduct
of Them.tic Are )
I
N€€d tolink l€*arch intoGoV Rural D€v€lopment
Outcomes thrcuah
pdidins
tansible b€nefits
t
There
b a difreren.e between the Outpub of
research and the
research
3Fategi€s
or
inputs inb
t
The
qustion
is wh.t output3 could the rese.rch
stratqier be applied to
siv€
the
sreate*
impac:
'
On.e Outplts
prio.itised
need
to ddelop Output
obiectivesand ttulti-di*iplinrtreseffih
pbgrams
to ehise objectivs
Hielarchy of
priorities
& Re8o}rce
Allocatlon
t*. i :;-
;l
's-
iq]EE::
s
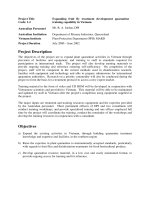
Research Priority Setting Workshop
Agriculture Sector
(o.pi
Li6roqk, Fdr.{rr fchdiet
Hanoi,December 14,2010
Agenda
I
Prioiity Setting lethodologt
r
Pre.€nt tion
of
Datr
&
Inlo.mation and S*tor
AnalFis
I
Priority S€ttins: Workins Grcups Scorina usina
t
Summat& Closure
workshop obj€ctives
,
Io dsln/VltRD to d.Er+ me.hdrism
&r
d€t€rniring dgri<ultuE reredt.h
Ptlotirlzs
ds d hatit
for
iryenm.nr .t .isions
for
high
pdomy
d4.i.ukurc
re*drch
prcaEEs
ond
prej€<.r,
I
To
p.cporc
o <tftfr tet of rc*orch
ptio.ities
rhe
oqtkltture
tecror utins obje.rire ond tubi.crie.to.a
on.l infonatioa an t rerulB ofPftviols
P
onty
setrina rcr|(Jh+s d tn€ sr6se.to. ,€v€t
Cutting th€ Cak€?
OR NEITHER?
HO\A,TO DECIDE??
70/02/201.L
Pxpect€d tltorkshop Ouiput
_FEAs|B|LTY.>-
Priority Setting Methodology
t
Used wid€lt in m.ny ds€lopins .nd ddeloped
'
Beed
on
4 Independent
Crir.ri,
for
evaluarion
of
,
eotential Benefib{Hdbiced hd murhl)
r
Abilityto
captur€ aen€fits
(H@
easyto adoptr)
, Rseaf.h ?or€rtiar (5 it
a
r ReseaEh Careity
(Oo
we have the rkillsl)
I
Th€ 4 .riteri. form the Priority S€ttina
Pdorities Framework
AREAS OF RESEARCII OPPORTUNITY
I
crops
(or
curtivation)
? Live*ock(Husbandry&Vet€rina.y)
Fed
Frccarnr &
con,smlon
R{ae, Nonr'mber Fo;'t tldud' Bre.di;{'q ed cotr.n*pn,
9!;poqn4.
.eiE! Mu{.nN & con;;rren, {d
70/02/2071
ASSESSING POTDNTTAL BDNEFTTS
!
Potential Benefits E red n.xinun o.Llkioncl henefiE
fot
vi.rnc6 (Eononic, enuircnn ntot, ond so.ict)
fron
t Potential
benefits increase
.
The ldter
the economic
A'qth
(prcdu.tion
and
,
Opportunitig for in.EG.d erports dd/o. import
,
Tho grcat.f
th€ reduction in cosB
.
lhe higher the aearch intenlity
Th€
aEat.r
th€
positiv.
.nvircnmenel dd soci.l
Score Pot€ntial Bere{its
I
Step |
-
Frcm
lour
p€rson.l
vis sel*t th€ hish€st
AROS and then the lMest
)
Step 2- S.ore the HIGHEsTARO 7,dd the
LOWEST ARO I . Finall, score the MEDIU M ARO'S
using'.ores3 and 5.
ft h.tth. Mtudton b6danh.
rr. ohdyo drtlnrcr t.Md
eot
e d id 0&d ol xd4 h
dr da ot b ldt9otu^r- i.
ia
naB ed in
PV
ic\| k n t* tnt
I
Step 3
-
Reord your
resoningroryour *oE on the
,
St€pa-Scorcscoll€.t.d
Pot€ntial Beaefit
(Irdpact)
Procedure:Table
G.oups
I
Discuss the Potential Benefitt arisina trcm edn
ARO using
prelimin.ry*oring
to initiate
I
Think about the
possible
mdimum
.ontribution each oftheARoswill have to rur.l
ddelopment der the ne* 5
-
l0
FaE
-
not
the
past
blt th€ flture!
I
A3srme that there will be few obstacles in
a.hiding the mdimum
potential
!
l,lake an ss€ssm€nt of the compeative total
value
oftJje*
potenti.l
benefitr
for
e&h
ARO
Factors For
& Against Achleveuent of
Porential Benefits
{or
Likellhooal ofUprake)
'
Procedure: Trble grclps
Benetrb:.riing rrom e,( h Axo u
th€
poEnti.r
lor
erhAROin r€rms otrj
b€nent
(rarm€6)
& 6,e rircry iFd of .doption
,
rbenti.r
oorid.ar or .dnininr.tive ditn.ub or .6€ of
rhe romprsiry
orrh'd€h6L-(ompr€r
po.cduEsor
Existinr 6d.rnm€nr mlid€s th.
3up@*rd d€
drfFij
i€!
aeb(
ASSESSIIVG
FACTORS FOR
&
ACAINST
ACHIEVEMENT
OF
POTENTIAL BENEFTTS
r
Factors For &AgainstAchi€vement of Potential
Benent5
(o.Likelihood
ofUptake)
-
6fldr
t,.erihood
ofdrlre Esfir
ofl(@s tt E dRh
b.ineutitiea
' Lik€lihood
of uptake
i. greaaer
.
Thehi€herrdfastertheadoptionrate
'
The morc e-ily ben€fitt aE re.oCnised
,
The morc frvour.ble
Bd.mment
poli.i€sand
,
th€ morc effe.tiye the denlion sFtem
.
Th€ high€. th. res*h int.n.ity and ld€l of
.
The h'Aher the inFm*ional .omper itivene\r 'n iride
score Likelihood of Uptake
)
scp |
-
Frem your peaonalview selectthe hiah4t
ARO.
ud
then the lflest
'
Shp 2
-
S.ore the HIGHESTARO 7,ud the
LOWESTARO l.Fin.llts@re
the
MEDIUMAROk
usings.orcs I ud L
rh.din.tth $tudtonBtountn
th. ae aftEmr b!*!i,mor e o $d. sodd ol xot8 B
d oa
qro
n vhpotu^.
-
tu
lR
n.o$,rd iD
rovtu\|
k n t* h
t
Step 3
-
Re.od
yoo.
E-oninaaoryou. score on th.
'
St.p
,l -
S.orcs coll€.t.d
70/02/2077
Res€arch
Potertial
P.o.edurer Table
Groups
t
Dis.uss the
RseaEh Potential
of ea.fi
ARO using
prcliminey3.orinsto
initiate dis.ussion
r ihink
alout the
impd that Bearch .ould m.lG to
rchidinsthe
potential
benefis.
-
Cd GseaEh h€lp?
,
Think aboot E Eh
pot€ntial
in terms ot
-
,
lsth.n.iorcsu€.l&r. orrese.(h,or alackorsood
'
what re tfi€ n.io. Eseeh oppotunities
(d3e
or dlfllcurq of Edfth)l
The R€seatch
"s"
culve
ASSESSING RESEARCH CAPACITY
'
Res€arch .apa.ity
-
6tl€d, Vdrdht dbihy .o
@dl.ritiEly d*rt|. res5 h dd.n.nlior ecd b
de,iEr Es€cEh
oulru6
ro uGrs
'
Research .apa.ity ifrpB€s with:
,
The
quality
and breadth of 3kills available
'
The ability to
put
togetler high
performing
'
The
efii.iency ofiunning the re3edh
I
The
quaiity
of infrrstructure and equipment
I
The
quality
.nd efficiency of support st.fi.nd
ASSESSING RESPARCN POTENTIAL
'
9cientili c
potential
-
Efd s 1L
f.t z6*h
in
e'o*,.dF i, tt. Eldont si.ntiti.
f.lds
dd th.
ovcilobilhy of Ereor./l 6ols dnA c.hniques b Ue6on
,
S.ientifi<
potential
is hiaherl
'
The fdter the rde of chanCe in relndt db.iplines
,
Th.
get€rth€
lik lihood of *i€ntilic adnnce
,
The betbr
ad
more ac.esli5le the relenh bols
,
The hisher the atio of baic ed stat€ai. 6s Eh
Score
Research Potential
I
Step
|
-
Fmm your peEonal virysele.tthe hirhest
AROS and then the
lNelt
t
Step
2-
S.orc the
HIGHESTARO 7,and the
LOWEST ARO I.
Finalln score th€
i4EOIU|l ARO's
usinas.ores 3 and 5. ft.ofraf reqtuqto^h.o.ffii^.
r[. EbnE djfEErco 6!e!i r^or e o 'id. lpddd.fnoa 6
ie
nffi$drh
r.ut
rt.w t2k ta hpodo4 r., rt orh.n,
'
Step 3
-
Re.ord
tour
rcdoni.sforyours.orc on th.
,
Step a
-
Scoa.olleded
Research Capacity
Procedur€r Table Groups
,
Dis.$ithe Rese.rch C.p.ci9ofe&hARO usina
preliminary
scorin! to initi.t€ dis.ustion
t
Think about the available kndleds€ andskills of
re<€fth !.i€ntisa invietmm ben€fits Cd w.
r Think about f€s€arch .apa.itt in terms of:
.
'
Hry mud, imshdt
(ru.ds
rd
r:.iritia
or .qulpm€nt)
hmr|readybanmad€r
,
what aE the skirrs
s.ps
dd
hm
cat
*irl lt
bc to
llll
4
Score Reseatch
CaDacitv
'
skp |
-
Frem your peBonal
viesele.ttn6
hieh.st
AROs
dd th€n the ldsr
'
Step
2-
Score the HIGHESTARO 7,and
th.
LOWEST
ARO | . Finatlt
scorc th. MEDTUM AROt
usina s.ores 3 and
5. rn .in ot 6E !rutvtua
t@.\dntn
rre €rdr'E dftE,iq
rtu.ninor so a 6dc 'pEod af*t6k
qntcoLlnhDo,d-k
,d
Dr"r
tu i,
rlurft,
n n 69 ht
I
St€p 3
-
Record you.
resonina for
your
*oE on tfie
I
Step 4
-S<oB
cott t€d
ro/0212077
Workshop
Output
"
Feasibility
Workhop Output
-
Return
oa hvestment
5
ntorkshop Oatput
-
Attractiv€ness
10t02t2011
POTNN'IIAL A.NO ARII,ITt Of'
BENEFITS
CAPTURE
IN
TH]'
AGRICUI,TURA|, SfJ(-'TOIIS
:\:l
NN
\$\\\'N
.N
PolENTIAL
BUlrEltlS {}ROSS O!1pU1 Bt
POTEN'TTAI, RI'N!!1lS
l
S',
{F
I
i
W
PotENlIAl, BEill)lItS GROSS
lJUl PUT
l]Y
,"4,e",r,,+Jr!'J,3i9' 3'$"r"ir,i't,!"i",ir.fr.f
PoTDN TIAL
aENEFITS
-
GR
I
POTDNTIA' BENE'ITS GROSS OL1'PL]1 BY
't0t02t2011
ItorENanL BDNEI'irs D.ponr B\ srcl.rR
H
l";
PoTENTIAL DENEFITS
-
INPoRT BY
SECTOR
.$, ',.+.$.r|.S,S d.S,P
PO'IIINTIAI, BE\IEFITS
IMPORT BY
PO?!N1'!\L BEIiE}'TS TXPORI IJ\ S!C'I OR
PolENTLu, BDNEFTTS
-
In]tpi)Rl Bf
.
N'
-!:i1
!i,, d
t=l
^:.1
-
-
:
-
10t02t201'l
I'OT'NTIAI,
BI]NEFITS
I}IPORT BY
iilr
Porr\tt'\r BE\Iit11
-
soct,\t, t!aNll'11'
|M;;ifu
t:!: :i
\\\\
ABILITI OF BENEFIT CAPTURE ExIsrINc PRoBLEMS
'fr
E'Z
ExlsrIN_c PRoBLEUS
H,sh labor fo.c in aericultuE ecior: ltnml indctri.l
secior.a.
not
abeorb
lote
oflabor=>
l.r' ae]
Slow sifuctufe change: Cmp
!$dlction
st occnpies a
Lo{
quahiy
ol aeri
?&duct
U.stabililiiyhsk :
pnce/wearher
Envircnnenial
polhiion
'
rhe confibuiion of loresiry in econoni.
grwih
toner
:j):
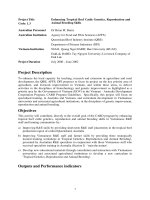
R ESEA RCH CR OP PRIORITTES
Period
of
2017
-2O2O
Discussion Papet to( Agticultute sectol
Pnofties Wo*shop
Ha not, 14 December,20L0
Population
.
Population: 87 mil.
persons
.
Population density: 260
person/km2
r
Urban
population;
28.11Yo
.
Rural
population:
71.89olo
Agricultural
Share
in
GDP
s r.tr .iom i 1e3t
4r
arre3 6fi hlm ri mioij cDPtu br
lkue
cs.
:oosl
t-,.
*L ACnrevement
|
.
Agr. Grovlth
rate
susta
n ng
at
37o
.
Agriculture
increase
by
2,2Y0
.
Forestry:
3.8%
and
.
Fishery: 5.4%
Land use structure
.
Agricultural Land
accounting only for
290/0
of Natubl area
r&r,r.nd
rNon-&r.bd runEdcoppinq
Structure
of
GDP,
%
:
Share ofAgnculturc
-_zk
(icludingForestry
and Fishery) in GDP
tend io declining,
accounting lor
22.7o/r in 2AO9
(400/0
in 1990)
i;isi;ft;;;;da r;;;
,
Achievement, 2009
I
*___
.
Living standard imprcves; Poverty rate:
12.30/o
'
GDP
per
capita: 1,100USD
.
Slart wilh
program
on ru?l deveoprlenl
.
Infrastructure improved
._l
Top 10 Exported commodities 2008
I__
1. Crude Orl 10.5 6. Wooden 2.78
2. Garment 9.10 7. Electronic 2.70
4.74 8 Coffee 2.11
4.56 1.60
2.89 10.
Coai
1,.44
Area of Selected Crops 2000-2010
1000ha
Export of Agricultural
Products 2009
E
Asi.,ftd . *br ! Foreaa r frkiE
Area of Selected Crops 2000-2010
1000ha
Planted Area of
Selected
Crops 2009
Ric.
production
h Vietn{ d
1t86-2008
2009 vs 2010,
o/o
Crops Yieid
-3
+23
I\4aize +49 +,18
cassava +114
+102
12
+30
Groundnut
+2 +46
Soybean
+18 +22
2009 vs 2010,
o/o
Decisive Factor
of
Increasing
Production:
Productivity
@Itl
!q-Il
Factors
effecting
to crops
Productivity
)
Varietles;
r
lclvl
(Fertilizers,
Water, IPNlvl,
rPM )
i) Post-harvest handling
,
Hard-working and skill Farmers
VN Agriculture:
Constraints and challenges
-
Production is mainly based on natural
advantages
(need
market oriented)
-
The main share in agriculture GDP is crop
production
VN Agriculture:
Constraints and challenges
, Value
of agricultural
production per
ha is
low
(1,100USD/ha).
Producton cost is
high,
product quality
is
ow.
.
Post-harvest handling is
poor
(13olo
loses
for cereal, 25 30o/o for fruit, vegetable).
Low
percentage
of
processed products)
Constraints: Main issues related
to
science and technology
)Produdion
was not
sustainable, deoendino on
the weather conditions
ii) There is big
yield gap.
ii) Redudion
trend
in
orowth of croo Drodudion
(5.20lo
in
2000,4.6%
jn
2004,3010 currently).
iii) No strateoic olan. leadrno to the common
''Dhntinq-ifestroyinq"
situ;tron.
(2001
to 20091
101,00dha litchi; 23,000 ha coffee; 40,000 ha
Constfaints: Main issues related to
science and technology
(Cont)
CDp
yield
has
ncrea*d,
but ow
-
Ri@: VN r 5,4 ton9ha 6,2tons/ha in China,
japan,
-
Maize:vN 4 tons/ha us:8tons/ha.
'
Peanut: VN:2tons/ha,3tons/ha n china and neary
6 tons/ha in Israel.
-Soybeanr40-
50% of averaqe,
v)
Postharyest loss was
sanin@nt,
number
ofva.iefies
used was too hGh rovei 300 rce vaneh* n ule whole
country). Prccsled
prodlcts
make up a sma I
Reasons of Constraints
i) Enphastzed too nuch on the applEd research
and less emphaszed
on basic
research
ii) Research co aboration has
qosrcssed
but has
not
net the requirenents
ii, Research oukones were not sustainable, the
application of nany rcsearch outcomes
are
not
stablq no rcsearch strategies.
Future
Orientations
4
I Overall Taroets
I_
Sustainable Agricult!re
Prosperous Rural Areas
Wealthy Farmers
Opportunities
.
Increasing investment in Agriculture
(especially
for
irrigation
works)
-
Renovation in
policy (land,
commodity
consumption, credit
for
the
poor )
.
Higher investment in agricultural
Science
&
Technology
Objectives for
Agriculture
Develpment
-
Sector's value increase at 2,60/o/year, of which
food crop increase 1,lqolyear, industrial crop
3.84/o/
yeat,
lruit
4.3o/a
lyeat.
-
Production of45.2
million
tons of
food
(rice
39.6 mlllion tons, maize 6
million
tons) in
2015 and 48.8 million tons
(rice
41.3 million
bons, maize 7.5 milhon tons) n 2020.
-
Export turn-over in 20151 11 billion USD; 12
billion tiSD in 2020.
-
stop importing maize, soybean
Measures for Implementation
:
3 Pillars
1. Science & Technology
2. Enterprises
(Capital,
Effectiveness,
Quality )
3. Policies
(Land
acc!mulaton, stimulus
package
for mechanization and
investment for infrastructure)
Research Priorities
1. Plant Breeding
2. Integrated Technology focusing on improving
effediveness
of
input
(s€eds,
fertilizers, labour,
3.
Post harvest Handlings
4. Natural resource management
5.
Food
safety
6. Climate change mitigation and adaptation
7. Produdion models
and
policy (Value
Chain)
Criteria
for identifying
priorities
.
Priorilies based on compelit veness: i) Hiqh;
ii) I\4edium and rii) Low.
.
Priorities based on Exoort/Imoort: Exoort
group
Oice,
coffee, rJbbei, bagk
pepper,
casnew, cassava,
peanur)
ano Kepracrng
import
qroup
(maize,
soybean and cotton).
.
Priorities
based on Social
role of the
products
.
Combining approachesr competitiveness and
50crar
rore
CroDs of
hiqhcomDetitiveness
t'
il
:
5. Tea
.
6. Black
pepper
r
8. Fruits
(Pomelo;
Orange; Mango; Dragon
Crops of
low
competitiveness
r
2.
Cotton
.
s. N4llberry and silk worm
i
6. Litchi
.
7. Longan
r
8. Pineapple
.
9, Banana
RESOURCES;
I
2, Research capacity
l
tl
I.
' .s
o,rb,iomhu;
,hzoEl@archinsljujtes,|ikeA5I
mab, tB,
Dranr Dmtdbn
and l;im no b.hnoboy.
,
!.c* n oualrled s ent sis
in hvbl
d
d.e
resrch: cbfle;
cashs; suqa€ne, Pepper, cdonul P€nut,
enouoh h'oh duar'r,en '8tu'.5 i27
ph.D
a,ii 9l Ms not
'n Ld'onm6tuna,r PPa, !or^
i 9rNcv
D ^
don t hde em6rr read no *ren0st n
r€vcoDs
le a trus,
rc abd b shofriem ]earlr Doie.is
6
Crops of medium
competitiveness
.
1. l4aize
.
2, Peanut
.
3, Sugarcane
.
5. Coma
i
6. Flower
.
7. Coconut
.
B, Sedge
RESOURCES:
1, Research
opportunities
The
Gov€rnment
has omh tted to spend 29d of state
openditure for esearch researcll
.
Crops
vadeties and anima bred improvement
r Inftd+ructures ha@ ben uroraded In mon of
re.r.h n4itutions wfth draloan of 60 million USD.
setter linkace and @peration through re-organizlnq
Th€ Go@rnment nven h oveBea oostoraduate
balnLnc wrh the budodofT 8 millroriLJ5D/vea
The aqiicultural b ote-chno
oqy
proqram
a { alocates
a
sqnihcant
budoet for oveBea
postqraduate
t6ininq,
The Government allows tor commercia
izino new crops
Challenges
for research
.
Lack of
leading
scientists.
I
Beside the advantages,
the
independence mechanisn'r and self-
responsibility to organization and finance
will
create the
focus on the work
involving
getting
income to cover salary
ano omer expenses,
.
Lack of research strategies is a
great
challenge,
hampering the slrstainability
of
research
priorities
Challenges for
research
r
Relatively decreasing in investment for
agriculture
(o/o
of total
investment).
.
2000: 13.8
.
2005:
7.5
.
20081 6.s
.
2009: 6.3
r
VN is and
still
will
be
Agriculture-based
economy,
.
Key
products
are for export, so need to
improve competitiveness
.
Higher
profit
from farming
r
Higher income for farmers
.
Harmonizing Agriculture-Rural and
Farmers
Development
Challenges for
research
.
Relatively decreasing in funding for
agriculture research
(yo
of total state
expenditurc for S&T)
,
1996:13.1
.
2000:9.1
.
2005:9.4
Thank
you
for
your
attention!
The Aclievetn€nts
of Arimal
Prodrctior
During Recent Ycars
l h! iraru ollivdsrocl
Foltud
vlLLLe l,aslir@sed tin'n l8 9%
rn L99sti1791inllJ03
Avenge
gro\*h nrc
is7%pq
retu
Lnenock nunrb!6
den0e rhc 161 l0
!ca6
hile rnftxsLd.l
Nlcd
produclion
rn r.rsed fto l3nlLlnnr MTir2000ro
1 63 nrLlionMl in 2009(l foldl, grofih
mle of 6.J-7 0ti
p.r
r0/02/207r
The Achievemeltlt
of Animal
Production
During Recent Years
SCIENCE AND TECIINOLOGY IN
I,IVI]STOCK PRODIJCTrcN AND
DEVELOPM0NT lN Vllj' lNAIvl
DI.IRiNG RECENTYFARS
The Roles
ofLiv€stock in Eco-social
Deveroem€{
in
vidnan
.
Contrjbutin!u k
(r!uhurrldn{.4.d
"n
d,d!hai!ir'!
ioFe
Js lhc h
!he,orcdi
drr\
nu
i ol linJ
.
Iom.eliicrc6.ddefrsdolliwlo.ltrodFsml.almd
.
lmprovng!g ilrc.nllynudlonxl{xlu\ol depeopleswell
.
Scnin!a M iilpd{antmcdhe som! oarlDo$ vieinan
70/02/2077
TEE LIVXSTOCK Rf, SEARCH PRIORITIES
l\.''l Ht IDRIOD Ol z0lI2015
trtu,.trtn4.r!!n,r\nt6\
r
I
t,1^4ttt tt
bct
Thc Chrllcnges in Lircstock Pfod tr.lion
.nd D.relophent in vidrnrm
tih hn 4
4
)rei rbt
qNt
Lar ri.t
udin
T[c Chlllrngcs in Li]cslo.k Productiod
,nd Der€lopnrcnt in vidnem
2
R€search Priority in
lhc
Period
o{2011-2015
q]!aiL(!tnle
c6i\!),
70/02/2077
Rese!rch P.inrn) in rhc
Pr',o,lofl0ll
20l5
r L !1r riL ! L,ih !!:!^oD!
ll[s!],\l{cu c^lnBtl-l t t R!:Stt]lRC|l C,\P,\tIt.n Y
uqii h,.o'nf dsodiiitr.li.dhhr,i ro.hr vhr)
Rttst,\ll( lt caP]\BlLlrY
'h.cov{nneatBldgetra'R$e.rch
ciadi.h!'!]'!r!}rsq,]!]
!! )l ,!i!if{i{E!^(
ouhG. ciilri tr
(
cnr,! rcurli
RESIARCfl C.rPtI!|t.lT\
t 4 k "/
rtl,4
aqa
vtue
h t.)rn^ | n, *tu r
3
L0/02/2017
RESEARCH CAPABII,IT}'
lnd!4w'ltrdia4Id.fu d4r,,h$n
rdi.btIt,6.tch
4q4r dpa
d
t4!tu4\ rd@qd
natus4tui
I i 8t4r,\
t.4 | ttklqDdd
qat
ri*q6 b6!q4
MUCH OF TI{ANKS FOR
YOLTR ATTENT]ON
4
10to2t2011
ul'e*i9hfud'!qrttqjil
Remarkab
e
ncr€se
of
product
vity
n Mekonq catfish n
ponds
Ms fioh 30-
40
lontha/yeaf to 400 soolonth./yeaf
In
shnmp cullu€lhe sigr f €nl
rncease of
produclivity
also increased
rrom !00500 ks/cfop
to 2000
2 500k9/crop n sem
-intensive,
a.d 1 50 0-
20C0 kg/crop
lo
4000
5000kq/crop in
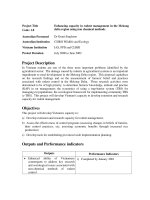
THE RESEARCH PRIORITIES
IN FISHERYSECIOR
THE REAEARCH PRIORITIES
IN FISHERYSECTOR
.
An average
productivity
of
carp culture in wide range of
environments has increased
from 900k9/ha
peryear
to
2000k9, while tilapia culture
has increased from 3-4
tons/ha/year to 20
tons/ha/yeaa.
THE RESEARCH PRIORITIES IN FISHERYSECTOR
.
More than 40 species of
fish, mollusc
and crLrstacean
species have
been
domesticated
and used
for
aquaculiure culture in
freshwater, brackish watef and
marine environmenis
10t02t2011
THE RESEARCH
PRIORITIES IN FISHERYSECTOR
. Aquaculture has developed to
use off-farm inputs such as
feeds, chemicals, energy etc.
RESXARCE PRIORITIIS TN FISH trRY S[C'I'OR
.
New fishing technologies for
off-shore exploilalion includino
selected
gear
for
pelagic
species
and tuna are the
signif icant achievements in
fishery
sector
REStrARCII PRIOR|TINS IN NISIII1RYSECTOR
d iversification
of cu
ltu re/fa m ing
systems were intensively carried
out. Thus,
productivity
ofthe
lradition systems such as
integraied
and
polycLrllure,
rice-
cum-f ish/shrimp systems were
much enhanced
THE RESEARCH PRIORITIES IN FISHERYSECTOR
. Differeni farming systems slch
as rice/fish-shrimp, intensive
shrimp and
Mekong
calfish;
cage culturc and
marine
cage
cullure in
open sea;
etc. have
been developed and
introduced to aquacu ture
practices
RXSf,ARCII PRIORIIIXS IN IISHf,RY SXCTOR
2. Research
priorities
in the next
period
Research
priorities
in
the next
period
. naual^^n6hi ^{ <6a.1
production
and
grow
out
technologies
for
allfish,
mollusc
ano cruslacean
specres
Rf,SDARCF PRIORITIESIN FISHI RYSf,CTOR
New farming
systems such as
intensive shrimD. fish culture
([rekong
catlish, tilapra,
Inlenstve snflmp, cage cu Iure In
reservorls
ano open sea),
't0t02t2011
RESXARCE PRIORITIES IN FISIIERY Sf,CTOR
.
Research on diseases and
measures for
prevention
and
treatment as well as
environmenial management
were intensively carried Jor most
economrcal specres sLrcn as
lvlekong catfish, black tiger
shrimp, lobster
RESXAT'CH T'RTOI{ITTIS I\ I'ISHERY SOCTOR
.
Research on the social and
socio-economic issues to assess
lhe impacts of aquaculiure and
fisheries to development of rural
areas as well as market surveys
and ma*et chain analysis were
caried
oul by a number of the
rcsearch
institutes.
RDStrARCII PRIORITICS I\ TISNtrRY
SDCTOR
.
Long line technique for catching
tuna and trapping facility to
catch swimming crab are
well
developed and applied widely in
fishing
practices
Rf SEARCII PRIORITIES I\
FISIINRYSECTOR
.
The dissemination ofthe
proven
technologies could be done by
the research, education
institutions or themselves
national of
pfovincial
exlension
RNSD RCII PRIORITINS
IN
FISII'iRY
StrCTOR
.
The surveys on fesources of
some economical importani
species, especially in deep sea
were carried out.
.
The fishing
technologies
for
open sea
pelagic
and coralfish
species
were
developed.
RESEARCH PRIORITIIS IN FISHIRI SECTOR
3. lmpacls ofthe research and
extension to the sector
development at farm level.
.
Through out exlension channels
the tesearoh results are
delivered to lhe farmers/users
very
frequently.
3
RESF]ARCH
PRIORITIES
IN FISHf,RY STCTOR
.
famerc/prcducers
were dirccly or
indireclly involving lo
ihe research
and development
projecls
l
.
throuoh this orocess
ihev are
able
lo eniance their
knowledqe and
expeience ihatcan
help them to
imprcve thelprcduciion
and
economrc eflrcrency.
REStrARCH
PRIORIIIES
Ti f ISHERY Sf, CTOR
4. New dev€lopment
trencls
and
the challenges
Pdme lvlinisier apprcved
the stralegy
for lisherr seclor
iof
Deiod
201r
2020. Soine
objectives of lhe
'
The fisheies seclor
is
bascally
i.dusinalized and modernized
.nd
w conijnue
its comprchensive
and
sustainable
development to become
a laaescale
commodity
production
10t02t2011
RESIARCE PRIORITIIS
f\ FISIIERY SECIOR
.
Farmers
also are inieresled
in
environmental and
disease
management, aware
about
safety and
quality
issues and
learning about the
market and
market issues.
IU]SE{RCH
PRIORTIIES IN
FISIItrRY SECTOR
Challenges
.
development
is still vu Inerable,
unsustainable
(for
example
I\,4ekong
catflsh, black
tiger) as this development
was stillrelying on the
expanslon of the
aquaculture aleas
or expanding
flshing
grounds
involved
with large number
of
producers
and using more
resources
RESEAIICH
PRIORITIES
tN I'ISH'RY SECT'OR
Fishery economic
actiivity:
.
30-35%
of GDP in the agrojorestryJisheri€s
.
annual
growth
rate of
fishery
production
lrom 8,0-10%.
.
Seafood
exportturnover
U.S.
$
8-9 billion
.
Totalaquaculture
production
should
r€ach
6.5 to
7.0 million tons,
which accounts
for 65-
70% of the totalfishery
production.
RESEARCTI
PRIORITIES
tN !TSHf,RY SECTOR
.
The increase ofvalue
and
quality
is behind
increase
pf
oduction
volume
.
quaLity
ofmany
aquatic animals
ncluding nsh,
shrimp
and mollusks
species has decreased
due
to lnbreeding
ovef several
generatrons.
.
The
price
of feeds
foraqualc an mals
n
aquacu ture
is very high and
ncreas ng time by
timewhile nulrlents
and
quality
olfeedswerc
4
10to2t2011
RESEARCII PRIORITIES IN TISIItrRY StrCTOR
.
Environmenla
poluton
and diseases are stl making
aquaculiu€vulnerabewlh unpGdicied outpuls
.
E@.omicefficenry otmadne and deeF sea fshins is
.
g)
Lack ofthe consetoalion technoloqy ofcaughtaquatic
.
h) Lack of esoufes a*e$ment oI the eonomic
mponantspeciesand ish nq t$hnolooy
.
) The cifraiechanoes and ootenlial moacts on lhe
isherv and
aquacunue suFsecloE
rs dbvrousl!
however lack of exoenenes and eoac lv lo assess tlie
r sks and identiiy ni€sues to ove@me ihese
I
sks
muld be $lielissu€s in lhe newdMde
RESEARCH PRIORITIES IN FISHERY SECTOR
5.
Reserrch
priorities
inth€ next
period
.
Inseed
produclion
and
genetic
seleclion areas
d€ng{reninobrcdinoprcoGfrfresfo
ec ic
pahosen
r€e
(sPF)
seedandhighquaityprcdudlremgwoutsysdnE
cenftgloionsPFandseedquaiy
Rf,SEARCH PRIORITIES IN FISHERY SECTOR
In disease
and
envtrcnmenlal areas
n
'qu,.u iuE
p6di@
b 4dp spprior
coinb n nq tth use d
prob
or cs to ma dain be bt anced
d||uruecoooyioensuGhiohqualvand$felypmdu.b:
veinames
Good
Aq$cu ture PEci ces
MGAP )
or
5
MBMP)forrhe
rry
spe( es in difieren bmins s!3cne o
RESEARCII PRIORITIES IN FISTII]RY SECI'OR
RESDATTCH PRIOTUI]IS IN FISHI]RY SI]CTOR
Thanks for
your
attention
Rf,SEARCH PRIORITIDS
TN FTSHERY
SECTOR
.
In
arca
of marine fishenes
idenlifcat on oi the impo.tant species n dep *a
and season available lor f shing
-
mpovemeni of lhefshingtechnooqyand
propef
preserualion
techno ooy
for
these specles
.
In area of bioactive compositions
-
Extraciion of the biologr€l active @frposilions ilm
@sted ofaqualicanimals
serving as maler a inpuls
tor olher industdes
5
't0t02t2011
lmpacts of the research and exlension
to the 6ector development at farm level"
]HE RESEARCH PRIORIIES IN FISHEW
SECTOR
6