Project group 7_vnuis
Bạn đang xem bản rút gọn của tài liệu. Xem và tải ngay bản đầy đủ của tài liệu tại đây (1.5 MB, 19 trang )
VIETNAM NATIONAL UNIVERSITY,
HANOI INTERNATIONAL SCHOOL
-------------------------------
Subject: PROJECT
Report Final Examination
Class
: INS3008
Lecturer
: Hung Ha Manh
Topic
: Customer Analysis
Group number
: 7
Member
: Nguyen Anh Tu - 20070998
Ha Thi Linh - 20070946
Ho Thi Kim Oanh - 20070970
Le Minh Trang - 20070991
Le Thi Huyen Trang - 20070992
Hanoi, 17th October 2023
TABLE OF CONTENTS
CHAPTER 1: INTRODUCTION ........................................................................................................................ 3
CHAPTER 2: DATA OVERVIEW ..................................................................................................................... 4
1. Dataset 1 .................................................................................................................................................... 4
2. Dataset 2 .................................................................................................................................................... 5
3. Dataset 3 .................................................................................................................................................... 6
CHAPTER 3: EXPLORATORY DATA ANALYSIS ........................................................................................7
1. Pre-processing ...........................................................................................................................................7
2. Data Visualization .....................................................................................................................................9
3. Observations After Visualizing Data .................................................................................................... 12
4. Exploratory Phase General Conclusions .............................................................................................. 12
CHAPTER 4: MACHINE LEARNING ALGORITHMS ............................................................................... 13
1. Preprocessing .......................................................................................................................................... 13
2. Linear Regression Model ....................................................................................................................... 14
3. Bayesian Ridge ........................................................................................................................................ 15
4. Lasso Model .............................................................................................................................................16
5. Polynomial Regression Model ............................................................................................................... 17
CHAPTER 5: SUMMARY ................................................................................................................................. 18
CHAPTER 6: CONCLUSION ............................................................................................................................19
CHAPTER 1: INTRODUCTION
Boston's culinary scene is both diverse and vibrant, offering countless culinary
experiences for residents and visitors alike. However, navigating the endless restaurant options
can be a daunting task, often leaving diners unsure of where to find their next special meal. It's
not just a matter of finding any restaurant; it's about discovering hidden gems that always deliver
a 5-star dining experience. Against this backdrop, we begin our journey to demystify Boston's
restaurant world through data-driven insights and predictive analytics. Our "Boston 5-Star
Restaurant Prediction" project strives to provide a solution that empowers diners and restaurant
owners with the ability to accurately predict restaurant ratings.
The following project was created by Enrique Alvarez, Diego Cabrera, Shakti Das, Cara
Donovan and Enrique Esparragoza under the guidance and supervision of Professor Mohammad
Soltanieh-ha. Leveraging machine learning algorithms, our goal is to create a model that can
determine a restaurant's rating based on a variety of influencing factors, including location, price,
type of cuisine and other appropriate variables extracted from the Yelp review dataset. To start,
we preprocessed the data and performed thorough EDA to better understand the factors
important for model training. We then use four models to predict restaurant ratings: linear
regression, bayesian ridge, lasso model, polynomial regression. For each of these models, we
evaluate 4 performance metrics: RMSE, MAPE, MAE and R-squared.
Ultimately, we aim to provide a valuable tool for both diners and restaurant owners by providing
more accurate and data-driven insights into what makes a restaurant worthy of recognition. 5-star
rating in Boston's dynamic culinary scene.
3
CHAPTER 2: DATA OVERVIEW
The data file is available on Harvard Dataverse and contains information about 2,664 Boston
restaurants that were reviewed on Yelp from October 2004 to August 2020. We selected 3
datasets (restaurants, reviews, and neighborhood), with the right drivers helping the restaurant
receive 5 stars in the Boston area. The data was processed by the Boston Area Research Initiative
(BARI) and divided into the three data sources mentioned above.
During this initial discovery phase, we dug deep into the data to understand the meaning of each
variable and the relationships between our three data sources.
1. Dataset 1
Here come the datasets, in which Dataset 1 - Restaurants (Yelp.Restaurants.csv) contains many
variables, each providing valuable insights into the restaurant landscape of Boston explained
below:
restaurant_name
shows restaurant name as posted on Yelp.
restaurant_ID
unique number for each restaurant.
restaurant_address
postal address as posted on Yelp.
restaurant_tag
shows tags used to describe a restaurant (cafe, restaurant, american,
chinese, italian, etc).
rating
average rating based on reviews, this rating goes from 1 to 5 in 0.5
increments.
price
estimates cost of food with Yelp's classification system from
review_number
total reviews the restaurant has received.
4
unique_reviewer
number of unique reviewers who reviewed the restaurant.
reviews_MMM_YY
number of reviews in a given month.
restaurant_neighborhood shows which neighborhood the restaurant is in according to Yelp.
GIS_ID
identifier for the land parcel the restaurant is in.
CT_ID_10
2010 Census Tract ID number.
2. Dataset 2
Dataset 2 - Reviews (Yelp.Reviews.csv) has a large number of variables, each of which offers
insightful information on the Boston restaurant's review, as follows:
restaurant_name shows restaurant name as posted on Yelp.
restaurant_ID
unique number for each restaurant.
review_date
The date review was made for the restaurant
reviewer_name
The name of the person who wrote the review
reviewer_origin
The origin or location of the reviewer
reviewer_profile Information about the reviewer's background or preferences
history_1
one of the fields to store additional historical information about the
restaurant
history_2
Another field for historical information
history_3
A third field for historical data
5
3. Dataset 3
Dataset 3 - Neighborhoods (Yelp.CT.csv) has variables that provide information about various
aspects of restaurants within the identified neighborhood
CT_ID_10
represents a code or identifier for a neighborhood as posted on Yelp
NUM_REST
The number of restaurants within the identified neighborhood
RATE_REVIEWS
The rate of reviews received by restaurants in the neighborhood is according
to Yelp
RATE_REVIEWERS The rate of reviewers providing feedback or reviews within the
neighborhood
AVG_RATING
The average rating of all the restaurants in the designated neighborhood
PCT_DLRS_1
The percentage of restaurants in the neighborhood falling into the lowest
price range
PCT_DLRS_2
The percentage of restaurants in the neighborhood falling into the secondlowest price range
PCT_DLRS_3
The percentage of restaurants in the neighborhood categorized as mid-range
or moderately expensive
PCT_DLRS_4
The percentage of restaurants in the neighborhood considered high-end or
expensive
PCT_DLRS_NA
The percentage of restaurants for which the price range is not available or
not specified
6
CHAPTER 3: EXPLORATORY DATA ANALYSIS
Once we have imported the data, we will conduct an exploration phase to learn more about the
data, uncover insights from the start and identify areas or patterns to dig into.
Describe the data: we use the info() function to get a concise summary of each Data Frame
1. Pre-processing
1.1 Check the data overview
The purpose of calling restaurants.info() is to get a quick overview of the structure and content of
the "restaurants" data frame. This information can be valuable when working with data, as it
helps you understand the data's characteristics, such as missing values and data types, which can
inform subsequent data cleaning, analysis, and visualization tasks.
This line of code is used to check the overview of the data in the 'reviews' DataFrame.
The results show that 467,105 restaurants.
7
This line of code is used to check the overview of the data in the 'neighboroods' DataFrame.
The results showed 181 neighborhoods.
1.2 Replace string values with numeric values
Replace the string values in the "price" column of a data frame named "restaurants" with
numerical values based on a mapping defined in the price_dict dictionary.
After executing this code, the "price" column in the "restaurants" data frame will contain
numerical values instead of the original string values.
1.3 Summary of statistics for the ratings
This code is used to calculate and display descriptive statistics for the "ratings" column in a data
frame named "restaurants".
By using `.describe()` on the "rating" column, can quickly see a summary of statistics for the
ratings of the restaurants in the "restaurants" data frame.
The results show that the average rating across all restaurant data is approximately 3.5.
1.4 Determining the number of unique reviewers
8
When you execute this code, it will return the number of unique reviewers based on the values in
the "reviewer_name" column. In this case, there are 64,688 unique reviewers in the data.
1.5 Count the number of missing values
The code `rest_reviews.isnull().sum()` is used to count the number of missing values (null or
NaN values) in each column of the "rest_reviews" data frame.
Have 356 restaurants in the "rest_reviews" data frame don't have associated reviewers. This
observation is based on the count of missing values in a specific column that represents the
presence or absence of reviewers for restaurants. If there are 356 missing values in this column,
it suggests that there are 356 restaurants without associated reviewers in the merged data frame.
Initial Observations:
It looks like the price variable in the restaurants data frame is a string due to Yelp's
classification system. We converted it to integer.
In the reviews data frame, not every reviewer reviewed every restaurant. 467,105
restaurants but only 466,749 reviewers.
In the neighborhoods dataframe, not all neighborhoods have restaurants with reviews.
Looks like 169 of 181 neighborhoods have restaurants with reviews.
2. Data Visualization
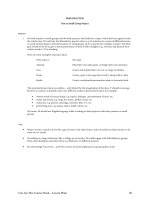
2.1 Correlation matrix
9
The graph visualizes will show the correlation coefficients between pairs of numeric
variables in the "adj_rest_reviews" data frame. The intensity of colors and the numerical
values in each cell indicate the strength and direction of the correlation. Positive values
suggest a positive correlation, while negative values suggest a negative correlation.
There is no feature that is correlated with the target feature.
The variables don’t have a negative correlation.
Variables like history_2 & history1; history_3 & history_2; history_4 & history_2,3;
history_5 & history_2,3,4; reviewer_reviews & history_1,2,3,4,5 are having a strong
positive correlation. A correlation coefficient value greater than 0.7 indicates
multicollinearity.
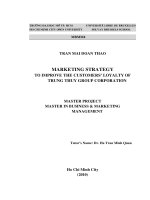
2.2 Visualize data with charts
The resulting scatter plot will show individual data points for each restaurant, with the x-axis
representing the rating and the y-axis representing the number of unique reviewers. It will help
you visually assess whether there is any correlation or pattern between the restaurant's rating and
the number of reviewers.
10
This is a violin plot that visualizes the distribution of restaurant ratings vs. the number of unique
reviewers ("unique_reviewer") for the restaurants in the "new_restaurants" data frame.
The resulting violin plot will provide a visual summary of how restaurant ratings are distributed
based on the number of unique reviewers. It allows you to see not only the central tendency but
also the shape of the distribution, the presence of multiple modes, and the density of data points
at different levels of ratings.
The resulting bar graph will show different cuisine types on the x-axis and the corresponding
restaurant ratings on the y-axis. Each bar represents a specific cuisine, and the height of the bar
represents the average or aggregated rating for that cuisine.
The resulting bar graph will show different cuisine types on the x-axis and the number of unique
reviewers on the y-axis. Each bar represents a specific cuisine, and the height of the bar
represents the average or aggregated number of unique reviewers for that cuisine.
This type of visualization allows you to compare how different cuisines are associated with the
number of reviewers and identify which cuisines tend to attract more or fewer unique reviewers
in dataset.
11
The resulting bar graph will show different cuisine types on the x-axis and the count of
restaurants for each cuisine on the y-axis.
Each bar represents a specific cuisine, and the height of the bar represents the count of
restaurants belonging to that cuisine. This type of visualization is useful for understanding the
distribution of restaurants across different cuisines and identifying which cuisines have a higher
or lower number of restaurants in dataset.
3. Observations After Visualizing Data
By looking at the plot of rating vs number of reviewers, we learn that the majority of
reviews are happening between the 3.5 and 4.5-star range.
Highest fated cuisine is bakeries, lowest rated is fast food.
Four types of cuisine stand out as the ones receiving the highest number of reviews:
American, Italian, seafood, and Japanese.
Four types of cuisine stand out as the ones receiving the highest number of reviews:
American, Italian, seafood, and Japanese.
Pizza is the most used tag by restaurants, this means that there is a high number of
restaurants selling pizza in comparison to other cuisines.
4. Exploratory Phase General Conclusions
We are facing data regarding 2,664 restaurants in the city of Boston and each restaurant
has its unique characteristics and variables that might affect rating. Prioritizing the most
important variables affecting rating will be crucial for the success of our model.
The data is clean, thanks to the processing already made by BARI, but we will still need
to manipulate and convert some of our variables into dummies for them to work with a
regression model.
The data relies on the assumption that the user understands what a census tract is. In
order to present final results and recommendations we will need to translate census tracts
into something more commonly used like addresses, counties or zip codes.
12
CHAPTER 4: MACHINE LEARNING ALGORITHMS
Methodology: We used four models to predict restaurant ratings:
Linear regression
Bayesian ridge
Lasso model
Polynomial regression
For each of these models, we evaluated 4 performance metrics: RMSE, MAPE, MAE and Rsquared.
1. Preprocessing
This is essential information about DataFrame 'new_restaurants', which serves as the foundation
dataset for our upcoming model. This DataFrame has been meticulously prepared, missing
values handled, unnecessary columns removed, and categorical features converted into a suitable
format for our regression analysis. It contains important data that will drive a predictive model
designed to forecast restaurant ratings with 8 rows × 23 columns.
13
Prior to building the model we will preprocess the data, drop useless variables, and replace
missing values.
We will drop the following fields as we won't need them for the regression model:
'restaurant_name', 'restaurant_address', 'restaurant_tag', 'restaurant_neighborhood'
229 missing values for 'rating'; we will replace them with 3.5 which is the mean rating.
665 missing values for 'price'; we will replace them with 1.67 which is the mean price.
There are two missing values for cuisine categories 3-6. We won't use these fields and
will drop them.
2 missing values for cuisine categories 1 and 2. We will impute with the most common
cuisine type.
We will convert cuisine categories 1 and 2 to dummy variables.
2. Linear Regression Model
14
Scikit-learn library in Python to create a linear regression model, providing many machine
learning tools and algorithms for data analysis and model building.
The code is used to compare between the actual value (ytest) and the predicted value (y_model)
on the test data, and then only displays a small portion of the results (first 50 lines) for testing
check.
3. Bayesian Ridge
15
4. Lasso Model
16
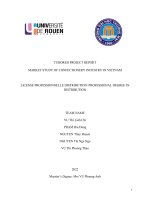
5. Polynomial Regression Model
After analyzing 4 models, we have the following table of results:
Metric
Linear regression Bayesian Lasso Polynomial regression
MSE
0.51
0.46
0.54
MAPE
19.4%
18.8%
20.3% 22.19%
MAE
0.53
0.5
0.53
0.62
0.17
0.03
-0.54
R-squared 0.096
17
0.85
CHAPTER 5: SUMMARY
In this project, our objective was to anticipate the ratings of Boston restaurants. In order to
effectively complete this project, we went through each stage of a business analytics problem.
We started out by defining our challenge and choosing the data source during a brainstorming
phase. All of the data was then cleaned and put through the preliminary exploration stage
outlined in this notebook. We proceeded to preprocess the data once more after compiling our
initial observations, eliminating pointless measurements and replacing missing values in order to
run the predictive models. The Bayesian ridge was ultimately chosen as the best model after 4
others were examined (MAE=0.5). For all of us, it was incredibly gratifying to use this organized
method that businesses use to generate data-driven predictions and improve decisions.
18
CHAPTER 6: CONCLUSION
Following the testing of our four models, we came to the conclusion that the Bayesian Ridge
model, which had a lower Mean Absolute Error (MAE), was the most accurate at predicting
rating. Additionally, the Bayesian Ridge model has the lowest Mean Standard Error (MSE) of all
the models. We had to explain what an MAE of 0.5 meant because it is relative to the data set.
This means that for our model, we could forecast a rating and it might be wrong by 0.5.
Additionally, we have to consider that ratings range from 1 to 5.
Even though we had a winner, we were conscious that these data needed to be interpreted
cautiously. All of the models' R-squared values were low, so we had to be cautious and skeptical
about their accuracy. We were aware that some academic disciplines naturally exhibit higher
levels of unexplained variance, and that the R2 values in these domains are therefore likely to be
lower. Studies that attempt to explain human behavior, for instance, typically have R2 values
below 50%. It's just that people are more unpredictable than, say, physical systems. Since rating
the quality of a restaurant is a very subjective topic in this analysis, MAE rather than R2 was our
criterion for choosing the best model.
19