Learning Techniques for Stock and Commodity Options_8 pptx
Bạn đang xem bản rút gọn của tài liệu. Xem và tải ngay bản đầy đủ của tài liệu tại đây (300.76 KB, 23 trang )
c15 JWBK147-Smith May 8, 2008 10:13 Char Count=
Bull Spreads 195
TABLE 15.9 Bull Call Spread Results and Short Call Results
Price Bull spread Short call
640 −2
7
/
8
−1
7
/
8
645 −2
7
/
8
−1
7
/
8
647
7
/
8
0 −1
7
/
8
650 +2
1
/
8
−1
7
/
8
655 +2
1
/
8
−4
660 +2
1
/
8
−9
or a long put. The net effect is that you have liquidated the bull spread
and are now taking a more bearish stance on the market. Your rationale
might be that the market was only somewhat bullish at higher levels but
has become bearish because of new information or because the UI price
broke a key price support level.
Look at the bull call spread used in Table 15.3 as an example. Assume
the market rallied to 660 the day after you entered the bull spread—the
645 call is now selling for 20, and the 650 is selling at 17. Your choice is
between sticking with the bull call spread or liquidating the long 645 call.
Table 15.9 shows the results at different price levels for these two strate-
gies. Remember that shifting to a short call at this point means that you
are starting out with a loss of 2
7
/
8
. This loss is counted in the results of the
short call. Notice that, in this example, you can never make a profit. The
effect of going naked short the call is to reduce your loss on the original
bull spread by capturing additional time premium if the UI price continues
lower. The only way you can make a profit by liquidating the long call is
if the premium on the short call is larger than the loss on the original bull
spread.
Liquidating the short put makes more sense if you originally put on a
bull put spread because the long put has much greater profit potential than
the short call. The net result is that converting a bull call spread into a short
call will rarely make sense, but converting it into a long put can often be an
attractive tactic if you are now bearish.
c15 JWBK147-Smith May 8, 2008 10:13 Char Count=
c16 JWBK147-Smith May 8, 2008 10:14 Char Count=
CHAPTER 16
Bear Spreads
Price Implied Time Profit
Strategy Action Volatility Decay Gamma Potential Risk
Bear Spreads Bearish Increasing Helps Hurts Helps Limited Limited
STRATEGY
A bear spread is a bearish strategy with both limited risk and profit po-
tential. It is not as bearish as buying a put or selling a call, but the risk is
generally lower than buying a put and is significantly lower than selling a
call. A bear spread is either:
r
Long a high-strike call and short a low-strike call; or
r
Long a high-strike put and short a low-strike put.
This is a popular spread because it usually has a low investment, has
limited risk, and compares favorably with other bear strategies. Many in-
vestors will take the money they would have invested in long puts and buy
bear spreads instead. In many cases, they will end up with greater profit
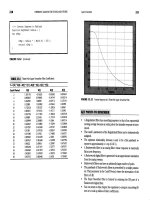
potential if the market moves only moderately lower. Figure 16.1 shows an
option chart for a bear spread.
197
c16 JWBK147-Smith May 8, 2008 10:14 Char Count=
198 OPTION STRATEGIES
3
Profit
2
1
0
−1
−2
−3
Price of Underlying Instrument
40
41
42
43
44
41
46
47
48
49
50
51
53
54
55
56
57
58
59
60
52
FIGURE 16.1 Bear Spread
Note the caveat of being only moderately bearish. Bear spreads are a
good strategy if you are moderately bearish but not if you are very bear-
ish because bear spreads have limited down-side potential. You limit your
down-side potential when you buy a bear spread.
Another use of the bear spread is to enhance the profitability of a long
call or put. This requires that you are already in a long-call or long-put
position.
In any long option trade, you might find yourself in either a profitable or
an unprofitable situation. If you are holding a profitable long position, you
can write a lower strike option to create a bear spread and help protect
your profits. In effect, you have limited your profit potential, but you have
also limited your risk.
Note that this strategy works for both puts and calls. However, you will
be bullish on the market if you are in a profitable call position, but bearish
if you are in a profitable put position. This means that your market attitude
must turn 180 degrees if you are to use this technique for calls. For puts,
this strategy is a signal that you are less bearish than before you switched
to a bear spread.
RISK/REWARD
Net Investment Required
The net investment is the price of the option with the lower strike price
minus the price of the call with the higher strike price. This will always
be a credit transaction for a bear call spread because the lower strike call
c16 JWBK147-Smith May 8, 2008 10:14 Char Count=
Bear Spreads 199
must always be priced lower than the higher strike call. It will always be a
debit transaction for bear put spreads because the higher strike puts must
always be priced higher than the lower strike puts.
Look at an example. The Major Market Index (MMI) closes at 650.30,
the November 645 call is priced at 10
3
/
4
, and the November 650 call is
priced at 7
7
/
8
. Your net investment will be a credit of the difference be-
tween the costs of t he two options. In this case, you will receive 10
3
/
4
mi-
nus 7
7
/
8
,or2
7
/
8
. At the same time, the November 645 put is trading at 7, and
the November 650 is trading at 9
1
/
8
. Here, the trade would be initiated at a
net debit of 2
1
/
8
.
Maximum Return
The maximum return is limited for a bear spread. You will receive the max-
imum return if the underlying instrument (UI) is trading below the lower
of the two strike prices when the options expire.
The maximum profit potential for a bear put spread is equal to the
higher strike price minus the lower strike price minus the net investment.
The maximum profit potential for a bear call spread is the net credit re-
ceived when the trade is initiated.
Assume you initiated the bear put spread by selling the November 645
put at 7 and buying the November 650 put at 9
1
/
8
when the MMI was trading
at 350.50. You will receive the maximum profit of 2
7
/
8
if the MMI is below
the lower of the two strike prices, in this case, 645. Table 16.1 shows the
profit and loss for each of the two options and the net profit or loss for the
total position at different prices of the MMI when it expires.
Another column can be added to this table so you can see the differ-
ence between this strategy and the outright purchase of a put. In this case,
assume you bought the November 650 put at 9
1
/
8
. Table 16.2 shows that
TABLE 16.1 Bear Put Spread Results
Profit/Loss
MMI price 645 put 650 put Net profit/loss
630 −8 +10
7
/
8
+2
7
/
8
635 −3 +5
7
/
8
+2
7
/
8
640 +2 +
7
/
8
+2
7
/
8
645 +7 −4
1
/
8
+2
7
/
8
647
7
/
8
+7 −70
650 +7 −9
1
/
8
−2
1
/
8
655 +7 −9
1
/
8
−2
1
/
8
c16 JWBK147-Smith May 8, 2008 10:14 Char Count=
200 OPTION STRATEGIES
TABLE 16.2 Bear Put Spread versus Put Purchase
Profit/Loss
MMI price 645 put 650 put Net profit/loss Put results
630 −8 +10
7
/
8
+2
7
/
8
+10
7
/
8
635 −3 +5
7
/
8
+2
7
/
8
+5
7
/
8
640 +2 +
7
/
8
+2
7
/
8
+
7
/
8
645 +7 −4
1
/
8
+2
7
/
8
−4
1
/
8
647
7
/
8
+7 −70 −7
650 +7 −9
1
/
8
−2
1
/
8
−9
1
/
8
655 +7 −9
1
/
8
−2
1
/
8
−9
1
/
8
the purchase of the bear spread is superior to the purchase of a put unless
the market drops significantly. The difference is particularly sharp when
viewed on an equal-dollar-invested basis. In this example, you could initi-
ate about three bear spreads for less investment than one put.
Maximum Risk
Maximum risk is different for bear call and bear put spreads. For a bear put
spread, the maximum risk will occur when the UI price moves above the
higher strike price. For a bear call spread, the maximum risk will occur at
the point found by adding the lower strike price to the net credit received.
The dollar risk is equal to the difference in strike prices minus the credit
received.
Table 16.1 shows an example of the maximum risk and the point where
it occurs, 650. Table 16.3 shows the same situation for a bear call spread
with the 645 call sold for 10
3
/
4
and the 650 call purchased for 7
7
/
8
.
TABLE 16.3 Bear Call Spread Results
Profit/Loss
MMI price 645 call 650 call Net profit/loss
640 +10
3
/
4
−7
7
/
8
+2
7
/
8
645 −10
3
/
4
−7
7
/
8
+2
7
/
8
647
7
/
8
+7
7
/
8
−7
7
/
8
0
650 +5
3
/
4
−7
7
/
8
−2
1
/
8
655 +
3
/
4
−2
7
/
8
−2
1
/
8
c16 JWBK147-Smith May 8, 2008 10:14 Char Count=
Bear Spreads 201
The dollar risk for a bear put spread is the net debit paid to initiate the
position. The risk for a bear call spread is the difference between the two
strike prices minus the net credit received when the trade was initiated.
Tables 16.1 to 16.3 show examples of these calculations. Here are two
more examples. Assume you sell a Boeing November 55 call at 2 and buy
a November 60 call at
3
/
8
when the stock is trading at 55. Your risk is
60–55–1
5
/
8
,or3
3
/
8
. Now look at a bear put spread, where you sell the
Boeing November 55 put at 1
5
/
8
and buy the November 60 put at 5
1
/
2
.The
maximum risk for this trade is the net debit of 5
1
/
2
–1
5
/
8
,or3
7
/
8
.
Break-Even Point
The break-even points for bear call spreads and bear put spreads are
slightly different. For bear put spreads, the break-even point is the high
strike minus net debit paid. For bear call spreads, it is the low strike price
plus net credit received. In Tables 16.1 and 16.3, the break-even point oc-
curs at 647
7
/
8
.
DECISION STRUCTURE
As mentioned under Strategy, there are two possible uses for the bear
spread concept: as a trade and as a profit enhancement tool. Both strategies
use the same selection and follow-up strategies.
Selection
Bear spreads can be structured to reflect how bearish you are. You can
make them as bearish as your market outlook. The most bearish call spread
has both legs in-the-money, while the least bearish put spread has both legs
in-the-money.
One critical question is whether to select the bear put spread or the
bear call spread. In general, the risk and reward of the two different styles
are very close, though some investors believe that call spreads are slightly
more attractive. For example, the ratio of the maximum profit potential to
the dollar risk will tend to be slightly higher for bear call spreads than for
bear put spreads. In addition, bear call spreads are credit transactions.
These bull-call-spread advantages do not come free. Some disadvan-
tages are:
r
Call spreads are liable for early exercise if you are short an in-the-
money option. The more bearish you are, the more chance of early
c16 JWBK147-Smith May 8, 2008 10:14 Char Count=
202 OPTION STRATEGIES
exercise. Thus, you might be exercised before having a chance to make
the maximum profit.
r
Puts tend to be less liquid than calls. As a result, the bid/ask spread
might be larger, and you might have more trouble entering or exiting
your trade in the quantity you want.
r
Time decay is working against the bear call spreader. Time is usually
working in favor of the bear call spreader due to the usually greater de-
cline in the time premium of the short call than the long call. However,
note that time is working against the bear put spread because the long
put’s time premium is likely to be decaying faster than the short put’s
time premium.
r
Commissions tend to be a larger percentage of the potential profit than
with other option strategies. Be sure to consider the cost of commis-
sions before selecting a bear spread over other bearish strategies and
before selecting the strike price.
Bear spreads can be selected by looking at their maximum risk/reward
weighted by their chances of occurring, based on the implied volatility or
your expected volatility. This is a two-step procedure: (1) list the ratio of
maximum profit potential versus the maximum dollar risk of all possible
bear spreads; and (2) weight the results by their chances of occurring, as
determined by either the implied volatility or your expected volatility. This
will give you an expected return on all the bear spreads for that instrument.
Unfortunately, this technique requires a computer to go through the myriad
of computations.
Generally speaking, bull spreads are not highly sensitive to implied
volatility—you are both long and short volatility because you are both long
and short an option. Still, the net result is that you are long vega, so it is
best to believe that the outlook for implied volatility is bullish.
If the Price of the Underlying Instrument Drops
Bullish Strategies If the UI price drops and you are bullish, you
could:
1. Hold the position;
2. Liquidate the position; or
3. Liquidate one of the options.
Holding the existing position is the most common tactic. No fur-
ther computations of break-evens and risks and rewards are necessary.
You know what your risk and profit potential are, and, in fact, you might
c16 JWBK147-Smith May 8, 2008 10:14 Char Count=
Bear Spreads 203
already have moved above the point of maximum profit potential. The key
is whether you think the UI price will carry above the point of maximum
return. Holding the position only makes sense if the risk of higher prices
will not hurt the profit in the trade. This will occur only if the UI price has
moved significantly below the point of maximum profit potential.
Liquidating the position makes sense if you have a profit in the trade
but are now significantly worried about the possibility of a further up-
move. You might want to take the profits and eliminate the possibility of
further loss.
A more aggressive tactic is to liquidate either the short call option if
you are in a bear call spread or the long put option if you are in a bear
put spread. This changes the character of the trade to either a short put or
a long call. You have liquidated the bear spread and are now taking a more
bullish stance on the market. Your rationale might be that the market was
only somewhat bearish at lower levels but has become bullish because of
new information or because the UI price broke a key price resistance level.
Look at the bear call spread from Table 16.3 as an example, and com-
pare it with the liquidation of the short call: Assume the market dropped to
640 the day after you entered the bear spread—the 645 call is now selling
for 2
3
/
4
, and the 650 is selling at 1. Your choice is either to stick with the
bear call spread or to liquidate the short 645 call. Table 16.4 shows the re-
sults at different price levels for these two tactics. Remember that shifting
to a long call at this point means that you will have picked up the maximum
profit on the bear spread. As a result, you will be starting out with a profit
of 2
7
/
8
. This profit is included in the results of the long call.
The interesting feature of this tactic is that you might be able to lock in
a profit, though it will be lower than the profit you had when you initiated
the long call. You still have the potential to gain additional proifts if the
market climbs high enough. This feature will occur if the premium on the
long call is less than the profit on the bear spread.
The alternative to liquidating the short call is to liquidate the long
put, leaving a short put. Although this is riskier, there is usually enough
TABLE 16.4 Bear Call Spread Results and Long Call Results
Price Bear call spread Long call
640 +2
7
/
8
+1
7
/
8
645 +2
7
/
8
+1
7
/
8
650 −2
1
/
8
+1
7
/
8
655 −2
1
/
8
+6
7
/
8
660 −2
1
/
8
+11
7
/
8
c16 JWBK147-Smith May 8, 2008 10:14 Char Count=
204 OPTION STRATEGIES
premium in the short put to make the trade attractive. Both alternatives
should be examined.
Neutral Strategies If the UI price drops and you expect prices to re-
main about the same, you could:
1. Hold the position; or
2. Liquidate the position.
Holding the position is the most common response to this situation.
You already know what can happen in terms of risk and reward. Unfor-
tunately, you might have already reached the point of maximum profit
potential.
On the other hand, liquidating the position is a viable tactic if you
have reached the point of maximum profit potential. The risk of holding
the position is now much higher than the expected reward. You might be
better off to take profits now and eliminate your risk.
Bearish Strategies If the UI price drops and you are bearish, you
could:
1. Hold the existing position;
2. Liquidate the position;
3. Liquidate one of the options; or
4. Roll down.
Holding the existing position is the most common tactic. No further
computations of break-evens and risks and rewards are necessary. After
all, the trade is progressing the way you felt it would. In general, this is the
best course to hold if the UI price has risen and your basic market stance
has not changed.
Liquidating the position makes sense if you have a small profit in the
trade, but are now significantly worried about the possibility of a sharp
move higher. You might want to take the profits and eliminate the possibil-
ity of further loss.
If you feel the market is now more bearish than when you first en-
tered the spread, you could liquidate either the short put option if you
are in a bear put spread or the long call option if you are in a bear call
spread. This changes the character of the trade to either a long put or a
short call. You are now saying that the market is more bearish than you
originally thought, and you now want to participate in further down-side
c16 JWBK147-Smith May 8, 2008 10:14 Char Count=
Bear Spreads 205
TABLE 16.5 Bear Put Spread versus Put Purchase
Price Spread profit/loss Put result
625 +2
7
/
8
+7
7
/
8
630 +2
7
/
8
+2
7
/
8
635 +2
7
/
8
−2
1
/
8
640 +2
7
/
8
−7
1
/
8
645 +2
7
/
8
−12
1
/
8
650 −2
1
/
8
−17
1
/
8
655 −2
1
/
8
−17
1
/
8
movement. The maximum profit potential might have already been reached
on the spread.
The bear put spread used in Table 16.1 is an example: Assume that the
market dropped to 640 the day after you entered the bear spread—the 645
put is now selling for 17, and the 650 put is selling at 20. Your choice is
either to stick with the bear put spread or to liquidate the short 645 put.
Table 16.5 shows the results at different price levels for these two tactics.
Shifting to a long put at this point means that you are starting out with a
locked-in profit of 2
7
/
8
, the maximum profit on the original spread. This is
counted in the results of the long put. Notice that prices must move sig-
nificantly lower before you will make a profit on the long put. In addition,
you now have significant up-side risk because you are long a put that is far
in-the-money.
The alternative is to liquidate the long call. The problem with this is
that you have shifted to a position that probably has little time premium in
it, and the profits will not be very large. You, therefore, will rarely want to
liquidate the long call if you are in a bear call spread, but selling the short
put can be a viable strategy.
The final tactic is to roll down. This entails liquidating the existing bear
spread and initiating another bear spread using lower strike prices. One
advantage with this tactic is that you are initiating the trade with the profit
of the original bear spread. The disadvantage of rolling down is that you
are creating a lower break-even point. Table 16.6 compares holding the
original bear call spread shown in Table 16.3 with rolling down by buy-
ing the 645 call at 8
3
/
4
and selling the 640 call at 5
3
/
4
. Remember that the
result for the new bear spread includes the profit of 2
7
/
8
from liquidating
the original spread. The most interesting feature of Table 16.6 is that it
shows that you have increased the profit potential of the new position by
the amount you gained on the original spread. This means that you will
lock in a profit if you roll up to a new bull spread that has a risk that is less
than the profit potential on the original spread. In this example, you could
c16 JWBK147-Smith May 8, 2008 10:14 Char Count=
206 OPTION STRATEGIES
TABLE 16.6 Bear Call Spread Results and Rolling-Down Results
Price Original bear spread New bear spread
625 +2
7
/
8
+5
7
/
8
630 +2
7
/
8
+5
7
/
8
635 +2
7
/
8
+5
7
/
8
640 +2
7
/
8
+4
7
/
8
645 +2
7
/
8
−
1
/
8
650 −2
1
/
8
−
1
/
8
655 −2
1
/
8
−
1
/
8
still lose money, but your risk would be small and you would be increasing
the profit potential if you are still bearish.
If the Price of the Underlying Instrument Rises
Bullish Strategies If the UI price rises and you are still bullish; you
could:
1. Hold the existing position; or
2. Liquidate the option.
Holding the existing position is the most common tactic. No further
computations of break-evens and risks and rewards are necessary. You
know what your risk is, and, in fact, you might already have moved to above
the point of maximum risk. If this is the case, you have nothing further to
lose on this trade.
A more aggressive tactic is to liquidate either the short call option if
you are in a bear call spread or the long put option if you are in a bear
put spread. This changes the character of the trade to either a short put
or a long call. The net effect is that you have liquidated the bear spread
and are now taking a more bullish stance on the market. Your rationale
might be that the market was only somewhat bearish at lower levels but has
become bullish. This might occur because of new information or because
the UI price broke a key price resistance level. The problem with this tactic
is that it is too easy to rationalize and emotionally make a decision in an
effort to double up and catch up. Many traders, when confronted with a
losing position, will take on too much risk in an effort to recapture their
losses. The net effect is that there is nothing intrinsically wrong with this
tactic, but it must be done rationally.
c16 JWBK147-Smith May 8, 2008 10:14 Char Count=
Bear Spreads 207
TABLE 16.7 Bear Call Spread Results and Long Call Results
Price Bear call spread Long call
650 −2
1
/
8
−19
1
/
8
655 −2
1
/
8
−14
1
/
8
660 −2
1
/
8
−9
1
/
8
665 −2
1
/
8
−4
1
/
8
670 −2
1
/
8
+
7
/
8
675 −2
1
/
8
+5
7
/
8
Use the bear call spread from Table 16.3 as an example and compare
this with the liquidation of the short call: Assume the market rose to 660
the day after you entered the bear spread—the 645 call is now selling
for 20, and the 650 is selling at 17. Your choice is either to stick with
the bear call spread or to liquidate the short 645 call. Table 16.7 shows
the results at different price levels for these two tactics. Notice that
prices must move significantly higher before you will make a profit on the
long call.
In addition, you now have significant down-side risk because you are
long a call that is far in-the-money.
The alternative to liquidating the short call is to liquidate the long put,
leaving a short put. Although this is riskier, there is usually enough pre-
mium in the short put to make the trade attractive. Both alternatives should
be examined.
Neutral Strategies If the UI price rises and you expect prices to re-
main about the same, you could:
1. Hold the position; or
2. Liquidate the position.
Holding the position is the most common response to this situation.
You already know what can happen in terms of risk and reward. You might
have already reached the maximum loss point and have nothing more to
lose on the trade. If this is the situation, then you might as well hold the
position.
On the other hand, liquidating the position is a viable tactic if you
have a small loss in the trade but are now significantly worried about the
possibility of a further up-move. In effect, you are eliminating the position
for a small loss rather than a larger loss.
c16 JWBK147-Smith May 8, 2008 10:14 Char Count=
208 OPTION STRATEGIES
TABLE 16.8 Bear Put Spread versus Put Purchase
Price Spread profit/loss Put result
635 +2
7
/
8
+12
7
/
8
640 +2
7
/
8
+5
7
/
8
645 +2
7
/
8
+
7
/
8
650 −2
1
/
8
−4
1
/
8
655 −2
1
/
8
−4
1
/
8
660 −2
1
/
8
−4
1
/
8
Bearish Strategies If the UI price rises and you are still bearish, you
could:
1. Hold the existing position; or
2. Liquidate the option.
Holding the position is the most common response to this situation.
You already know what can happen in terms of risk and reward. You might
have already reached the maximum loss point and have nothing more to
lose on the trade. If this is the situation, then you might as well hold the
position.
If you feel the market is still bearish, you could liquidate either the
short put option if you are in a bear put spread or the long call option if
you are in a bear call spread. This changes the character of the trade to
either a long put or a short call. The net effect is that you have shifted your
position from somewhat bearish to very bearish.
The bear put spread used in Table 16.1 is an example: Assume that the
market rose to 660 the day after you entered the bear spread—the 645 put
is now selling for 5
3
/
4
, and the 650 put is selling at 2. Your choice is either to
stick with the bear put spread or to liquidate the short 645 put. Table 16.8
shows the results at different price levels for these two tactics. Shifting
to a long put at this point means that you are starting out with a loss of
2
1
/
8
on the original spread. This loss is counted in the results of the long
put. Note that prices must move significantly lower before you will make a
profit on the long put. However, your up-side risk is minimal because the
put is out-of-the-money and the premium cost is low.
The alternative is to liquidate the long call. The problem with this is
that you have shifted to a position that probably has little time premium in
it, and the profits will not be very large. You, therefore, will rarely want to
liquidate the long call if you are in bear call spread, but selling t he short put
can be a viable strategy.
c17 JWBK147-Smith May 8, 2008 10:17 Char Count=
CHAPTER 17
Butterfly
Spreads
Price Implied Time Profit
Strategy Action Volatility Decay Gamma Potential Risk
Butterfly Spreads Usually Neutral
STRATEGY
You can initiate both long and short butterfly spreads. Butterfly spreads are
usually considered neutral strategies that can be constructed with either
puts or calls. However, butterflies can be constructed that have a bullish or
bearish bias.
The long butterfly is neutral in that it does not look for prices to move
very far. A long butterfly is constructed by:
r
Buying one low-strike option.
r
Selling two medium-strike options.
r
Buying one high-strike option.
The short butterfly is neutral in that it looks for prices to move signifi-
cantly in one direction or the other. A short butterfly is constructed by:
r
Selling one low-strike option.
r
Buying two medium-strike options.
r
Selling one high-strike option.
209
c17 JWBK147-Smith May 8, 2008 10:17 Char Count=
210 OPTION STRATEGIES
4
Price of Underlying Instrument
Profit
0
−1
1
3
−2
2
40
41
42
43
44
45
46
47
48
49
50
51
52
53
54
55
56
57
58
59
60
FIGURE 17.1 Long Butterfly
A person putting on a short butterfly does not have to have an opinion
on the future direction of the market but does have to expect a move in
some direction. (See Figures 17.1 and 17.2 for butterfly option charts.)
A bullish butterfly has strike prices such that the middle strike price is
above the current market price of the underlying instrument (UI). A bear-
ish butterfly has the middle strike below the current market price. The
UI price will have to rise or fall toward the middle strike price before the
maximum profit potential will be realized. However, there are usually bet-
ter bull or bear strategies than constructing bull or bear butterflies. As a
result, butterflies are nearly always initiated with a neutral market bias.
2
Price of Underlying Instrument
Profit
−2
−3
−1
1
−4
0
40
41
42
43
44
45
46
47
48
49
50
51
52
53
54
55
56
57
58
59
60
FIGURE 17.2 Short Butterfly
c17 JWBK147-Smith May 8, 2008 10:17 Char Count=
Butterfly Spreads 211
EQUIVALENT STRATEGY
There are two equivalent strategies for the long butterfly:
1. Buy a low-strike put, short a medium-strike put, short a medium-strike
call, and buy a high-strike call.
2. Buy a low-strike call, short a medium-strike call, short a medium-strike
put, and buy a high-strike put.
There are two equivalent strategies for the short butterfly:
1. Short a low-strike put, buy a medium-strike put, buy a medium-strike
call, and short a high-strike call.
2. Short a low-strike call, buy a medium-strike call, buy a medium-strike
put, and short a high-strike put.
Note that the distance between the low and medium strikes and be-
tween the medium and high strikes must be equal. It should also be noted
that the equivalent strategies are simply combinations of bull and bear
spreads. Thus, you can leg into butterflies by initiating appropriate bull or
bear spreads.
RISK/REWARD
Break-Even Points
There are two break-evens for each of the butterflies. The following break-
even formulas assume that the distances from the middle strike price to
the highest and to the lowest strike price are equidistant.
For the long butterfly:
Up-side break-even = Highest strike price − net debit
Down-side break-even = Lowest strike price + net debit
For the short butterfly:
Up-side break-even = Highest strike price − net credit
Down-side break-even = Lowest strike price + net credit
Look at an example of the two break-evens for a long butterfly. As-
sume that Monsanto is trading at 69
3
/
4
, and you want to trade the January
c17 JWBK147-Smith May 8, 2008 10:17 Char Count=
212 OPTION STRATEGIES
options. The 65 strike is trading at 6
1
/
4
, the 70 strike is at 4, and the 75
strike last traded at 2. Construct your long butterfly by buying one of the
65 strikes for a debit of 6
1
/
4
, selling 2 of the 70 strikes for a credit of 8,
and buying one of the 75 strikes for a debit of 2. The net debit on the trade
is –6
1
/
4
+ 8–2,or–
1
/
4
. The up-side break-even point is the highest strike
price, 75, minus the net debit,
1
/
4
,or74
3
/
4
. The downside break-even is the
lowest strike price, 65, plus the net debit,
1
/
4
,or65
1
/
4
.
Assume you initiated a short butterfly with the following prices:
Dun & Bradstreet stock = 105
1
/
2
November 100 call = 6
3
/
4
November 105 call = 3
November 110 call = 1
1
/
4
This short butterfly would be initiated for a net credit of +6
3
/
4
–6+
1
1
/
4
, or 2. The up-side break-even is the highest strike price, $110, minus
the net credit, $2, or $108. The down-side break-even is the lowest strike
price, $100, plus the net credit, $2, or $102.
Maximum Risk
The maximum risk for a long butterfly is the net debit of the spread and
occurs outside of the break-even points. The maximum risk for a short
butterfly is the difference between the middle strike price and one of the
outer strike prices (assuming that the middle strike price is equidistant
from the outer strike prices) minus the net credit received when the trade
is initiated.
For example, you have initiated a short butterfly using the $45, $50, and
$55 strike prices and received $1 in premium. Your maximum risk is the dif-
ference between the middle option strike price, $50, and either of the two
outer strikes, $45, minus the net credit of $1; that is, $50 – $45 – $1, or $4.
Profit Potential
The maximum profit for a long butterfly is the distance between the
middle strike and one of the outer strikes minus the net debit. This as-
sumes equal distance between the three strikes. The maximum profit will
be achieved at the middle strike.
The maximum profit for a short butterfly is the net credit. This will be
achieved at the points represented by the value of the net credit plus the
up-side break-even point, or at the down-side break-even point minus the
value of the net credit.
c17 JWBK147-Smith May 8, 2008 10:17 Char Count=
Butterfly Spreads 213
Assume a long butterfly of December Telex options with strikes of $50,
$55, and $60. The three entry prices are 7, 3
1
/
2
, and 1
5
/
8
, respectively. The
net debit is 1
5
/
8
. Thus, the maximum profit potential for this spread is the
distance between the middle strike and one of the two outer strikes, 5,
minus the net debit, 1
5
/
8
; that is, 5 – 1
5
/
8
,or3
3
/
8
.
DECISION STRUCTURE
Selection
One key to selecting a butterfly is the cost. The best long butterfly is the
cheapest butterfly. The least expensive butterfly will have the lowest dollar
risk and the widest range of break-even points. You should try to enter
the long butterfly at a premium cost of less than 10 percent of the distance
between two of the strike prices. For example, you are interested in buying
a butterfly in a stock with strike prices at $50 and $55. This rule of thumb
suggests that you should consider purchasing the long butterfly only if you
can buy it for less than 0.50. An option evaluation program is useful for
identifying possibly underpriced options that can be used to construct a
long butterfly.
A second criterion is that you will want to select the outer strike prices
to be beyond the expected range of the UI price for the time you will be in
the trade. Therefore, you will be selecting those UIs that you expect to be
stagnant.
The converse is true with a short butterfly. You are looking for a situa-
tion that has overpriced options. The profit potential of the trade is entirely
the net price you receive for the option. In addition, you are looking for a
situation where the UI price has an excellent chance of moving in either di-
rection. You are looking for a UI that you expect to move beyond the range
defined by the two outer strike prices.
Another consideration is volatility. Rising volatility will help a long but-
terfly but hurt a short butterfly. This is because the volatility will increase
the price of the options beyond the initial price, all things being equal.
The final consideration is the selection of the middle strike price. The
common practice is to select the at-the-money option as the middle strike
price. However, selecting a higher or lower strike price will turn the butter-
fly into a bull or bear strategy. A higher strike price turns a long butterfly
into a bull strategy, whereas a lower strike price will turn it into a bear
strategy. A higher strike price turns a short butterfly into a bear strategy,
whereas a lower strike price turns the short butterfly into a bull strategy.
Butterflies are very similar to straddles but with much lower risk and
reward. In fact, the key advantage of a butterfly over a straddle is that the
c17 JWBK147-Smith May 8, 2008 10:17 Char Count=
214 OPTION STRATEGIES
risk of either a long or a short butterfly is limited, whereas the risk in a
short straddle is “unlimited.”
If the Price of the Underlying Instrument Drops
The tactics for long and short butterflies are opposite. In general, short
butterflies are not popular strategies because of the limited profit poten-
tial. Most traders will focus on similar strategies that usually present a bet-
ter risk/reward ratio, such as long straddles. Also, the follow-up tactics of
short butterflies are the flip side of long butterflies. This means that you
can simply take the opposite side of the long butterfly tactics. As a result,
this section will focus only on the tactics for long butterflies.
Bullish Strategies If the UI price drops and you are bullish, you
could:
1. Hold the current position;
2. Convert to bull spread; or
3. Convert to long call(s) or short put(s).
Holding the current position makes sense if the UI price will stay
within the limits of the two break-even points. For example, prices might
have dropped to below the lower break-even point. Now that you are more
bullish, it makes sense to hold the position, looking for it to climb back into
the profit zone.
On the other hand, if you are so bullish that you think the price will go
above the up-side break-even, you will still want to hold the position and
liquidate it when it moves to the middle strike price.
Converting the position into a bull spread is an interesting tactic. It
is basically saying that you are no longer neutral on the market but have
become bullish. Look at an example of the differences in results using this
approach versus leaving the original position untouched. Table 17.1 shows
these results. Assume that the trade was initiated with the following prices:
OEX = 530
December 520 call = 15
1
/
2
December 525 call = 13
December 530 call = 10
3
/
4
Net debit of
1
/
4
c17 JWBK147-Smith May 8, 2008 10:17 Char Count=
Butterfly Spreads 215
TABLE 17.1 Long Butterfly Results and Bull Call Spread Results
Price Long butterfly Bull spread
520 −
1
/
4
−2
3
/
8
525 +4
3
/
4
+2
5
/
8
530 −
1
/
4
+2
5
/
8
However, the market has dropped to 525, you have switched to the bull
camp, and prices are now:
OEX = 525
December 520 call = 9
7
/
8
December 525 call = 7
1
/
2
December 530 call = 5
Notice that you will make more money sticking with the long butterfly
if the market stabilizes; but, if the market moves higher, you will make
more money on shifting to the bull spread. The drawback to the shift to
the bull spread is that you are also giving up the miniscule r isk of the long
butterfly if the market continues lower.
The final and most bullish alternative is to convert the position to ei-
ther a long call or a short put. This entails liquidating three of the four
options in the butterfly. Continuing the example in Table 17.1, Table 17.2
shows the results of keeping the original butterfly spread and moving to
the long 520 call at 9
7
/
8
.
The net result is that you must have become very bullish to want to
shift to a long call over holding the existing butterfly. The risks and the
rewards are significantly higher for the long call than for the butterfly.
The alternative to a long call is to hold one of the short puts. This will
have less profit potential than the long call, but it has more risk. The main
advantage of holding one of the short puts is that you will make money at a
TABLE 17.2 Long Butterfly Results and Long Call Results
Price Long butterfly Long call
520 −
1
/
4
−9
7
/
8
525 +4
3
/
4
−4
7
/
8
530 −
1
/
4
+
1
/
8
535 −
1
/
4
+5
1
/
8
c17 JWBK147-Smith May 8, 2008 10:17 Char Count=
216 OPTION STRATEGIES
lower level compared with the long call. Another advantage is that you are
selling time premium rather than buying time premium.
Neutral Strategies If you look for prices to stabilize, you could:
1. Hold the position;
2. Liquidate the position; or
3. Roll down.
Holding the current position makes sense if the UI price will stay
within the limits of the two break-even points. For example, prices may
have dropped to just above the lower break-even point. It makes sense to
hold the position to take the small profit.
Liquidating the position can make sense if prices have dropped to
outside the profit zone and if you can limit your losses to something less
than the initial risk. Because the risk in long butterflies is usually very low,
most investors do not liquidate their existing position, waiting, instead, for
the price to rally.
Rolling down entails liquidating the current butterfly and initiating a
new position with lower strike prices. You might be taking a loss on the
initial position, looking to increase your profit potential if prices stay at
their current position. Table 17.3 shows the results for an example.
Bearish Strategies If the UI price drops and you are bearish, you
could:
1. Hold the position;
2. Liquidate the position;
3. Convert to bear spread;
4. Convert to short call(s) or long put(s); or
5. Roll down.
TABLE 17.3 Long Butterfly Results and Roll Down Results
Price Original butterfly New butterfly
515 −
1
/
4
+1
520 −
1
/
4
+6
525 +4
3
/
4
+1
530 −
1
/
4
+1
c17 JWBK147-Smith May 8, 2008 10:17 Char Count=
Butterfly Spreads 217
Holding the current position makes sense only if no other tactic looks
attractive. In other words, you may want to sit on your small loss rather
than take the additional risk of other tactics.
Liquidating the position can make sense if prices have dropped to
outside the profit zone and if you can limit your losses to something less
than the initial risk. Because the risk in long butterflies is usually very low,
most investors do not liquidate their existing position, waiting, instead, for
the price to rally.
Converting the position into a bear spread is basically saying that you
are no longer neutral on the market, but have become bearish. Look at an
example of the differences in results from using the long 530 call/short 525
call bear spread versus leaving the original position untouched. Table 17.4
shows these results at expiration. Assume that the trade was initiated with
the following prices with a net debit of
1
/
4
:
OEX = 530
December 520 call = 15
1
/
2
December 525 call = 13
December 530 call = 10
3
/
4
However, the market has dropped to 525, you have switched to the
bear side, and prices are now:
OEX = 525
December 520 call = 9
7
/
8
December 525 call = 7
1
/
2
December 530 call = 5
Notice that you will make more money sticking with the long butterfly
if the market stabilizes; but, if the market moves lower, you will make more
money on shifting to the bear spread. The drawback to the shift to the bear
TABLE 17.4 Long Butterfly Results and Bear Call Spread Results
Price Long butterfly Bear spread
515 −
1
/
4
+2
3
/
8
520 −
1
/
4
+2
3
/
8
525 +4
3
/
4
−2
5
/
8
530 −
1
/
4
−2
5
/
8