Báo cáo hóa học: " Preparation and Characterization of Nano structured Materials from Fly Ash: A Waste from Thermal Power Stations, by High Energy Ball Milling" potx
Bạn đang xem bản rút gọn của tài liệu. Xem và tải ngay bản đầy đủ của tài liệu tại đây (442.78 KB, 8 trang )
NANO EXPRESS
Preparation and Characterization of Nano structured Materials
from Fly Ash: A Waste from Thermal Power Stations, by High
Energy Ball Milling
K. Thomas Paul Æ S. K. Satpathy Æ I. Manna Æ
K. K. Chakraborty Æ G. B. Nando
Received: 27 April 2007 / Accepted: 15 June 2007 / Published online: 11 July 2007
Ó to the authors 2007
Abstract The Class F fly ash has been subjected to high
energy ball milling and has been converted into nano-
structured material. The nano structured fly ash has been
characterized for its particle size by using particle size
analyzer, specific surface area with the help of BET surface
area apparatus, structure by X-ray diffraction studies and
FTIR, SEM and TEM have been used to study particle
aggregation and shape of the particles. On ball milling, the
particle size got reduced from 60 lm to 148 nm by 405
times and the surface area increased from 0.249 m
2
/gm to
25.53 m
2
/gm i.e. by more than 100%. Measurement of
surface free energy as well as work of adhesion found that
it increased with increased duration of ball milling. The
crystallite was reduced from 36.22 nm to 23.01 nm for
quartz and from 33.72 nm to 16.38 nm for mullite during
ball milling to 60 h. % crystallinity reduced from 35% to
16% during 60 h of ball milling because of destruction of
quartz and hematite crystals and the nano structured fly ash
is found to be more amorphous. Surface of the nano
structured fly ash has become more active as is evident
from the FTIR studies. Morphological studies revealed that
the surface of the nano structured fly ash is more uneven
and rough and shape is irregular, as compared to fresh fly
ash which are mostly spherical in shape.
Keywords High energy ball mill Á Fly ash Á
Nanostructured materials Á Quartz Á Mullite
Introduction
Nanoscience and nanotechnology has become the buzz-
word in recent years since its inception in 1990’s. It liter-
ally means any technology performed in the nanoscale
down to molecular level. Nanotechnology encompasses the
production and application of physical, chemical and bio-
logical systems at scales ranging from individual atoms or
molecules to submicron level as well as integration of the
resulting nano structure to larger systems [1]. Nanomaterial
is defined as the materials with the microstructure having at
least one dimension in nanometer range. It has appeal of
miniaturization; also it imparts enhanced electronic, mag-
netic, optical and chemical properties to a level that cannot
be achieved by conventional materials. The key charac-
teristics of nanomaterials are its small size, narrow size
distribution, low levels of agglomeration and high dis-
persability [2].
A variety of ways have been reported to synthesize nano
level materials such as plasma arcing, chemical vapor
deposition, electro deposition, sol–gel synthesis, high
intensity ball milling etc [3]. Among these methods high
energy milling has advantages of being simple, relatively
inexpensive to produce, applicable to any class of materials
and can be easily scaled up to large quantities [4]. In this
mechanical treatment, powder particles are subjected to a
severe plastic deformation due to the repetitive compres-
sive loads arising from the impacts between the balls and
the powder. The high concentration of defects and the
continuous interfaces renewal, associated with the milling-
induced enhanced atomic mobility, promote different
K. T. Paul Á S. K. Satpathy Á K. K. Chakraborty Á
G. B. Nando (&)
Rubber Technology Centre, Indian Institute of Technology,
Kharagpur, West Bengal 721302, India
e-mail:
I. Manna
Metallurgical and Materials Engineering Department,
Indian Institute of Technology, Kharagpur,
West Bengal 721302, India
123
Nanoscale Res Lett (2007) 2:397–404
DOI 10.1007/s11671-007-9074-4
phenomena depending on the materials being milled [5–7].
This produces novel crystalline and amorphous materials
with crystallite sizes at the nanometer scale.
Coal-burning power plants that consume pulverized
solid fuels produce large amounts of fly ash. These are the
finely divided mineral residue resulting from the combus-
tion of ground or powdered coal in electric power gener-
ating plant. The fly ash consists of inorganic, incombustible
matter present in the coal that has been fused during
combustion into a glassy, amorphous structure. This
material is solidified while suspended in the exhaust gases
and is collected by particulate emission control devices,
such as electrostatic precipitators or filter fabric bag
houses. Fly ash, often called pulverized fuel ash, is the
largest produced industrial waste in the world, mainly due
to the global reliance on the coal-fired power plants [8].
Since the particles solidify while suspended in the exhaust
gases, fly ash particles are mostly spherical in shape and
range in size from 0.5 lm to 100 lm. They consist mostly
of mullite(3Al
2
O
3
Á 2SiO
2
), quartz (SiO
2
), aluminium
oxide (Al
2
O
3
), hematite (Fe
2
O
3
), lime(CaO) and gyp-
sum(CaSO
4
Á 2H
2
O). As a result it possesses various
physical, chemical and mineralogical properties, depending
on the mineralogical composition of the used coal and on
the combustion technology [9].
About 75% of India’s energy supply is coal based and
shall be so for the next few decades. There are about 82
utility thermal power stations to produce approximately
110 million tonnes of fly ash per annum in the Country
[10]. Nearly 38% of the fly ash waste is utilized in the
Country at present [11], in various fields including landfills,
cement making and concrete product making such as
bricks, blocks and tiles, in road making, in filling of the
mines. Attempts have been made earlier to utilize this fly
ash waste in the polymer industry in making polymeric
composites where fly ash is being used as inorganic par-
ticulate filler without much breakthrough. The utilization
of fly ash is determined by their properties such as fineness,
specific surface area, particle shape, hardness, freeze-thaw
resistance, etc. Many investigations have been carried out
towards the effective utilization of fly ash and with
understanding of potential environmental and health im-
pacts associated with its disposal by land filling.
In this paper an attempt has been made to modify the fly
ash by transforming the micro sized fly ash into nano-
structured fly ash using high energy ball mill. The smooth,
glassy and inert surface of the fly ash can be altered to a
rough and more reactive by this technique. The nano
structured fly ash thus obtained may be characterized using
sophisticated analytical techniques. Thus, nano level min-
eral filler can be used as reinforcing filler in making
polymer composites, in particular rubber based composites.
Experimental
Materials
Fly ash samples collected from Kolaghat Thermal Power
Station, West Bengal, India having a specific gravity of
2.33 gm/cc and total evaporable moisture content of 1.54%
is used. The particle size of fly ash falls in the range of 60–
100 lm. Loss on ignition, which was measured by burning
the sample in muffle furnace at 800 °C for 3 h, was 3%.
Fresh fly ash has been washed in distilled water and
removed the carbon that creamed up during washing. It is
then dried at 100 °C for 48 h to remove water. Dried fly
ash has been sieved using ASTM meshes ranging in size
from 72 to 350. Fly ash fractions after passing through 200
mesh has been taken for ball milling since it gave 45% by
weight of the total fly ash taken for sieving, the other size
ranges providing less quantity.
High Energy Pulverization of Fly Ash
The reduction in particle size of fly ash from micron level
to the nano level was carried out using a high-energy
planetary ball mill (Pulverisette, Fritsch, Germany). The
total duration of milling was 60 hours. The following
milling conditions were maintained: loading of the ball mill
with 10:1 ratio of balls to fly ash and milling chamber and
balls were of tungsten carbide, the ball diameter was
10 mm. Toluene was used as the medium with an anionic
surface active agent to avoid agglomerations; rotation
speed of the planet carrier was 300 rev min
–1
.
Particle Size, Surface Area and Surface Energy
Measurements
Particle size of ball milled fly ash at different time of
milling was determined using dynamic light scattering
technique in a Brookhaven particle size analyzer. Specific
surface area of the ground fly ash was found out by using
BET method. The samples were degassed at 350 °C before
testing. The surface energy of the samples was calculated
by measuring contact angle. The powder contact angles
were found out using Dynamic Contact angle Tester
(DCAT) from Dataphysics, UK.
The surface free energy of a particle gives an estimate of
its surface reactivity. Fowkes [12] proposed a relation
based on the surface energy of the material in its pure phase
(c
a
), which is a sum of the contribution from the dispersion
(c
a
d
) and the polar (c
a
p
) components and may be repre-
sented as;
c
a
¼ c
d
a
þ c
p
a
ð1Þ
398 Nanoscale Res Lett (2007) 2:397–404
123
The dispersion component mainly consists of London
and dispersive interactions, induction (Debye) and orien-
tation interactions, while the polar interactions mainly due
to the hydrogen bonding [13]. These components can be
derived from Young’s equation as given below
Cosh þ1 ¼
2ðc
d
s
c
d
l
Þ
1=2
c
l
þ
2ðc
p
s
c
p
l
Þ
1=2
c
l
ð2Þ
Subscripts s and l represent solid and liquid states
respectively and h represents the contact angle of the liquid
and the material surface. The work of adhesion could also
be obtained from the equilibrium contact angle h as per the
equation;
W
a
¼ c
l
ð1 þcos hÞð3Þ
X-Ray Diffraction Studies
The X-ray diffraction measurements were carried out with
the help of a Goniometer model PW1710 using CuKa
radiation (Ka = 1.54056 A) at an accelerating voltage of
40 kV and a current of 20 mA. The samples were scanned
in the range from 10 to 90 degrees 2-theta.
Infrared Spectroscopy Studies
A Fourier Transform Infrared Spectroscopy (Perkin Elmer
FTIR) was employed for examining the functional groups
on the fresh as well as ball milled fly ash. The powder
samples were ground with spectroscopic grade KBr and
made into pellets according to the specified sample prep-
aration procedure.
Morphology Studies
The size and dimensions of fresh as well as ball milled fly
ash were examined by means of electronic microscopy.
Scanning Electron Microscope (JEOL JSM 850) and
Transmission Electron Microscope (Philips CM 12) were
used for the particle surface as well as surface texture
analysis.
Results and Discussion
Results of the Energy Dispersed X-ray analysis (EDX) of
the fresh fly ash are shown in Table 1
As per ASTM C 618 [14] fly ash has been classified into
two categories, Class F and Class C. The fly ash that
contains more than 70% oxides of silicon, aluminium and
iron of the total composition with Fe
2
O
3
content higher
than CaO is termed as Class F type. According to the
calculations carried out based on EDX analysis the overall
composition of fly ash obtained for this study consists of
major proportion of SiO
2
,Al
2
O
3
and Fe
2
O
3
, which seems
up to 97.42%. More over the percentage of calcium oxide,
which is 0.99%, is less than that of iron which is 5.03%.
This observation reveals that the procured fly ash is Class F
type.
Variation in composition of metallic oxides with milling
time, as determined from EDX analysis are shown in
Table 2. The percentage of alumina reduces marginally
and the percentage of silica increases marginally as milling
for 20 h, there after it remains unaffected with milling
time. TiO
2
percent decreases and those of CaO and Fe
2
O
3
marginally increased with long hours of milling.
Particle Size, Surface Area and Surface Energy
Measurements of Fly Ash
The variation in particle size and specific surface area of fly
ash with milling time is depicted in the Figs. 1 and 2,
respectively. The average particle size of the fly ash pro-
cured was 60 lm. Ball milling of fresh fly ash up to 60 h
reduced its size by a magnitude of 405 times to 148 nm.
The specific surface area has increased from 0.249 m
2
/gm
for fresh fly ash to 25.53 m
2
/gm for fly ash ball milled up to
60 h. The increase in surface area has been found to be
more than 100 times in magnitude.
Table 3 displays the values of surface free energy and
work of adhesion of fresh as well as ball milled fly ash in
water and formamide. These parameters have been exten-
sively used to understand the surface characteristics of the
materials [15]. The total surface free energy has increased
from 19.223 mJ/m
2
for fresh fly ash, to 56.954 mJ/m
2
for
ball milled fly ash up to 60 h. Analyzing the components,
the polar component found to decrease from 10.85 mJ/
m
2
to 0.8724 mJ/m
2
and the dispersive component in-
creased from 8.373 mJ/m
2
to 56.082 mJ/m
2
. The increase
in the dispersive component can be attributed to the surface
roughness after ball milling which in turn favors Vander
Waal’s interactions. The effective exposure of more ele-
ments to the surface by ball milling can affect its polar
Table 1 Composition of the fresh fly ash (Class F)
% Elemental composition % Oxide composition
Component Content (%) Component Content (%)
Aluminium 33.71 Al
2
O
3
32.16
Silicon 54.84 SiO
2
59.23
Calcium 1.41 CaO 0.99
Iron 6.97 Fe
2
O
3
5.03
Titanium 3.07 TiO
2
2.59
Nanoscale Res Lett (2007) 2:397–404 399
123
nature. The work of adhesion in both water and formamide
are found to increase with duration of ball milling. The
increased wettability of the surface is expected to pro-
mote its compatibility with the polymer matrices when it is
used as reinforcing nanostructured filler.
X-Ray Diffraction Studies
The changes in the crystalline phases in the fly ash after
ball milling have been monitored with the help of wide
angle X-Ray Diffraction studies. The X-Ray diffracto-
grams of the fresh as well as ball milled fly ash are given in
the Fig. 3. The magnified view of the major peak corre-
sponding to Quartz at 26.58° 2h (d spacing = 3.3508 A
˚
)is
given in Fig. 4. The average crystallite size was determined
from the full width at half maximum (FWHM) of the X-ray
diffraction peak using Scherrer’s equation [16].
D ¼
Kk
B cos h
ð4Þ
where D is the particle diameter, k is the X-Ray wave-
length, B is the FWHM of the diffraction peak, h is the
diffraction angle and K is the Scherrer’s constant of the
order of unity for usual crystals.
Although fly ash exhibits lower degree of crystallinity,
but it shows a number of crystalline peaks in the diffrac-
togram. Mullite (Alumino silicate) and quartz (Silica)
peaks are significant. Mullite shows strong peaks at
16.402°, 25.999°, 26.22° and 40.821° 2h values (d spacing
of 5.3998, 3.4243, 3.3959 and 2.2087 A
˚
). The quartz
exhibits strong peaks at of 20.763° and 26.579° 2h values
(d spacing of 4.2745 and 3.3508 A
˚
). Iron oxide phase
shows a peak at 34.856° 2h value (d spacing of 1.82 A
˚
). An
amorphous hump is observed in the diffraction pattern
Table 2 Variation of oxide
composition with milling hours
Milling hours Al
2
O
3
(%) SiO
2
(%) CaO (%) TiO
2
(%) Fe
2
O
3
(%)
0 32.16 59.23 0.99 2.59 5.03
20 29.13 62.63 1.31 2.54 4.39
40 27.35 63.59 1.28 2.13 5.65
50 28.55 63.14 0.83 1.85 5.63
60 27.8 62.82 1.32 1.99 6.06
Fig. 1 Variation in Particle size of fly ash with milling time (in
hours)
Fig. 2 Variation of Specific surface area of fly ash with milling time
(in hours)
Table 3 Surface energy and
work of adhesion of fresh as
well as ball milled fly ash
Fly ash sample Surface energy (mJ/m
2
) Work of adhesion
in water (mJ/m
2
)
Work of adhesion in
formamide (mJ/m
2
)
Polar dispersive
Fresh fly ash 10.85 8.373 74.045 64.86
Ball milled for 40 hours 9.705 13.188 78.398 72.595
Ball milled for 60 hours 0.8724 56.082 83.27 107.214
400 Nanoscale Res Lett (2007) 2:397–404
123
between approximately 14° 2h to 35° 2h may be due to the
presence of amorphous glassy materials [17].
Figure 5 displays the variation in crystallite size with the
time of high energy ball milling. Three major crystalline
domains in the fly ash, i.e. quartz, mullite and iron
oxide phases were evaluated with the duration of milling.
A steady decrease in the crystallite size is observed and the
quartz phase suffers the most. The same effect can be seen
in the variation of peak height with milling time which is
shown in Fig. 6. The high energy milling decreases the
crystallinity of the fly ash, thus increasing the amorphous
domains in it [18]. The decrease in crystallinity with ball
milling hours is depicted in the Fig. 7. This change is
beneficial for the applications such as particulate nano filler
in polymeric matrices. The enhanced amorphous content is
very encouraging as it may lead to better compatibility
with various polymeric matrices.
Infrared Spectroscopy Studies
Figure 8 shows the FTIR spectra of fresh as well as ball
milled fly ash. The peak at 1090 cm
–1
corresponds to the
Si–O–Si stretching vibration [19]. The crystalline quartz
(SiO
2
) domains are expected to be broken down during ball
milling. This has been evidenced from the decreased peak
intensity with increasing milling time in the FTIR spec-
trum. The peak at 3448 cm
–1
which was insignificant in the
fresh fly ash, has become conspicuous in case of ball milled
fly ash. This has been attributed to the presence of silanol
(Si–OH) functional group in the fly ash. The peak intensity
at this wave number is found to increase with increasing
Fig. 3 X-Ray diffraction patterns of fresh as well as ball milled fly
ash at different times
Fig. 4 Variation in the quartz peak (2h = 26.58°) height and width
with milling times
Fig. 5 Variation in crystallite size with milling time. (——) indicates
quartz peak at 2h =20.86°,( )indicatesmullitepeakat
2h = 40.858 and (-Á-Á-) indicates iron oxide peak at 35.29°.
Fig. 6 Variation in peak height with milling time. (——) indicates
quartz peak at 2h =20.86°,( )indicatesmullitepeakat
2h = 40.858 and (-Á-Á-) indicates iron oxide peak at 35.29°
Nanoscale Res Lett (2007) 2:397–404 401
123
milling time is an evidence for the breaking down of the
quartz structure and formation of Si–OH groups. The sur-
face properties of the fly ash changes considerably with
ball milling and its duration. This has been supported by
the surface free energy data. The dispersion forces increase
so as the surface reactivity as the OH groups at the surface
are increased.
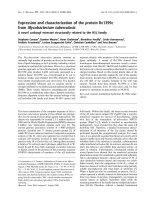
Morphological Studies
The size, shape and surface texture of the fresh as well as
nano-structured fly ash were studied using Secondary
Electron Imaging (SEI) mode of Scanning Electron
Microscopy (SEM). Figure 9(A and B) shows the SEM
images of fresh fly ash. The fresh fly ash particles are
mostly spherical in shape having an average diameter of
more than 10 lm. The morphology of fly ash particle is
controlled by combustion temperature and cooling rate.
During combustion, inorganic materials in coal become
fluid-like at high temperature and then get solidified. In the
pulverized coal fired boiler, the furnace operating temper-
ature often exceeds 1400 °C. At these high temperatures,
the minerals present in the coal may oxidize, decompose,
fuse, disintegrate or agglomerate giving different mor-
phologies to the generated fly ash. Along with the solid
spheres, irregular shaped particles of un-burnt carbon can
be seen which are large in size. Also agglomerated spheres
and irregularly shaped amorphous particles can be detected
which may be due to the inter-particle fusion during rapid
cooling. Figure 9(C–H) shows the SEM images of nano-
structured fly ash after different times of ball milling.
Figure 9 (C and D) corresponds to the photomicrographs of
nano-structured fly ash after 20 h of ball milling. The
spherical structure of fresh fly ash has been destroyed and
the average particle size is reduced. The extent of structure
break down is more as the duration of ball milling increases
and the particles become finer. Figure 9 (G and H) shows
the ball milled fly ash after 60 h of milling. It is observed
that the SEM analysis is not capable of detecting a single
particle even at higher magnifications.
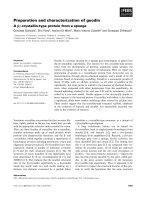
Hence Transmission Electron Microscopy (TEM) was
used as an efficient tool to study the microstructure, shape
and surface texture of a single fly ash particle. Figure 10(A
and B) shows the TEM images of fly ash single particles
ball milled for 60 h at very high magnifications of 30,000
and 50,000 times, respectively. Both the images show that
the size of the single fly ash particle is in the nanometer
range after 60 h of ball milling. Thus nano-structured
materials are expected to be present in the ball milled fly
ash. Also the surface of the fly ash has changed from glassy
smooth to irregular and rough. The outer glassy finish of
the fresh fly ash may have been eroded during ball milling
and the inner crystalline core may have been exposed after
ball milling for 60 h. The increased surface roughness
supports the higher surface energy of ball milled fly ash
which was discussed earlier in this paper.
Conclusions
The size reduction of fly ash from micrometer level to nano
levels has been achieved by high energy ball milling. The
average particle size has been reduced from 60 lmto
148 nm, a reduction of nearly 405 times in magnitude, by
this process. The surface area shows a tremendous increase
by around 102 times in magnitude. The total surface free
energy has increased by 300% after ball milling for 60 h.
Fig. 7 Variation in % crystallinity with milling time
Fig. 8 FTIR spectrum of fresh and ball milled fly ash at varying time,
(A) Fresh Fly ash, (B) Ball milled for 20 h, (C) Ball milled for 40 h
and (D) Ball milled for 60 h
402 Nanoscale Res Lett (2007) 2:397–404
123
Fig. 9 The Scanning Electron
microscope photomicrographs
of fresh and modified fly ash. (A
and B) SEM of fresh fly ash at
1,000 and 2,500 times
magnification, (C and D) SEM
of ball milled fly ash for 20 h at
1,000 and 3,000 times
magnification, (E and F) SEM
of ball milled fly ash for 40 h at
1,000 and 3,000 times
magnification, (G and H) SEM
of ball milled fly ash for 60 h at
1,000 and 3,000 times
magnification
Fig. 10 (A and B) TEM images
of fly ash ball milled for 60 h
Nanoscale Res Lett (2007) 2:397–404 403
123
The characteristic –OH stretching vibration peak intensity
increases by ball milling. The fly ash becomes more
amorphous and the crystallite size reduces drastically. The
shape and surface texture of the fly ash has been changed
by ball milling which is evident from TEM and SEM
studies. The nanostructured fly ash may be effectively used
as reinforcing filler in polymer matrices.
Acknowledgements The authors would like to thank Ms. Sasmitha
Mohapatra, Department of Chemistry, Indian Institute of Technology,
Kharagpur for particle size analyses and IRMRA, Thane, India for
surface area measurements.
References
1. B. Bhushan, in Springer Handbook of Nanotechnology (Springer-
Verlag, Germany, 2004)
2. M.G. Lines, J. Alloys Compd., doi:10.1016/j.jallcom.2006.02.
082 (2007)
3. A.S. Edelstein, in Encyclopedia of Materials: Science and
Technology, ed. by K.H.J. Buschow, R.W. Cahn, M.C. Flemings,
B. Ilschner, E.J. Kramer, S. Mahajan, P. Veyssiere (Elsevier
Science and Technology, 2006) p. 5916
4. C. C. Koch, Rev. Adv. Mater. Sci. 5, 91 (2003)
5. G. Chow, L.K. Kurihara, in Nanostructured materials: Science
and Technology, ed. by C.C. Koch (William Andrew Inc. N.Y.,
2002)
6. H.J. Fecht, Nano Struct. Mater. 6, 33 (1995)
7. S. Doppiu, V. Langlais, J. Sort, S. Surin
˜
ach, M.D. Baro, Y.
Zhang, G. Hadjipanayis, J. Nogue
´
s, Chem. Mater. 16, 5664
(2004)
8. R. Giere, L.E. Carleton, G.R. Lumpkin, Am. Mineral. 88, 1853
(2003)
9. S.C. White, E.D. Case, J. Mater. Sci., 25, 5215 (1990)
10. V. Kumar, K. Abraham Zacharia, P. Sharma Fly Ash Utilisation:
Indian Scenario & Case Studies. />flyindia.htm as on 15 April 2007
11. Ash Utilization, National Thermal Power Corporation (NTPC),
India as on 14
April 2007
12. F.M. Fowkes, in Treatise on adhesion and adhesives, vol 1, ed.
by R.L. Patrick (Marcel Dekker Inc., N.Y., 1967)
13. E. Chibowski, L. Holysz, Langmuir 8, 710 (1992)
14. ASTM C 618, ‘Standard Specification for Coal fly ash and Raw
or Calcined Pozzolan for use as a mineral admixture in concrete’,
ASTM International, West Conshohocken, Pa., 4 (1997).
15. A. K. Bhowmick, J. Konar, S. Kole, S. Naryan, J. .Appl. Pol. Sci.
57, 631 (1995)
16. A.L. Patterson, Phys. Rev. 56, 978 (1939)
17. P. Jason Willians, J.J. Biernacki, C.J. Rawn, L. Walker, J. Bai,
ACI Mater. J., 102(5), 330 (2005)
18. L. L. Shaw, R. Ren, Z. Ban, Z. Yang, Ceramic nanomaterials and
nanotechnology, vol. 137 (American Ceramic Society, Ohio,
2003)
19. S. Thongsang, N. Sombatsompop, Polym. Compos. 27, 30 (2006)
404 Nanoscale Res Lett (2007) 2:397–404
123