Báo cáo hóa học: " Influence of GaAs Substrate Orientation on InAs Quantum Dots: Surface Morphology, Critical Thickness, and Optical Properties" docx
Bạn đang xem bản rút gọn của tài liệu. Xem và tải ngay bản đầy đủ của tài liệu tại đây (377.84 KB, 5 trang )
NANO EXPRESS
Influence of GaAs Substrate Orientation on InAs Quantum Dots:
Surface Morphology, Critical Thickness, and Optical Properties
B. L. Liang Æ Zh. M. Wang Æ K. A. Sablon Æ
Yu. I. Mazur Æ G. J. Salamo
Received: 12 September 2007 / Accepted: 22 October 2007 / Published online: 6 November 2007
Ó to the authors 2007
Abstract InAs/GaAs heterostructures have been simul-
taneously grown by molecular beam epitaxy on GaAs
(100), GaAs (100) with a 2° misorientation angle towards
[01-1], and GaAs (n11)B (n = 9, 7, 5) substrates. While
the substrate misorientation angle increased from 0° to
15.8°, a clear evolution from quantum dots to quantum well
was evident by the surface morphology, the photolumi-
nescence, and the time-resolved photoluminescence,
respectively. This evolution revealed an increased critical
thickness and a delayed formation of InAs quantum dots as
the surface orientation departed from GaAs (100), which
was explained by the thermal-equilibrium model due to the
less efficient of strain relaxation on misoriented substrate
surfaces.
Keywords Molecular beam epitaxy Á
InAs quantum dots Á Photoluminescence Á Vicinal surface
Introduction
Self-assembled InGaAs/GaAs semiconductor quantum dots
(QDs) attracted extensive research efforts due to their
unique properties as ‘‘artificial atoms’’ [1–3]. Understand-
ing and controlling the growth of InGaAs/GaAs QDs were
important both for fundamental studies and in view of their
potential in optoelectronic device applications. In this
arena, it is well known that the GaAs substrate orientation
has a large impact on the formation and properties of the
self-assembled InGaAs QDs [4–8]. This is due to the dif-
ferent oriented substrate surfaces that are characterized by
different chemical potentials thus affecting the kinetics of
adsorption, migration, desorption, reconstruction, and
strain relaxation [9–12]. These differences, in turn, intro-
duce new optical properties and potential applications
[13–16].
To date, there are many experimental and theoretical
studies on the influence of GaAs substrate orientation on
the QDs. However, the formation and evolution of QDs on
misoriented substrates remain an interesting topic because
they provide insight for designing a QD device system
[17]. Previously, Henini’s group developed the thermal-
equilibrium model [18] and theoretically proved that the
critical thickness of forming InAs QDs on high index
surfaces increased as the substrate orientation departed
from the GaAs (100) [19]. This proof was reinforced
experimentally on GaAs (511)B surface (substrate misori-
entation of 15.8°) and GaAs (311)B surface (substrate
misorientation of 25.2°)[19, 20]. Nonetheless, our recent
investigation of InAs QDs grown on patterned substrate
showed that, with the misorientation angle less than 15°,
the InAs QDs prefer to nucleate on the vicinal surface
rather than on GaAs (100) [21, 22]. In this case, it seems
that the critical thickness of forming InAs QDs on the
vicinal surface is less than that on planar GaAs (100).
Thereafter, one question appeared: does the thermal-equi-
librium model still work well for the substrates with
misorientation angle smaller than 15.8°? To verify this,
InAs have been simultaneously deposited on GaAs (100),
GaAs (100) with a 2° misorientation angle towards [01-1]
direction and GaAs (n11)B (n = 9, 7, 5) substrates. From
the atomic force microscope (AFM) characterization and
photoluminescence (PL) investigation, a clear evolution
from QDs to quantum well (QW) was observed while the
B. L. Liang (&) Á Zh. M. Wang Á K. A. Sablon Á
Yu. I. Mazur Á G. J. Salamo
Physics Department, University of Arkansas, Fayetteville, AR
72701, USA
e-mail:
123
Nanoscale Res Lett (2007) 2:609–613
DOI 10.1007/s11671-007-9103-3
substrate misorientation angle increased from 0° to 15.8°.
This evolution proved that the critical thickness increased
as the substrate orientation departed from the GaAs (100).
Experiments
The samples used in this investigation were grown by
solid-source molecular beam epitaxy (MBE) on GaAs
(100), GaAs (100) with a 2° misorientation towards [01-1]
and GaAs (n11)B (n = 9, 7, 5) substrates. As shown in
Table 1, the substrate misorientation angle h, increased
from 0° to 2°, 8.9°, 11.4°, and 15.8°, respectively. For
convenience, they were labeled samples A, B, C, D, and E.
The growth was carried out simultaneously on five sub-
strates soldered on the same molybdenum block side by
side to guarantee identical growth conditions. After loading
the molybdenum block into the MBE growth chamber, the
surface oxide was thermally desorbed at 600 °C. Thereaf-
ter, a 0.5-lm-thick GaAs buffer layer was grown at 600 °C
followed by a reduction of the substrate temperature to
530 °C for the growth of 1.6 monolayer (ML) of InAs. By
in situ reflection high-energy electron diffraction, the
growth rate of InAs was deduced to be 0.013 ML/s and the
QD formation was confirmed on GaAs (100) surface. After
15 s of growth interruption, a 20 nm GaAs capping layer
was grown on top of the QDs layer before the substrate
temperature was raised to 600 °C for the growth of an
additional 80 nm of GaAs capping layer. Finally, an
identical InAs QD layer was again deposited at 530 °Con
top of the GaAs for morphology characterization by AFM.
The PL measurements were performed in a variable tem-
perature (10–300 K) closed-cycle cryostat under the
excitation of a continuous-wave YAG laser with an oper-
ated-wavelength of 532 nm. The PL spectra were analyzed
by a 0.5-m spectrometer and were detected by a liquid
nitrogen cooled CCD camera.
Results and Discussion
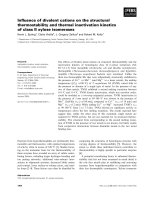
Illustrated in Fig. 1 are the AFM images and the histo-
grams of QD height. Clearly, the surface morphology
strongly depended on the substrate orientation. As shown
by Fig. 1a and b, for sample A grown on planar GaAs
(100), two families of InAs QDs formed on the GaAs (100)
surface. The bigger QDs had a density of 5.2 9 10
9
cm
-2
,
a lateral size of (80.0 ± 8.6) nm and an average height of
(14.7 ± 1.0) nm. The smaller QDs had a density of
4.0 9 10
8
cm
-2
, a lateral size of (57.2 ± 10.8) nm and an
average height of (6.1 ± 2.5) nm. The formation of two
families of QDs was attributed to two growth mode tran-
sition onsets at 1.45 and 1.59 ML of InAs coverage [23].
For sample B, as shown by Fig. 1c and d InAs QDs were
also observed on the surface, but the QDs exhibited a
single-modal distribution with a density of 5.8 9 10
9
cm
-2
,
Table 1 Substrates and misorientation angles for samples A–E
Sample # A B C D E
Substrate (100) 2°-[011] (911)B (711)B (511)B
h (°) 0 2 8.9 11.4 15.8
400nm
400nm
400nm
400nm
400nm
(a)
(c)
(e)
(g)
(h)
0
rebmunDQ
QD Height (nm)
0
QD Height (nm)
re
b
munDQ
0
QD Height (nm)
rebmunDQ
(b)
(d)
(f)
5
10
15
20
4
8
12
16
20
5
10
15
20
Fig. 1 (a) AFM and (b) histogram of the QD height of sample A; (c)
AFM and (d) histogram of the QD height of sample B; (e) AFM and
(f) histogram of the QD height of sample C; (g) AFM of sample D;
(h) AFM of sample E
610 Nanoscale Res Lett (2007) 2:609–613
123
a lateral size of (51.1 ± 6.4) nm and an average height of
(8.8 ± 1.4) nm. When the substrate misorientation angle
increased to 8.9°, i.e., for the sample C grown on GaAs
(911)B, as shown in Fig. 1e and f, the obtained QDs still
exhibited single-modal distribution, but with a low density
of 1.0 9 10
9
cm
-2
and a small average height of
(5.2 ± 1.7) nm. Clearly, the QDs on (911)B surface were
closer to the two-three dimensional (2D-3D) growth mode
transition than the QDs did on samples A and B. When the
substrate misorientation angle further increased to 11.4°
and 15.8°, i.e., for samples D and E, as shown by the AFM
images in Fig. 1g and h there were no QDs found. The
InAs growth was still 2D growth and QW was formed on
each surface. In summary of the AFM images in Fig. 1,a
continuous morphology evolution from QDs to QW was
clearly observed while the substrate misorientation angle
increased from 0° to 15.8°.
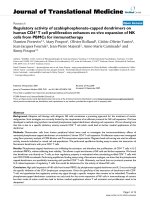
Then low temperature (T = 10 K) PL spectra was
measured to verify the substrate orientation dependence
and the results are given in Fig. 2a. Each PL spectrum,
which was excited with a laser intensity of 0.3 W/cm
2
, was
normalized to its maximum. For sample A, the broad PL
band around 1.1 eV was related to InAs QDs, which
exhibited a bimodal distribution and agreed with the AFM
observation. The peak at 1.058 eV with a FWHM of
30 meV and the peak at 1.117 eV with a FWHM of
59 meV were attributed to the big QDs and the small QDs,
respectively. The narrow peak at 1.436 eV originated from
the wetting layer (WL). For sample B, the PL signal
showed one QD peak centered at 1.201 eV with a FWHM
of 49 meV and one WL peak centered at 1.432 eV with a
FWHM of 12.6 meV. For sample C, similarly, the PL
spectrum showed one QD peak at 1.291 eV with a FWHM
of 93 meV and a WL peak at 1.431 eV with a FWHM of
12.8 meV. However, its QD peak had a big blue-shift and
less intensity. It can be seen that, from sample A to C, as
the density and size of QDs decreases, their PL emission
became less intense and blue-shifted. When the misorien-
tation angle further increased to 11.4° and 15.8°, as shown
in Fig. 2 there was no QD PL peak observed. Only the QW
PL was founded for samples C and D. Therefore, the PL
spectra in Fig. 2a also showed a clear evolution from QDs
to QW while the substrate changed from GaAs (100) to
GaAs (511)B, which was coincident with the AFM
observation in Fig. 1.
To further examine the optical properties, samples B, C
and E were selected to measure the temporal PL (TRPL)
behaviors. The measured PL band positions were indicated
by the letters in Fig. 2a and the corresponding TRPL data
were plotted in Fig. 2b. For sample B, its WL emission, as
shown by the curve-a, had a decay time as short as 110 ps.
This short decay time was due to the fast exciton relaxation
from the WL to the confined energy states of QDs. The QD
PL band at 1.201 eV had a decay time of 1,450 ps as
shown by the curve-b, which is a typical value for InAs
QDs. For sample C, its QD peak at 1.291 eV was charac-
terized by a QD decay time of 1,320 ps as shown by curve-
c. However, as shown by the curve-d its WL PL has a
decay time of 280 ps, which is longer than the WL decay
time obtained from curve-a. This long WL decay time is
likely due to the very low QD density on (911)B surface.
Consequently, only a small fraction of the photon-gener-
ated electron–hole pairs can recombine through the islands,
and most of them have to recombine through the WL [24].
Finally, for sample E, there are no QDs. The PL band at
1.446 eV was characterized by a decay time of 640 ps,
which means a typical QW characterization. The evolution
from QDs to QW was further proved by the TRPL mea-
surement while the substrate orientation changed from
GaAs (100) to GaAs (511)B. Interestingly, in this investi-
gation not only typical QW and QDs but also certain
intermediate state between QW and QDs was observed.
The sample grown on (911)B surface could be regarded as
an example, which has a low density of small QDs with
weak PL emission and a strong WL signal with a life time
between the typical QW and WL of InAs QDs.
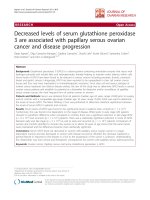
Finally, the evolution of InAs QDs formation was evi-
dent by the temperature dependence of the PL
measurements. Fig. 3 strengthened the physical picture
with the integrated PL intensity as a function of tempera-
ture. For sample B, the integrated intensity of its QD PL
band started to quench quickly after the temperature is
higher than 160 K. This is a feature for InAs QDs due to
the strong 3D confinement, which demonstrates the
*12 meV exciton binding energy in these dots. Due to the
fact that the excitons in the WL easily interacted with the
phonon and quenched, the integrated PL intensity of the
(b)
e
d
c
b
laser
τ
=110ps
τ
=1450ps
τ
=1320ps
τ
=610ps
τ
=280ps
).u.a(ytisnetnILP
time (
p
s)
a
0.9
QW
(a)
QW
QDs
WL
a
b
c
d
e
E
D
C
B
A
ytisnetnILPdezilamroN
Photon energy (eV)
0
400
800
1200
1600
2000
1.0
1.1
1.2
1.3
1.4
1.5
1.6
Fig. 2 (a) Low temperature (T = 10 K) PL spectra obtained with
laser excitation power of 0.3 W/cm
2
;(b) TRPL for samples B, C,
and E
Nanoscale Res Lett (2007) 2:609–613 611
123
WL of sample B began to rapidly decrease as the tem-
perature increased from 10 K. For the sample E with only
QW grown on (511)B, the PL started to fast quench from
the temperature of 60 K due to the relatively lower binding
energy of the excitons in QW. More interestingly, we
observed the temperature dependence behavior of the WL
of sample C is between the typical QW of sample E and the
typical WL of InAs QDs on sample B, which confirms that
the sample grown on (911)B can be regarded as an inter-
mediate state.
In summary, a clear evolution from QDs to QW was
observed while the substrate varied from GaAs (100) to
GaAs (511)B. To our knowledge, it is the first time that
such a detailed evolution was observed by AFM, PL, and
TRPL together. Since the growth condition and the InAs
deposition were identical for all of the samples, we
attributed this evolution due to the variation of the critical
thickness on misoriented substrates. As the substrate mis-
orientation angle increased from 0° to 15.8°, our results
indicated a delayed formation of InAs QDs, which means
an increased critical thickness. This observation agrees
with Sanguinetti’s reports, in which the critical thickness
increased as the substrate varied from GaAs (511)B to
GaAs (311)B [20].
Generally, the formation of self-assembled InAs QDs is
explained in terms of a thermal-equilibrium picture where
the system assumes the state of lowest free energy. The net
energy of a QD has been defined as [18, 25]:
E
QD
¼ E
elastic
þ E
surface
þ E
edge
;
where E
elastic
is the elastic energy relief due to partial strain
relaxation inside the QD, E
surface
is the surface energy
associated with increased surface area of the QD, and E
edge
is the energy associated with the various facets and the
resulting edges of the QD. During the SK growth of InAs
QDs, the main driving force forming islands is the strain
relaxation, which permits relief of part of the strain induced
by the lattice mismatch between the epitaxial InAs layer
and the GaAs substrate. As mentioned earlier, different
oriented substrate surfaces are characterized by different
chemical potentials thus affecting the kinetics of adsorp-
tion, migration, desorption, reconstruction, and strain
relaxation. In fact, the in-QD strain relaxation is influenced
by the substrate orientation and it has been proven that the
strain relaxation is less efficient for islands grown on high
index surfaces [20]. For further evidence, the aspect ratio Q
(height over width) for the samples was examined. The
QDs grown on substrate with larger misorientation angle
appeared flatter and exhibited a lower aspect ratio
(Q * 0.09 on GaAs (911)B and Q * 0.17 on GaAs
(811)B) with the GaAs (100) case ( Q * 0.18 for big QDs
and Q * 0.11 for small QDs ), which illustrate less strain
relaxation for high index surfaces [19]. The inhibition of
strain relaxation inside the islands, by increasing the island
internal energy term, should determine a delay in the 3D
growth mode onset. As experimentally observed, the crit-
ical thickness increased as the substrate orientation
departed from the GaAs (100). It can be seen that our
experimental results can be well explained by the thermal-
equilibrium model. The thermal-equilibrium model devel-
oped by Henini’s group, not only work for the high indexed
substrate with misorientation angle from 15.8° to 25.2°,but
also work well for small misorientation of less than 15.8°.
Therefore, such a simple model in fact accounts for many
experimental reports of strain-driven island evolution on
high indexed and/or vicinal substrates.
We also mentioned in the introduction that, our recent
work of InAs QDs grown on patterned substrates showed
that the InAs QDs prefer to nucleate on the vicinal surface
as compared to the GaAs (100) surface [21, 22]. In this
case, it seems that the critical thickness of forming InAs
QDs on the vicinal surface is less than that on GaAs (100).
However, the observations in this report prove that critical
thickness increased as the substrate orientation transitioned
from the GaAs (100). The developed thermal-equilibrium
model by Henini’s group works fine for the substrates with
big or small misorientation angles. Therefore, we suppose
that in our previous investigation, the fact that the InAs
QDs prefer to nucleate on the vicinal surface is not due to
the change of critical thickness, but due to the increasing of
effective deposition of InAs. Actually, many monolayer
steps characterize the vicinal surfaces. These ML steps
blocked and trapped the In adatoms that migrated from the
nearby planar GaAs (100) surface, which caused an
increase in the InAs local coverage and make the real InAs
deposition in the vicinal surface area reached the critical
thickness before the planar GaAs (100) plane. Therefore,
the mechanism of QD formation on the patterned substrate
0 50 100 150 200 250
10
-1
10
3
10
2
10
1
10
0
T(K)
ytisnetnILPdetargetnI
Sample E QW
Sample C WL
Sample B QDs
Sample B WL
Fig. 3 Temperature dependence of integrated PL intensity
612 Nanoscale Res Lett (2007) 2:609–613
123
with vicinal surface is different for that QD formation on
the pure vicinal surfaces.
Conclusions
In conclusion, InAs quantum structures simultaneously
grown on GaAs (100), GaAs (100) with a 2° misorientation
angle towards [01-1], and GaAs (n11)B (n = 9, 7, 5)
substrates have been investigated by AFM characterization
and PL measurements. While the substrate misorientation
angle increases from 0° to 15.8°, an evolution from QDs to
QW was clearly observed in both morphologic and optical
investigations. Interestingly, the sample grown on (911)B
surface was observed as an intermediate state between
typical QW and QD structure, which has a low density of
small QDs with weak PL emission and a strong WL signal
with a life time between the typical QW and normal WL of
InAs QDs. These observations show that the formation and
the optical properties of the quantum structures strongly
depend on the substrate orientation. The InAs QDs for-
mation was delayed while the surface orientation departs
from GaAs (100), as they were reported previously on
GaAs (311)B and GaAs (511)B. The evolution from the
QDs to QW was attributed to the less efficient of strain
relaxation on misoriented substrate surfaces. This report
demonstrates, the thermal-equilibrium model developed by
Henini’s group, not only work for the high indexed sub-
strate with misorientation angles from 15.8° to 25.2°, but
also work well for small misorientation of less than 15.8°.
Therefore, such a simple model in fact accounts for many
experimental reports of strain-driven island evolution on
high indexed and/or vicinal substrates.
Acknowledgment The authors acknowledge the financial support
of the NSF of US (through Grant No. DMR-0520550).
References
1. D. Leonard, M. Krishnamurthy, C.M. Reaves, S.P. Denbaars,
P.M. Petroff, Appl. Phys. Lett. 63, 3203 (1993)
2. Z. Yuan, B.E. Kardynal, R.M. Stevenson, A.J. Shields, C.J. Lobo,
K. Cooper, N.S. Beattie, D.A. Ritchie, M. Pepper, Science 295,
102 (2000)
3. S.S. Li, J.B. Xia, Z.L. Yuan, Z.Y. Xu, W.K. Ge, Y. Wang, J.
Wang, L.L. Chang, Phys. Rev. B. 54, 11575 (1996)
4. M. Henini, Nanoscale Res. Lett. 1, 32 (2006)
5. Y. Okada, M. Miyagi, K. Akahane, Y. Luchi, J. Appl. Phys. 90,
192 (2001)
6. Y. Temko, T. Suzuki, P. Kratzer, K. Jacobi, Phys. Rev. B 68,
165310 (2003)
7. S.P. Guo, H. Ohno, A. Shen, F. Matsukura, Y. Ohno, Appl. Phys.
Lett. 70, 2738 (1997)
8. T. Kitada, Y. Tatsuoka, S. Shimomura, S. Hiyamizu, J. Vac. Sci.
Technol. B 18, 1579 (2000)
9. D.I. Lubyshev, P.P. Gonza
´
lez-Borrero, E. Marega Jr., E. Petitprez,
P. Basmaji, J. Vac. Sci. Technol. B 14, 2212 (1996)
10. M. Henini, S. Sanguinetti, S.C. Fortina, E. Grilli, M. Guzzi,
G. Panzarini, L.C. Andreani, M.D. Upward, P. Moriarty, P.H.
Beton, L. Eaves, Phys. Rev. B. 57, R6815 (1998)
11. W. Jiang, H. Xu, B. Xu, W. Zhou, Q. Ghou, D. Ding, J. Liang,
Z.G. Wang, J. Vac. Sci. Technol. B 19, 197 (1996)
12. S.S. Li, J.B. Xia, Phys. Rev. B 50, 8602 (1994)
13. Zh.M. Wang, Sh. Seydmohamadi, J.H. Lee, G.J. Salamo, Appl.
Phys. Lett. 85, 5031 (2004)
14. J.S. Lee, M. Sugisaki, H.W. Ren, S. Sugou, Y. Masumoto,
Physica E 7, 303 (2000)
15. M. Kawabe, K. Akahane, S. Lan, K. Okino, Y. Okada,
H. Koyama, Jpn. J. Appl. Phys. 38, 491 (1995)
16. S. Martini, A.A. Quivy, A. Tabata, J.R. Leite, J. Appl. Phys. 90,
2280 (1998)
17. B.D. Min, Y.K.E.K. Kim, S.K. Min, M.J. Park, Phys. Rev. B. 57,
11879 (1998)
18. I. Daruka, A.L. Barabasi, Phys. Rev. Lett. 79, 3708, 1997
19. S. Sanguinetti, G. Chiantoni, E. Grilli, M. Guzzi, M. Henini,
A. Polimeni, A. Patane, L. Eaves, P.C. Main, Europhys. Lett. 47,
701 (1999)
20. S. Sanguinetti, G. Chiantoni, E. Grilli, M. Guzzi, M. Henini,
A. Polimeni, A. Patane, L. Eaves, P.C. Main, Mater. Sci. Eng. B
74, 239 (2000)
21. Zh.M. Wang, J.H. Lee, B.L. Liang, W.T. Black, Vas P. Kunets,
Yu I. Mazur, G.J. Salamo, Appl. Phys. Lett. 88, 233102 (2006)
22. J.H. Lee, Zh.M. Wang, B.L. Liang, W.T. Black, Vas P. Kunets,
Yu I. Mazur, G.J. Salamo, Nanotechnology 17, 2275 (2006)
23. F. Arciprete, E. Placidi, V. Sessi, M. Fanfani, F. Patella,
A. Balzarotti, Appl. Phys. Lett. 89, 041904 (2006)
24. M.J. da Silva, A.A. Quivy, P.P. Gonzalez-Borrero,
N.T. Moshegov, E. Marega Jr., J. Cryst. Growth 227–228, 1025
(2001)
25. N. Moll, M. Scheffler, E. Pehlke, Phys. Rev. B. 58, 4566 (1998)
Nanoscale Res Lett (2007) 2:609–613 613
123