Báo cáo hóa học: " Research Article Impact of Radio Link Unreliability on the Connectivity of Wireless Sensor Networks" pptx
Bạn đang xem bản rút gọn của tài liệu. Xem và tải ngay bản đầy đủ của tài liệu tại đây (1.36 MB, 16 trang )
Hindawi Publishing Corporation
EURASIP Journal on Wireless Communications and Networking
Volume 2007, Article ID 19196, 16 pages
doi:10.1155/2007/19196
Research Article
Impact of Radio Link Unreliability on the Connectivity of
Wireless Sensor Networks
Jean-Marie Gorce, Ruifeng Zhang, and Herv
´
eParvery
ARES INRIA / CITI, INSA-Lyon, 69621 Villeurbanne Cedex, France
Received 30 October 2006; Revised 30 March 2007; Accepted 6 April 2007
Recommended by Mischa Dohler
Many works have been devoted to connectivity of ad hoc networks. This is an important feature for wireless sensor networks
(WSNs) to provide the nodes with the capability of communicating with one or several sinks. In most of these works, radio links
are assumed ideal, that is, with no transmission errors. To fulfil this assumption, the reception threshold should be high enough
to guarantee that radio links have a low transmission error probability. As a consequence, all unreliable links are dismissed. This
approach is suboptimal concerning energy consumption because unreliable links should permit to reduce either the transmission
power or the number of active nodes. The aim of this paper is to quantify the contribution of unreliable long hops to an increase of
the connectivity of WSNs. In our model, each node is assumed to be connected to each other node in a probabilistic manner. Such
a network is modeled as a complete random graph, that is, all edges exist. The instantaneous node degree is then defined as the
number of simultaneous valid single-hop receptions of the same message, and finally the mean node degree is computed analy ti-
cally in both AWGN and block-fading channels. We show the impact on connectivity of two MACs and routing parameters. The
first one is the energy detection level such as the one used in carrier sense mechanisms. The second one is the reliability threshold
used by the routing layer to select stable links only. Both analytic and simulation results show that using opportunistic protocols is
challenging.
Copyright © 2007 Jean-Marie Gorce et al. This is an open access article distributed under the Creative Commons Attribution
License, which permits unrestricted use, distribution, and reproduction in any medium, provided the original work is properly
cited.
1. INTRODUCTION
Wireless sensor networks (WSNs) have generated a tremen-
dous number of original publications over the last decade.
When compared to other ad hoc networks, WSNs differ by
their constraints. The leading constraint unquestionably is
the life time of the network which is closely related to energy
consumption. One approach for increasing life time consists
of providing the nodes with sleeping periods [1–3], under
the constraint that sensing function and connectivity are pre-
served [4]. Optimizing routing protocols is an important task
which requires connectivity of the network [5]. Many works
have studied the connectivity of ad hoc networks [6–9]. Pio-
neering works dealing with network connectivity [10, 11]are
based on a perfect geometric disk model; that is, all links are
reliable and occur only wh en the communication distance is
lower than a threshold, the radio range. Other more recent
works are founded on this assumption, providing numerous
wireless network connectivity bounds. In [7, 9, 12], the con-
nectivity is assessed for a large random network providing
asymptotic rules. Hence, in [9] an asymptotic minimal range
R(n) for granting connectivity is derived for the case of n
nodes randomly distributed in a disc of u nit area. The min-
imal range is obtained as R(n)
2
≥ (log n + c(n))/π · n with
c(n)
→∞when n →∞. A pure geometric approach is used
in [13] to provide an exact analytical derivation for a 1 D ad
hoc network. This result further grants a bound for 2D radio
networks.
Important to our work is the contribution of [14]study-
ing the mean node degree of WSNs and the isolation node
probability. In [15] the authors show how the isolation node
probability well approximates the connectivity probability.
Most of these already published works are based on the
perfect geometric disc model as illust rated in Figure 1(a).
This model relies on the following three fundamental ax-
ioms.
(i) Switched link: the radio link is assumed boolean: two
nodes are either perfectly connected, or out of range.
(ii) Circular geometric neighborhood: the received power
solely depends on the transmitter-receiver distance.
(iii) Interference free: each radio link is assumed indepen-
dent from each other.
2 EURASIP Journal on Wireless Communications and Networking
(a) (b) (c)
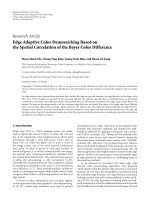
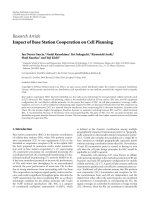
Figure 1: Node’s neighborhood with different radio link models: (a) perfect unit disk, (b) switched links with shadowing, (c) unreliable
links accounting for transmission errors. With this latter model, all nodes are neighbors with a given successful transmission probability,
visualized by the lines’ thickness.
Recent works advocate the need of more realistic radio link
models (see, e.g., [12, 16–20]).
Concerning connectivity, the second axiom ( i.e., circular
coverage) has been relaxed in recent studies [21–23] and the
impact of log shadowing is evaluated. The coverage areas are
deformed as illustrated in Figure 1. Under this model, each
coverage area is squeezed and stretched (see Figure 1(b)) in-
dependently, but the neighborhood is still on average a cir-
cular function. This is because the deformation is introduced
as an uncorrelated process. The most important result issued
from these works is that path-loss variations help to maintain
the network connectivity. The radiation pattern is another
factor which can affect the second axiom [24]. As detailed
in [25], radiation pattern can also improve both connectivity
and capacity.
The third axiom (interference free)hasbeenrelaxedina
recent work. Reference [26] rests on the approximation that
interference acts as additive Gaussian noise. It follows that a
transmission succeeds only if the signal to interference plus
noise ratio (SINR) exceeds the reception threshold.
All these works assume that the first axiom is true, thus
needing the definition of a reception threshold. This hypoth-
esis is justified by information theory. Basically, the success-
ful transmission probability, having a radio link distance d,
namely P
s
(tr|d), is a decreasing function which stiffens and
gets closer to a step function provided that ideal (but long)
channel coding is used. However, an infinite length code
would be necessary to reach exactly the switched link model.
With a rather realistic short-length channel coding, there is
always a region in which nodes have a reception probability
neither null nor certain, as illustrated in Figure 2 [27, 28].
Noisy links were introduced in [29] in the framework
of graph theory and percolation. They show that the over-
all connectivity improves when new links beyond the range
just make up for broken links above.
This paper aims at study ing the unreliability of radio
links in the intermediate region to quantify their leading role
in the connectivity. In our model, any node has a probabil-
ity to receive any message as illustrated in Figure 1(c). This
probability tends towards 1 for near communication and to-
P
s
(tr|r)
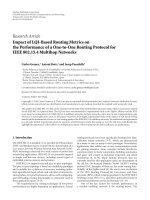
dN(r)
= 2πρ ·r · dr
r
1
r
2
r
Figure 2: The neighbors are considered placed i n rings centered
at the transmitter. The mean number of successful hops of length r
results from the product of the success probability (gray line) having
γ(r), and the number of nodes (black line) in a differential ring of
thickness dr and radius r.
wards 0 when distance goes to infinity. With such a realistic
model, the communication range becomes undefined and is
replaced by a reception probability law depending on the dis-
tance. This law relies on various parameters such as channel
propagation model, radio transmission technique (packets-
size, modulation, coding, etc.), and packet size.
Section 2 provides a short overview of previously pub-
lished works [14, 15, 21–23] dealing with connectivity hav-
ing switched radio links. The mean node degree definition is
extended to unreliable radio links in Section 3 and a n overall
expression for the probabilistic radio link is provided. Also,
the mean node degree is described from a cross-layer point
of view in Section 3.3 by introducing two parameters from
MAC and routing layers. The first one is the energy detec-
tion level such as the one used in a carrier sense mechanism.
Jean-Marie Gorce et al. 3
The second one is the reliability threshold which can be used
at the routing layer to select stable links only. The theory de-
rived in this section is then deeply studied in Section 4, firstly
for additive white gaussian noise (AWGN) channels and then
broadened to block-fading channels modeled by Nakagami-
m distributions. A closed-form lower bound of the mean
node degree is found and expressed as a function of the en-
ergy detection level and the reliability threshold. The accu-
racy of our results is evaluated using extensive simulations in
Section 5. Some conclusions and perspectives are drawn in
Section 6.
2. CONNECTIVITY: A STATE OF THE ART
2.1. Connectivity versus mean node degree
This section provides the reader with some previously pub-
lished definitions and connectivity properties of switched-
link-based WSNs for the sake of consistency. A switched link
model is based on the assumption that the transmission be-
tween two nodes x and x
succeeds if and only if the signal-
to-noise ratio (SNR)
γ( x, x
) at the receiver is above a min-
imal value
γ
min
. The widely used disk range model is then
achieved if one assumes the antennas are all omnidirectional
and the radio wave propagates isotropically. For the sake of
simplicity, all the devices are assumed to be transmitting at
the same power level P
t
.
The nodes of the WSN are further assumed independent
and randomly distributed according to a random point pro-
cess of density ρ, over the space R
2
. The WSN is further con-
sidered spread over an infinite plan, to avoid boundary prob-
lems. The probability of finding N nodes in a region A fol-
lows a two dimensional Poisson distribution:
P(n nodes in S)
= P(N = n) =
ρ · S
A
n
n!
e
−ρ·S
A
,(1)
with E[N]
= ρ · S
A
.
This process is usually studied using its associated ran-
dom graph G
p(x,x
)
(N)model,whereN is the number of
nodes, and p(x, x
) the probability of having a link (edge) be-
tween two nodes positioned at x and x
,respectively.Apure
random graph has p(x, x
) = p
0
while a random geometric
graph has p(x, x
) = 1for|x − x
| <R. The later represents
an ideal radio network well, with range R—see Figure 1(a).
A WSN roll out is defined as a particular realization of the
random process and is represented by a deterministic graph
G
={V, L},whereV and L are, respectively, the set of nodes
and the set of valid radio links l(x, x
). Under the hypothesis
of switched links, l(x, x
) only exists if both are in range one
of each other.
1
The connectivity is an important feature for WSNs. A
graph is said to be connected if at least one multihop path
exists between all pairs of nodes in the graph. Note that the
1
It should be noted that in this work and other referenced works in this
paper, radio links are assumed symmetrical, and thus associated graphs
are undirected.
sensors can all communicate with a unique sink if and only
if the corresponding graph is connected.
This connectivity cannot be formally expressed as the
probability of having G
={V, L} connected because the ran-
dom process herein used is spread over an infinite plan. The
number of nodes thus tends toward infinity. In [29], the con-
nectivity is defined as the probability of having an infinite
connected component in G.In[8, 9], the network is scaled
down to a finite disk area, and the connectivity is assessed
thanks to the range R(n) which allows to make the graph
asymptotically connected (i.e., for n
→∞). In [21], the con-
nectivity is also studied in a finite disk but defined as a sub-
region of a whole infinite network at a constant density. This
definition is substantially different, because the nodes out-
side the disk can help for the connectivity of nodes inside the
disk. Then, connectivity is assessed through the probability
P(con(A)) that the nodes inside a subarea A of surface S
A
are
connected one to each other.
In this paper, we adopted this latter definition. This prob-
ability cannot be analytically derived from the properties of
the random process and an upper bound is instead found
by stating that the nodes in region A are obviously not con-
nected if at least one node is isolated:
P
con(A)
≤
P
ISO(A)
,(2)
where con(A)istrueifallnodesinA are connected, and
ISO(A) is true if no one is isolated.
P(
ISO(A)) is thus the probability of having no node iso-
lated in A. This upper bound is known to be tight for either
random geometric or pure random graphs, at least for high
connectivity probability. The tightness of the bound is not
proven in a broadened framework.
P(
ISO(A)) is derived in [21, 23] assuming the isolation
of nodes to be almost independent events, providing
P
ISO(A)
=
∞
n=0
P
ISO(A)|N = n
·
P(N = n)
= exp
− ρ · S
A
· P(iso)
,
(3)
where P(iso) is the node isolation probability.
Let the node degree μ(x) be defined as the number of
links of a node x, the mean value being referred to as μ
0
.
P(iso) is simply equal to the probability of having μ(x)
= 0,
and thus
P(iso)
= exp
−
μ
0
. (4)
The close relationship between connectivity and mean
node degree can now be stated by introducing (4)and(3)
in (2):
P
con(A)
≤
exp
−
ρ · S
A
· e
−μ
0
. (5)
Starting from this bound, the remainder of this paper focuses
on the mean node degree property. The tightness of (5)is
investigated by simulation in Section 5.3.
4 EURASIP Journal on Wireless Communications and Networking
2.2. Mean node degree with the perfect disc model
Thedegreeexpectationofanodex relies on the radio links
according to
μ(x) =
x
∈R
2
l(x, x
) · f
x
(x
)dx
,(6)
where f
x
(x
) is the probability density function of having
anodeinx
. This is because the nodes are uniformly dis-
tributed, f
x
(x
) = ρ and the process is ergodic. Spatial and
time expectations then converge to the same value given by
μ
0
= μ( x) = ρ ·
x
∈R
2
l(x, x
)dx
. (7)
The exact expression of l(x, x
) relies on the propagation
model. Usefulness for our ongoing development is to derive
the link as a function of the SNR defined by
γ( x, x
) =
E
b
(x, x
)
N
0
,(8)
with N
0
the noise power density of the receiver which is as-
sumed constant for all nodes. E
b
(x, x
) is the received energ y
per bit given by E
b
(x, x
) = T
b
· P
r
(x, x
)whereT
b
is the bit
period. P
r
(x, x
) is the receiv ed power given by
P
r
(x, x
) =
P
t
(x)
L(x, x
)
,(9)
where L(x, x
) is the path loss between x and x
.
The usual disc range model is achieved when L(x, x
)is
considered a homogeneous and isotropic function L(x, x
) =
L(d
xx
), where d
xx
is the geometric distance between x and
x
. The sing le slope path-loss model is defined by
L
d
xx
=
L
d
0
d
xx
d
0
α
(10)
having the path loss exponent α usually ranging from 2 (free
space) to 6. L(d
0
) is the arbitrary path-loss reference at dis-
tance d
0
.
Plugging this model into (7) yields
μ
0
= 2π · ρ ·
∞
s=0
l
d
xx
= s
·
s · ds (11)
with
l
d
xx
=
1
γ(x, x
) ≥ γ
min
=
1
d
xx
≤ d
max
, (12)
where 1(x) is a logical function, equal to 1 if x is true. One
has d
max
= d
0
· (γ
0
/γ
min
)
1/α
and γ
0
= T
b
· P
t
(x)/N
0
· L(d
0
).
Such a model leads to the well-known perfect disc range
model (see Figure 1(a)) where (11)reducesto
μ
0
= π · ρ · d
2
max
. (13)
2.3. Mean node degree with shadowing
The physical layer model can be enhanced using a more re-
alistic propagation model [21, 23], taking into account spa-
tial path loss variations due to obstacles [30], as illustrated
in Figure 1(b). A usual way consists of introducing a second
term to the deterministic path loss: the statistical shadow-
ing component usually considers “log normally” distributed
around its mean value [31] according to
L
(dB)
(x, x
) = L
(dB)
50%
d
xx
+ L
(dB)
sh
d
xx
, (14)
where L
(dB)
50%
(d
xx
) = 10 · log
10
(L(d
xx
)), from (10), is the me-
dian path-loss value. L
(dB)
sh
(d
xx
) refers to a zero mean Gaus-
sian random variable with standard deviation σ
sh
,propor-
tional to the shadowing strength. Its probability density func-
tion (pdf) is given by
f
L
(dB)
(x, x
)
=
1
√
2πσ
s
exp
−
L
(dB)
− L
(dB)
50%
d
xx
2
σ
2
s
.
(15)
Combining (8)and(10) into (15) provides the pdf f
γ
(γ|·)as
f
γ
γ|d
xx
=
10
ln 10
γ
−1
· f
L
d
xx
. (16)
The shadowing distorts the perfect disc neighborhood. How-
ever, once one has the shadowing effect computed, each radio
link l(x, x
) stays constant: the corresponding graph is thus
deterministic. While the random process is still isotropic,
each realization is not.
Themeannodedegreein(7)isnowreplacedby
μ
0
= 2π · ρ ·
∞
s=0
P
l
d
xx
= s
· s · ds, (17)
with
P
l
d
xx
= P
γ
d
xx
>γ
min
=
∞
γ=γ
min
f
γ
(γ|d
xx
)dγ.
(18)
This problematic has been studied in both [21, 23].
This overview stresses out the leading role of the mean
node degree in the connectivity of WSNs. Some more recent
works have also proposed to broaden this result by introduc-
ing fading and even radiation patterns. Basically these works
rest on the adaptation of l(x, x
) to a spatially variable func-
tion. The neighborhood is stretched and squeezed [29]but
still based on a switched radio link assumption.
3. CONNECTIVITY UNDER UNRELIABLE RADIO LINKS
3.1. Time-varying node degree
The use of a realistic radio link modifies in depth the connec-
tivity of WSNs described above. A realistic radio link refers to
a radio link having a certain error probability. Because the ra-
diated p ower density decreases with distance, there is always
Jean-Marie Gorce et al. 5
a given range for wh ich the nodes are neither good neigh-
bors, nor unknown. This has a large impact on both mean
node degree and connectivity.
We consider as in [29] a random connection model
where each radio link l(x, x
) is probabilistic. The radio link is
thus defined as successful transmission probability between
two nodes:
l(x, x
) = P
s
tr|x, x
; P
s
tr|x, x
∈
[0, 1]. (19)
In the previous model, nodes were randomly distributed but
each radio link in a particular realization was considered de-
terministic. Now, the following definition holds.
Definition 1. A WSN is defined as a realization of a Pois-
son point random process. Each node is a possible neighbor
of each other with a given probability. T he random graph
G
p
(N, L) associated with each part icular realization is thus
complete (all edges exist). Each e dge, l(x, x
) ∈ L,relatesto
the successful transmission probability.
The main difference with the previous model is that a re-
alization of the process (a set of randomly rolled-out nodes)
is now itself a random graph as illustrated in Figure 1(c).
Each time a node sends a packet to the sink, a new graph
is experienced by the WSN. This graph is now referred to as
G(N, L
τ
), where L
τ
is the set of successful transmissions in
the WSN at time τ denoted l
τ
(x, x
).
With this model, the probability of having a successful
long hop may not be negligible despite the fact that the trans-
mission probability decreases with distance d. This decreas-
ing probability can be indeed compensated for by the in-
creasing number of nodes in a ring of constant thickness δ
andofradiusd (see Figure 2). The connectivity is still eval-
uated as the probability that a given subset of nodes is con-
nected. The following definition is first stated.
Definition 2. The instantaneous node degree μ(x, τ)isde-
fined as the number of simultaneous successful transmis-
sions experienced at time τ by a transmitter located in x:
μ(x, τ)
=
x
l
τ
(x, x
) (20)
and then the following definition holds.
Definition 3. The mean node degree
μ(x) is the expected
value of μ(x, τ)withrespecttotime
μ(x) = E
τ
μ(x, τ)
=
x
l(x, x
), (21)
where one has l(x, x
) = E
τ
(l
τ
(x, x
)).
Because the process is ergodic (statistical properties are
stationar y in time and space), the expectation with respect to
space converges to the same value and is given by
μ
0
= E
x,τ
μ(x, τ)
=
ρ ·
x
∈R
2
l(x, x
)dx
. (22)
Equation (22) is similar to (7) but with having l(x, x
)prob-
abilistic.
3.2. A realistic radio link
The radio link is defined equal to the transmission probabil-
ity l(x, x
) = P
S
(tr|γ(x, x
)), having
P
S
tr|γ
=
1 − BER(γ)
N
b
, (23)
where N
b
is the number of bits per frame and BER(γ) the
bit error rate. This BER depends on modulation, coding, and
more generally on transmitting and receiving techniques (di-
versity, equalization, etc.). It should also rely on the channel
impulse response, but selective fading is not considered in
this work.
Flat fading is more important because it is often present
in confined environments where WSNs could be rolled out.
The flat fading accounted for by multipath propagation leads
to fast variations of received power due to the incoherent
summation of multiple waves. From a general point of view,
the transmission probability c an be estimated from the mean
BER given by
BER
f
(γ) =
∞
0
BER(γ) · f
γ
γ|γ
dγ, (24)
which can be bounded in many practical situations [32].
f
γ
(γ|γ) is the pdf of γ having a mean SNR γ, representing
the fast fluctuations of received power.
However, in slow varying channels—as occurring with
fixed WSNs and short packets—the channel can be assumed
constant within a packet duration. Under such an assump-
tion, referred to as pseudo stationarity, the channel is called
a block-fading channel. In this case, the successful transmis-
sion probability does not rely on (24) but directly on (23)
according to
P
S
tr|γ
=
∞
γ=0
P
S
tr|γ
·
f
γ
(γ|γ) · dγ. (25)
As done in the previous section, propagation (10) and shad-
owing (16) are plugged into the expectation of (25), yielding
P
l
d
xx
=
∞
γ=0
∞
γ=0
P
S
tr|γ
· f
γ
γ|γ
·
f
γ
γ|d
xx
· dγ · dγ.
(26)
The more general mean node degree expression is now given
by (17) in which (18)isreplacedby(26).
3.3. A cross-layer point of view
From a cross-layer point of view, the mean node degree can
be modified to take some MAC and routing features into ac-
count.
The power detection level of an incoming sign al is an im-
portant PHY parameter which the MAC layer can possibly
assess. A carrier sense mechanism—or any other energy de-
tection mechanism—is used at PHY for providing the MAC
with the channel state. T he key parameter is the energy de-
tection level, or equivalently the SNR threshold denoted ε
d
at
which the receiver switches to active reception mode. Such a
6 EURASIP Journal on Wireless Communications and Networking
mechanism can be easily introduced in (26)asalowerbound
in the integration with respect to γ. Indeed, the radio link
probability becomes null when γ<ε
d
since the incoming
signal is not detected.
Neighborhood management to maintain routes over the
network is seen as a routing layer issue, exploiting a link layer
information. Routing algorithms, either active or proactive,
often consider radio links as reliable and stable enough so
that a route can be established for a reasonable duration. This
stability can be questionable in real environments. The shad-
owing effect can be assumed stationary because the WSN is
fixed, but the fading effect should be considered time-varying
because it is sensitive to very small displacements of either the
nodes or surrounding objects. Fading is however assumed to
be constant for the duration of a packet, but totally uncorre-
lated between successive ones.
The reliability of a link is given by the successful trans-
mission probability, and is extracted from (26) as follows:
P
s
tr|γ
=
∞
γ=ε
d
P
s
tr|γ
· f
γ
γ|γ
· dγ. (27)
The link layer can thus estimate the link reliability by only
knowing the mean SNR
γ(x, x
), using (27). The routing
layer can then remove unreliable nodes from its neighbor-
hood, which are those having a mean SNR below a given
threshold
γ
r
defined such as P
s
(tr|γ
r
) <P
rel
where P
rel
is
the target minimal success probability. This threshold should
be high for proactive protocols which require stable routes
but may be eventually very low for opportunistic routing
protocols such as those used for geographic based routing
[33]. In the latter case, all nodes receiving a packet are po-
tentially retransmitters, and thus they can all be involved in
the transmission process, even if their reception probability
is very low. Thus, the full node degree can be exploited, hav-
ing
γ
r
→ 0.
Plugging both (27)and
γ
r
into (26) as a lower integration
bound again yields
μ
0
= 2π · ρ
∞
s=0
∞
γ=γ
r
P
S
tr|γ
· f
γ
(γ|s) ·s ·dγ · ds. (28)
This is the basic formulation used in the next section to per-
form an analytic study of specific cases.
4. MEAN NODE DEGREE CLOSED-FORM DERIVATION
In this sec tion, a closed-form derivation is proposed for the
mean node degree in block-fading channels. The case of a
simple AWGN channel is considered first. The results are
then extended to block-fading channels.
4.1. Normalized node density
Albeit the exact expression provided above in ( 28)would
permit to take shadowing into account, we decide to disre-
gard it for enhancing the leading aim of this work, that is, the
impact of unreliability on connectivity. Equation (28) there-
fore confines to
μ
0
= 2π · ρ ·
d
r
s=0
P
S
tr|γ
d
xx
= s
· s · ds, (29)
where d
r
= d
0
· (γ
0
/γ
r
)
1/α
corresponds to the distance at
which
γ = γ
r
, and thus at which the successful transmission
probability equals the reliability target P
rel
.
In ( 29), the mean node degree depends on several sys-
tem parameters: the node density ρ, the transmission power,
and the noise level (all involved in
γ( s)). It is obvious that the
connectivity of a network can be improved by either increas-
ing the transmission power or the node density. Both have
the same meaning from a graph point of view. A convenient
generic formulation is proposed, relying on a different node
density reference. Let d
1
be the distance at which the received
power is unitary:
γ( d
1
) = 1. n
1
is then defined as the mean
number of nodes located inside a disk of radius d
1
:
n
1
= π · ρ · d
2
1
. (30)
It is important to note that this distance depends physically
on the path-loss parameters (α and L
0
), the reception noise
N
0
, and the transmission power P
0
,alldefinedinSection 2.2.
The mean SNR
γ( d)isnowexpendedfrom(10)asa
function of d
1
:
γ =
d
d
1
−α
. (31)
A variable change from s to
γ in ( 29)leadsto
μ
0
=
2n
1
α
·
∞
γ
r
γ
−(1+2/α)
· P
S
tr|γ
· dγ. (32)
In (32), the mean node degree now only relies on one generic
node density parameter
n
1
, on the energy detection level
through ε
d
and on the attenuation parameter α.
4.2. Closed-form in AWGN
4.2.1. Transmission probability
Without fading, the mean SNR
γ is merged in its instanta-
neous value γ.Then,P
S
(tr|γ) = P
S
(tr|γ) and the integration
lower bound in (32)isequaltomax(ε
d
, γ
th
). We assume that
ε
d
plays both roles in this case. Let us now focus on the in-
stantaneous success probability P
S
(tr|γ), which is directly re-
lated to the bit error ra te (BER). A closed form of the BER is
found in [32] for coherent detection in AWGN:
BER(γ)
= 0.5 · erfc
k · γ
, (33)
with erfc(x)
= (2/
√
π) ·
∞
√
x
e
−u
2
du, the complementary er-
ror function. k relies on the modulation kind and order, for
example, k
= 1 for binary phase shift keying (BPSK). The
frame-based success probability is given in (23). Important
for the following is the high SNR lower bound, valid for
(N
b
· BER(γ)) 0.1:
P
S
tr|γ
∼ 1 − N
b
· BER(γ). (34)
Jean-Marie Gorce et al. 7
10
−4
10
−2
10
0
10
2
10
−2
10
0
10
2
10
4
μ
b
/n
1
BER-based mean node degree
α
= 2
α
= 4
ε
d
(a)
10
−4
10
−2
10
0
10
2
Mean node degree’s loss
ε
d
α = 2
α
= 4
0
0.1
0.2
0.3
0.4
0.5
L
α,k
(b)
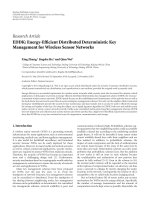
Figure 3: (a) The single-bit frame mean node degree is plotted as a function of ε
d
for two attenuation slope coefficients (α = 2inblue,α = 4
in red), having k
= 1. The maximal mean node degree owing to a perfect switched link of the same range is also provided (dashed lines). (b)
Connectivity loss L
α,k
(ε
d
) due to BER in the same conditions. The asymptotic mean node degree having ε
d
→ 0 (i.e., when the range tends
towards infinity) is half the switched link value, because the BER tends towards 0.5.
4.2.2. Single-bit frame derivation
Let us firstly evaluate the success probability for single-bit
frames. This provides a mathematical basic result to be used
later for larger frames.
The single bit based mean node degree μ
b
is obtained as
afunctionofε
d
by putting (23) h aving N
b
= 1 into (32):
μ
b
ε
d
=
2n
1
α
· M
α,k
ε
d
, (35)
with
M
α,k
ε
d
=
∞
γ=ε
d
γ
−(1+2/α)
·
1 − 0.5 · erfc
k · γ
·
dγ.
(36)
After cumbersome computations detailed in the appendix,
M
α,k
(ε
d
)issolvedin(A.10), for 2 <α<4. Basically, M
α,k
(ε
d
)
could be easily solved for α
≥ 4, but this is kept out of the
scope of this paper for the sake of conciseness.
The mean node degree which would be obtained un-
der the switched link assumption and having the same range
d
ε
d
= d
1
·ε
−1/α
d
is given by plugging (30) into (13) as follows:
μ
0
ε
d
=
n
1
·
d
ε
d
d
1
2
, (37)
which can be introduced in (A.10), making (35)equalto
μ
b
ε
d
=
μ
0
ε
d
·
1 − L
α,k
ε
d
, (38)
where L
α,k
(ε
d
) which denotes the mean node degree loss due
to unreliability is
L
α,k
ε
d
=
0.5 · erfc
k · ε
d
−
α
(4 − α)
√
π
·
k·ε
d
·e
−k·ε
d
−
k·ε
d
2/α
Γ(ξ) − Γ
inc
ξ, k ·ε
d
,
(39)
with ξ
= (3α − 4)/2α. Γ and Γ
inc
are, respectively, the well-
known complete and incomplete gamma functions given by
(A.8)and(A.9) in the appendix.
μ
b
(ε
d
)andL
α,k
(ε
d
)areplottedinFigure 3 for k = 1.
L
α,k
(ε
d
) tends toward 0 (perfect transmission) and 0.5(ran-
dom reception) for short and long r anges, respectively. What
is surprising at first glance is the divergence of μ
b
(ε
d
) when
ε
d
→ 0. This happens simply because the error transmission
tends to 0.5 (and not 0). Thus, at long range, half of the nodes
receive the right single bit. Let us now switch to the more
meaningful case of N
b
bits frames.
4.2.3. Frame-based first-order approximation
The frame-based mean node degree for N
b
bits frames is de-
noted by μ
n
. Plugging the exact success probability (23) into
(32)provides
μ
n
ε
d
=
2n
1
α
·
∞
ε
d
γ
−(1+2/α)
·
1 − BER(γ)
N
b
· dγ. (40)
This result is illustrated for various parameters in Fig-
ure 4, thanks to numerical computations. As explained in
8 EURASIP Journal on Wireless Communications and Networking
α = 2
α
= 4
10
−8
10
2
10
−6
10
−4
10
−2
10
0
ε
d
10
−2
μ
n
/n
1
10
−1
PER-based mean node degree
10
0
10
1
10
2
N
b
= 100
N
b
= 20
N
b
= 10
N
b
= 1
(a)
Far region Plateau region Near region
Long
range
Short
range
Low-power
threshold
High-power
threshold
μ
n
(ε
d
)
ε
d
(b)
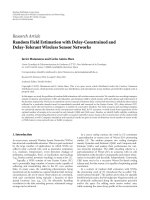
Figure 4: The curves represent the mean node degree as a function of the power detection level (ε
d
)forα = 2 (blue) and α = 4 (red dashed).
Each curve can be divided into three sections as illustrated in (b). Reading the chart from right to left, we have (i) the near section (high
SNR threshold, low range), where the connectivity gets higher the less power threshold is used because the more range is achieved; (ii) the
middle section where the curves reach a plateau. At this distance, the probability of having a new neighbor is negligible. Keeping N
b
fixed,
the plateau is reached whatever α is, approximately at the same SNR threshold, but stretches to a lower value for higher α; (iii) the far section
(low SNR threshold, high range) for which the mean node degree diverges, having ε
d
→ 0. At such a distance, the successful transmission
probability decreases more slowly than the number of nodes grows. Basically, for a useful packet size (Nb > 20), the divergence region still
mathematically exists but moves towards very low SNR values.
Figure 4(b), the mean node degree curves can b e divided into
the following three sections.
(i) Near section: for high SNR thresholds, the lower the
power detection, the higher the mean node degree.
The success probability is high and increasing the
range (by decreasing the power detection level) pro-
vides an increased mean node degree.
(ii) Constant section: for intermediate threshold values,
the mean node degree is constant. The reception prob-
ability for a node at this distance is very low. The nodes
number in a ring at such a distance does not increase
fast enough to compensate for the reliability leakage.
(iii) Far section: below a given threshold value, the rece-
ption probability tends to a constant value lim
γ→0
P
s
(t r |
γ) = 2
−N
b
, which corresponds to purely random recep-
tion. Since the number of neighbors tends to infinity,
so is the number of successful transmissions.
The far zone is basically out of interest because transmis-
sions are unforeseeable and a very low detection level would
be required. These long hops are consequently poorly effi-
cient from energy and resource sharing points of view. The
near section is more interesting where the connectivity is im-
proved by decreasing the detection level. The junction point
between near and constant sections is proved to be a good
tradeoff because it corresponds to the minimal neighbor-
hood spreading achieving the plateau’s value.
Let us further assume that the plateau is reached at a BER
low enough to permit the use of (34) into (32). This pro-
vides an asymptotic lower bound for the mean node degree,
denoted by
μ
n
(ε
d
)andgivenby
μ
n
ε
d
=
2n
1
α
·
∞
ε
d
γ
−(1+2/α)
·
1 − N
b
· BER(γ)
· dγ.
(41)
Using the definition (A.10)ofM
α,k
(ε
d
) and the bit-based
mean node degree (38)provides
μ
n
ε
d
=
N
b
· μ
b
ε
d
−
N
b
− 1
2n
1
α
·
∞
ε
d
γ
−(1+2/α)
· dγ,
(42)
which can be simplified as
μ
n
ε
d
= μ
0
ε
d
·
1 − N
b
· L
α,k
ε
d
. (43)
This approximation is assessed in Figure 5. The exact mean
node deg ree is plotted (plain line) as a function of d
ε
d
, the
range at which γ(d
ε
d
) = ε
d
. The optimal mean node degree is
equal to 0.197
·n
1
,reachedwhend
ε
d
≥ 0.5·d
1
.Theproposed
lower bound (43) (dashed line) is tight for d
ε
d
< 0.45 · d
1
.
The success probability provided in the upper frame shows
that unreliable links (e.g., P
s
(tr|γ) < 98%) represent about
30% of the whole connectivity. The needed tradeoff between
reliability and connectivity is clearly illustrated.
Jean-Marie Gorce et al. 9
P
rel
= 98%
P
rel
= 38%
00.20.40.60.81
00.20.40.60.81
P
s
(tr|d)
Successful transmission rate at distance d
d/d
1
0
0.5
1
0
0.05
0.1
0.15
0.2
μ
n
/n
1
μ
n
= 0.12.n
1
μ
n
= 0.18.n
1
μ
n
= 0.197.n
1
μ
n
∼ μ
n
μ
0
d
ε
/d
1
Figure 5: Upper frame: successful transmission probability as a
function of the link distance. Lower frame: mean node degree as
a function of the system range determined by the power detection
level d
ε
= ε
−1/α
d
· d
1
. The exact expression numerically estimated
(blue, plain), the approximation according to (43) (green, dashed),
and the ideal switched link expression (red, dash dotted) are pro-
vided. The optimal mean node degree (0.197) can be achieved at
the price of having some unreliable radio links. The suboptimal an-
alytic solution from (43) is close to the optimal connectivity, having
a limit success probability equal to P
rel
= 38%. On the opposite,
reliable links can be obtained at the price of a reduced connectiv-
ity. The mean node degree downshifts to 0.12. The simulation setup
corresponds to a BPSK (k
= 1), a free-space attenuation slope coef-
ficient (α
= 2), and 1000-bit length frames.
4.2.4. Optimal power detection level
We now propose to find an analytic expression of the power
detection threshold which performs a good tradeoff between
reliability and connectivity.
The proposed lower bound (43) exhibits a maximal value
located just beneath the plateau (see Figure 5). Because the
plateau’s value cannot be easily handled, this maximal value
can be used to approximate the optimal SNR and the corre-
sponding mean node degree by setting the first derivative of
(43)to0:
∂
μ
n
ε
d
∂ε
d
= N
b
·
∂μ
b
ε
d
∂ε
d
+
2
α
N
b
− 1
·
n
1
· ε
−1−2/α
d
= 0.
(44)
The derived of μ
b
(ε
d
) is obviously obtained from M
α,k
(ε
d
)
and yields the following exact solution:
ε
d
= arg max
ε
d
∈R
+
μ
n
ε
d
=
erfc
−1
2/N
b
2
k
, (45)
where erfc
−1
(x) is the inverse of erfc(x). For the example il-
lustrated in Figure 5,onefoundμ
n
(ε
d
) = 0.18.
An important result is that setting the power detection
level to
ε
d
optimizes the connectivity only when unreliable
links are supported. The minimal success rate corresponding
to longer hops downshifts to P
s
(tr|ε
d
). It is further important
to note that
ε
d
does not rely on the path-loss coefficient α
which means that the power detection level does not depend
on the environment attenuation slope coefficient.
The optimal power detection level
ε
d
from (45) is plot-
ted in Figure 6 as a function of N
b
. The corresponding mean
node degree and range are also provided. In this figure
d
ε
d
/d
1
and μ
n
(ε
d
)/n
1
seem to be higher for a higher α. Basically, it
is accounted for by the normalized density
n
1
used instead of
ρ.
n
1
indeed relies on d
1
, which in turn depends on path-loss
properties.
In this section, we derived a close relationship between
power detection level and radio link reliability. The connec-
tivity increase due to the use of unreliable long hops is quan-
tified. An analytic expression providing an optimal threshold
value is proposed and proven independent of the environ-
ment attenuation slope coefficient. This provides the MAC
layer with a manner to drive jointly link reliability and node
degree depending on requests from the routing layer.
4.3. Nakagami-m blo ck-fading channels
4.3.1. Radio link
This section now aims at extending the previous results to
the case of block-fading channels described in Section 3.2.
We propose the use of the Nakagami-m distributions [31, 32]
which are often used for modeling fading in various condi-
tions from AWGN (m
→∞)toRayleigh(m = 1). The SNR’s
pdf is given by
f
γ
(γ|γ) =
m
m
· γ
m−1
Γ(m) · γ
m
exp
−
m · γ
γ
, (46)
where Γ(m) is the gamma function (see (A.8) in the ap-
pendix), and m drives the strength of the diffuse component.
4.3.2. Frame-based approximation
The success probability is given by (25). The mean node de-
gree in block fading, namely μ
f
,isderivedfrom(32)asfol-
lows:
μ
f
γ
r
, ε
d
=
2n
1
α
·
∞
γ
r
γ
−(1+2|α)
·
∞
ε
d
P
S
tr|γ
· f
γ
(γ|γ) · dγ · dγ.
(47)
Note that both thresholds ε
d
and γ
r
defined in Section 3.3
now differ from each other.
This double integral evaluated when
γ
r
→ 0, as detailed
in the appendix leads to
μ
f
γ
r
−→ 0, ε
d
=
2·n
1
α
·
m
−2|α
·Γ(m+2/α)
Γ(m)
·
∞
ε
d
γ
−(1+2/α)
· P
S
tr|γ
·
dγ.
(48)
10 EURASIP Journal on Wireless Communications and Networking
0
1
2
3
4
5
6
7
8
9
10
10
0
10
5
N
b
ε
d
(a)
0
0.2
0.4
0.6
0.8
1
d
ε
/d
1
N
b
10
0
10
5
α = 2
α
= 2.5
α
= 3
(b)
0
0.2
0.4
0.6
0.8
1
μ
n
/n
1
N
b
10
0
10
5
α = 2
α
= 2.5
α
= 3
(c)
Figure 6: (a) Optimal power detection threshold as a function of frame size, (b) the corresponding range, and (c) mean node degree.
μ
f
(γ
r
→ 0, ε
d
) is referred to as the asymptotic mean node de-
gree in the following and corresponds to the optimistic case
when the WSN can exploit all neighbors whatever their reli-
ability is.
The result provided in (48) has a sig nificant meaning: the
mean node deg ree experienced in a fading environment is
very close to the one experienced in AWGN (with a same at-
tenuation slope). Identifying (40) into (48)leadsto
μ
f
γ
r
−→ 0, ε
d
=
C
loss
(m, α) · μ
n
ε
d
, (49)
where μ
n
(ε
d
) is the mean node degree in AWGN channel
and C
loss
(m, α) is a connectivity loss coefficient illustrated in
Figure 7 and extracted from (47)as
C
loss
(m, α) =
m
−2/α
· Γ(m +2/α)
Γ(m)
. (50)
It is interesting to note that this coefficient relies neither on
k, nor on N
b
.
The asymptotic mean node degree is now approximated
by putting (43) into (49), leading to
μ
f
γ
r
−→ 0, ε
d
=
C
loss
(m, α) · μ
n
ε
d
. (51)
A first noticeable result found for α
= 2 (perfect free-space
model) is that the mean node degree proves independent on
fading strength (C
loss
(m,2)= 1; for all m). It reveals that new
random far links exactly compensate for link loss in the near
range. For higher values of α, a weak negative imbalance of
about 10% is achieved in a Rayleigh channel (m
= 1), which
is the more severe channel arising in indoor-like environ-
ments.
A second important result is that the proposed power de-
tection level
ε
d
obtained in (45) for AWGN is further efficient
C
loss
(m, α)
0.8
0.82
0.84
0.86
0.88
0.9
0.92
0.94
0.96
0.98
1
2468100
m parameter
α
= 2
α
= 2.5
α
= 3
α
= 3.5
α
= 4
Figure 7: C
loss
(m, α) is represented as a function of the parameter m
of the Nakagami-m distribution and for various attenuation slope
coefficients α. It represents the connectivity loss due to block fading.
for any fading environment (for all m) and any propagation
model (for all α;2
≤ α<4). Therefore ε
d
makes the mean
node degree close to optimal according to
μ
f
γ
r
−→ 0, ε
d
=
C
loss
(m, α) · μ
0
ε
d
·
1 − N
b
· L
α,k
ε
d
.
(52)
Jean-Marie Gorce et al. 11
μ
n
/n
1
0
0.05
0.1
0.15
0.2
0.25
0.3
0.35
0.4
00.511.5
d
r
/d
1
α = 2, m = 1
α
= 2, m = 10
α
= 3.5, m = 1
α
= 3.5, m = 10
Mean node degree in Nakagami-m block-fading channels
(a)
μ
n
/n
1
0
0.05
0.1
0.15
0.2
0.25
0.3
0.35
0.4
10
−2
10
−1
10
0
1 − P
rel
α = 2, m = 1
α
= 2, m = 10
α
= 3.5, m = 1
α
= 3.5, m = 10
Impact of the reliability threshold on the mean node degree
(b)
Figure 8: Mean node degree estimation for a BPSK modulation (k = 1), with N
b
= 1000 bits, plotted as a function of the reliability range,
d
r
in (a), and the limit transmission error probability P
err
(tr|γ
r
) = 1 −P
rel
in (b). In (a), the curves are numerically obtained from ( 47), with
adifferent power detection threshold ε
d
llε
d
(plain) and ε
d
=
ε
d
(dotted curves). In (b), the connectivity loss owing to a reliability threshold
is plotted. For instance, a reliability need of P
err
(tr) < 10% would make the mean node degree decreasing from 0.2to0.015 with m = 1and
α
= 2.
However, both results do not mean that f ading has no
effect on connectivity. The mean node degree is plotted in
Figure 8(a) as a function of d
r
, the distance at which the
mean power is equal to the reliability threshold
γ
r
. Plain and
dashed plots hold for the exact mean node degree from (47)
computed numerically having, respectively, ε
d
= ; ε
d
and ε
d
= ε
d
from (45). The weak connectivity loss is due
to the power detection threshold. These curves are provided
for 4 pairs (α, m). For α
= 2, the same asymptotic value is
reached for any m value, but further away in Rayleigh condi-
tions. It means that the neighborhood stretches with increas-
ing fading, making the links less reliable.
Figure 8(b) shows the same curves as a function of the
reliable probability limit P
rel
. The connectivity leakage owing
to a stringent P
rel
is seen, especially for strong fading. With
α
= 2, the maximal connectivity is equal to 0.19, whatever
m. A constraint of P
rel
= 0.9 is fulfilled having a mean node
degree going down to 0.11 and 0.02 for m
= 10 and m = 1,
respectively. The capability of managing unreliable links is
thus a very important feature for W SNs roll out in strong
fading environments.
In this section, the asymptotic mean node degree was
firstly expressed as a function of the mean node degree in
AWGN weighted by a loss factor. The weakness of the loss
factor was observed. A lower bound of the asymptotic mean
node degree was also provided. Secondly, the optimal power
detection threshold ε
d
analytically derived in previous sec-
tion for AWGN was found still valid whatever the fading
strength is. Lastly, the effect of fading on reliability has been
assessed.
The leading conclusion is that unreliable links may con-
tribute significantly to improve the connectivity of a WSN.
5. SIMULATION RESULTS
The theoretical analysis of the previous section is now vali-
dated by extensive simulation. Section 5.1 describes the sim-
ulation setup. In Section 5.2, the mean node degree study
is compared to simulations. Then, in Section 5.3 the tight-
ness of the connectivity bound provided by (5)inSection 2
is evaluated.
5.1. Simulation setup
Mean node degree and connectivity were evaluated in a disk
area A with surface S
A
. The complete roll-out simulation area
Ω is a larger disk including A. The node degree of all nodes in
A is evaluated, taking into account all the nodes in Ω in order
to avoid boundary problems and to simulate A as a subpart
of an infinite network [21]. From a practical point of view, we
found it reliable enough to choose Ω as a disk having radius
(R
Ω
= 2 ·R
A
).
In the simulations, the average number of nodes in A
is kept constant. We have the normalized node density
n
1
vary by varying the transmission power. Note that the radius
of the unitary received power area (d
1
) changes accordingly.
This choice is equivalent to modifying the node density, but
with our approach, we keep the mean number of simulated
nodes constant.
12 EURASIP Journal on Wireless Communications and Networking
Mean node degree (μ
0
)
0
0 10203040506070 8090100
n
1
α = 2, m = 1
α
= 2, m = 3
α
= 2, m = 10
α
= 3, m = 1
α
= 3, m = 3
α
= 3, m = 10
α
= 3.5, m = 1
α
= 3.5, m = 3
α
= 3.5, m = 10
40
5
10
15
20
25
30
35
Figure 9: Simulated mean node degree in Nakagami-m channels as
a function of the relative node density.
When not specified, the simulations results presented be-
low were obtained with default parameters set to k
= 1
(BPSK modulation), a path-loss coefficient α
= 2 (free-space
conditions), and a frame size of 1000 bits. The mean number
of nodes in A equals 50. For each transmission power level,
100 random sets of nodes were generated. For each set, the
pairwise connection matrix was computed 20 times, inde-
pendently. The number of nodes is Poisson distributed, and
they are randomly and uniformly dist ributed over the whole
space.
5.2. Mean node degree
Themeannodedegreeisfirstlyinvestigated.Figure 9 shows
the relative mean node degree
μ
n
/n
1
as given by (49). Aver-
age simulation results are provided for Nakagami-m chan-
nels using different coefficient attenuation α. The relation-
ship is found linear as expected from the previous section.
For α
= 2 the mean node degree is not dependent on m
which fits the theoretical results. This group of curves fur-
ther emphasizes the weak dependency to fading of the mean
node degree. As stated above, this result will be experienced
by a WSN, only if it is able to deal with opportunistic trans-
missions. For α
= 3andα = 3.5 the mean node degree’s loss
corresponds to the C
loss
coefficient computed above. In order
to verify the theoretical result of (47), the simulations cor-
responding are carried out. Figures 10(a) and 10(b) are the
simulation results for α
= 2andα = 3.5, respectively, in var-
ious channel conditions AWGN, Rayleigh and Nakagami-m.
These results concord with theoretical results shown in pre-
vious section. These curves confirm that in Rayleigh chan-
nels, comparing with AWGN, the long hops have an impor-
tant role to compensate the loss of short hops. To check the
impact of the power detection level
ε
d
on the mean node de-
gree, the simulations are performed for three power detec-
tion threshold values: ε
d
= 0, ε
d
= ε
d
,andε
d
= 2ε
d
. Figure 11
displays that the mean node degree reduces of 5%; however,
when ε
d
= 2ε
d
, the mean node degree goes down of 48%.
ε
d
, according to (45) proves to be close to the optimal power
detection threshold. These results simultaneously show how
increasing the detection threshold deletes long hops.
5.3. Connectivity probability
Albeit the mean node degree is constant, the graph associated
with a WSN is very sensitive to the fading strength. First of
all, Figure 8(a) has shown that the connected neighborhood
of a node spreads out with fading: the mean length of hops
increases. Figure 12 illustrates the random graphs for AWGN
and Rayleigh conditions. In the second case, some long hops
are seen and the structure appears less homogeneous.
Note that in this figure, the inner c ircle represents the
area of interest A and contains all the nodes for which the
connectivity is evaluated. The outer nodes contained in the
second circle are used only as relay for connecting inner
nodes. This illustrates how the boundary problem is over-
come in this approach.
Figure 13 represents the mean connectivity experienced
in our simulations. As found in previous section, the non-
isolated node probability relying on the mean node degree is
not affected by fading whatever m. Basically, the nonisolated
node probability acts as an upper bound for the connectivity:
a network cannot be connected if just one node is isolated.
This figure also shows that the bound gets tighter the more
the fading strength is.
Fading indeed changes the graph from a pure geometric
graph to a random graph. The mean number of links is con-
stant whatever m is, but fading favors longer links which are
more efficient to maintaining the network connectivity. The
conclusions are twofold:
(i) the mean path-loss function is sufficient to predicting
the mean node degree and thus the nonisolated node
probability,
(ii) second-order variations of the received power due to
fading do not change the mean node degree and allow
to improve the connectivity.
6. CONCLUSIONS
This work is based on the framework proposed by Bettstet-
ter et al., as described in Section 2. The main novelty rests
on the relaxation of the switched-link model. For this pur-
pose, an instantaneous node degree was defined. Its expec-
tation leads to a mean node degree definition representing
the mean number of simultaneous successful receptions of
a packet. The main difference with the classical definition
is taking into account random transmission losses. Further-
more, several parameters were introduced in the model such
as fading strength, modulation kind or frame size. More-
over, two threshold parameters managed by the MAC or the
Jean-Marie Gorce et al. 13
μ
f
(γ
r
)/n
1
0
00.511.5
d
r
/d
1
0.02
0.04
0.06
0.08
0.1
0.12
0.14
0.16
0.18
0.2
Nakagami-m
= 10
AWGN
Nakagami-m
= 1
Rayleigh
Mean node degree in block-fading channels (α
= 2)
(a)
0.05
0.1
0.15
0.2
0.25
0.3
0.35
0.4
0
00.511.5
d
r
/d
1
Mean node degree in block fading (α = 3.5)
Nakagami-m
= 10
AWGN
μ
f
(γ
r
)/n
1
Nakagami-m = 1
Rayleigh
(b)
Figure 10: Related mean node degree in Nakagami-m, AWGN, Rayleigh channels as function of the reliability range d
r
, with α = 2 (a) and
α
= 3.5(b).
μ
f
(γ
r
)/n
1
0
00.511.5
d
r
/d
1
0.02
0.04
0.06
0.08
0.1
0.12
0.14
0.16
0.18
0.2
ε
d
= 0
ε
d
= ε
d
ε
d
= 2ε
d
Influence of the power detection threshold ε
d
Figure 11: Related mean node degree in Nakagami-m, m = 10,
channels for different ε
d
as function of the reliability range d
r
(α =
2).
routing layers were also introduced. The first was the power
detection level, the second was the link reliability threshold.
In Section 3, we first defined a normalized node den-
sity
n
1
as the number of nodes included in a disk of radius
d
1
such as γ(d
1
) = 1. This convenient definition provided
the mean node degree proportional to one scaling parameter
only,
n
1
, bringing together the noise level, the mean path-
loss, the transmission power, and the node density. Then,
the AWGN case was deeply studied in Section 4.2. A lower
bound of the mean node degree was found as a function of
the power detection level. An analytic expression was fur-
ther proposed for a weakly suboptimal power detection level.
The corresponding link reliability was also evaluated and an-
alyzed. These results were finally broadened for block-fading
channels in Section 4.3 and the tradeoff between connectivity
and link reliability was widely studied. The theoretical results
were validated by simulation in Section 5.
An important result was found stating that the subopti-
mal power detection level was valid whatever were the fad-
ing strength and the path-loss attenuation slope coefficient.
Thus, the proposed power detection level does not rely on
environment properties. We also observed that fading weakly
reduces the mean node degree but spreads the neighbors over
a wider area, making the links less reliable.
Simulations have exhibited fading has a positive effect on
connectivity. Indeed, for a same mean node degree value,
connectivity in fading channels is closer to the no-node-
isolation probability.
This work clearly advocates for long hops routing as dis-
cussed in [34] and more likely for opportunistic routing.
From all these results, developing protocols able to exploit
unreliable links appear indeed challeng ing. This is an impor-
tant issue for WSN, because improving the connectivity al-
lows the number of active nodes to be smaller, thus increas-
ing the life time. Basically, increasing the connectivity by us-
ing an opportunistic transmission over several paths is noth-
ing else than a distributed extension of the well-known di-
versity principle usually used in mobile communications to
enhance individual ra dio links.
14 EURASIP Journal on Wireless Communications and Networking
(a) AWGN channel (b) Rayleigh channel
Figure 12: A peculiar realization of graphs is given for (a) AWGN and (b) Rayleigh conditions, with about 50 nodes in the smaller disk.
Albeit the mean node degree is constant (equal to 7.5), higher length hops in Rayleigh channels make the network better connected.
Probability
0
0
0.1
0.2
0.3
0.4
0.5
0.6
0.7
0.8
0.9
1
5 1015 202530 5035 40 45
P(
ISO(A)) theory
P(con(A)) Nakagami-m
= 1
P(con(A)) Nakagami-m
= 10
P(
ISO(A)) Nakagami-m = 1
P(
ISO(A)) Nakagami-m = 10
Connectivity and nonisolation-node probabilities
n
1
Figure 13: Connectivity under block fading, AWGN (m>10) and
Rayleigh (m
= 1) conditions. The connectivity and the nonisolated
node probabilities have been assessed by simulation. The theoretical
nonisolated node probability according to (3) for the approximated
mean node degree given in (49)isalsoprovided.
APPENDIX
A. BER-BASED DERIVATION OF THE
MEAN NODE DEGREE
A.1. Derivation in AWGN channel
ComputingtheBER-basedmeannodedegreeinAWGN
from (35) holds on computing M
α,k
(ε
d
)definedin(36)
which can be divided in two parts:
M
α,k
ε
d
=
∞
ε
d
γ
−(1+2/α)
· dγ −
1
√
π
A
α,k
ε
d
,(A.1)
where
A
α,k
ε
d
=
∞
γ=ε
d
γ
−(1+2/α)
·
∞
x=
√
k·γ
e
−x
2
· dx · dγ. (A.2)
Applying Fubini’s theorem to A
α,k
(ε
d
) yields
A
α,k
ε
d
=
∞
x=
√
k·ε
d
e
−x
2
x
2
/k
γ
=ε
d
γ
−(1+2/α)
· dγ · dx. (A.3)
The integration with respect to γ is easily computed provid-
ing
A
α,k
ε
d
=
α
√
π
4
· ε
−2/α
d
· erfc
k · ε
d
−
α
2
· k
2/α
· B
α,k
ε
d
,
(A.4)
where
B
α,k
ε
d
=
∞
√
k·ε
d
x
−4/α
· e
−x
2
· dx. (A.5)
B
α,k
(ε
d
) looks like a gamma function but with a negative
power exponent (
−4/α) making the integral divergent for
α<4 while the most usual values of α are comprised be-
tween 2 and 4. To achieve a closed form, this integral can be
integrated by parts leading to
B
α,k
ε
d
=
α
4−α
k · ε
d
(α−4)/2α
· e
−k·ε
d
−
∞
k·ε
d
u
1/2−2/α
· e
−u
· du
.
(A.6)
Thesecondintegralisnowaconvergentgammafunction
(for α
≥ 2), providing
B
α,k
ε
d
=
α
4 − α
k · ε
d
(α−4)/2α
· e
−k·ε
d
− Γ
3
2
−
2
α
+ Γ
inc
3
2
−
2
α
, k
· ε
d
,
(A.7)
Jean-Marie Gorce et al. 15
having Γ(ξ) the usual gamma function defined as
Γ(ξ)
=
∞
0
t
ξ−1
· e
−t
· dt (A.8)
and Γ
inc
(ξ, x) the usual incomplete gamma function defined
as
Γ
inc
(ξ, x) =
x
0
t
ξ−1
· e
−t
· dt. (A.9)
Reporting B
α,k
(ε
d
) into A
α,k
(ε
d
) and then into M
α,k
(ε
d
)pro-
vides the exact expression
M
α,k
(ε
d
) =
α
2
ε
−2/α
d
·
1 − 0.5 · erfc
k · ε
d
+
α
(4 − α)
√
π
kε
(α−4)/2α
d
e
−k·ε
d
−k
2/α
Γ(ξ) − Γ
inc
ξ, k ·ε
d
,
(A.10)
with ξ
= (3α −4)/2α.
A.2. Derivation in Nakagami-m channel
The mean node degree in Nakagami-m block-fading chan-
nels given by (47)canbewrittenas
μ
f
γ
r
, ε
d
=
2n
1
α
· M
α,k
γ
r
, ε
d
, (A.11)
having (thanks to the Fubini’s theorem)
M
α,k
γ
r
, ε
d
=
∞
ε
d
P
S
tr|γ
· C
α,k
γ
r
, γ
dγ, (A.12)
where
C
α,k
γ
r
, γ
=
∞
γ
r
γ
−(1+2/α)
· f
γ
(γ|γ) · dγ. (A.13)
Introducing the Nakagami-m pdf leads to
C
α,k
γ
r
, γ
=
m
m
· γ
m−1
Γ(m)
∞
γ
r
γ
−(1+m+2/α)
· e
(−m·γ/γ)
· dγ.
(A.14)
An appropriate variable change leads to:
C
α,k
γ
r
, γ
=
m
−2/α
· γ
−(1+2/α)
Γ(m)
mγ/γ
r
0
t
(m−1+2/α)
· e
−t
· dt.
(A.15)
The remaining integral is nothing else than the incomplete
gamma function Γ
inc
(m +2/α, mγ/γ
r
)asdefinedin(A.9).
Plugging (A.15) into (A.12)provides
M
α,k
γ
r
, ε
d
=
m
−2/α
· Γ(m +2/α)
Γ(m)
·
∞
ε
d
γ
−(1+2/α)
· P
S
(tr|γ)
·
Γ
inc
m +2/α, mγ/γ
r
Γ(m +2/α)
· dγ.
(A.16)
Finally, when
γ
r
tends toward 0, one has
M
α,k
γ
r
−→ 0, ε
d
=
m
−2/α
· Γ(m +2/α)
Γ(m)
·
∞
ε
d
γ
−(1+2/α)
· P
S
tr|γ
·
dγ.
(A.17)
ACKNOWLEDGMENTS
This work was done in the framework of the ARC IRAMUS
Project of INRIA. This work was also partially supported
by the French Ministry of Research under Contract ARESA
ANR-05-RNRT-01703.
REFERENCES
[1] D. Simplot-Ryl, I. Stojmenovic, and J. Wu, “Energy-efficient
backbone construction, broadcasting, and area coverage in
sensor networks,” in Handbook of Sensor Networks,I.Stojmen-
ovic, Ed., pp. 343–380, John Wiley & Sons, New York, NY,
USA, 2005.
[2] D. Tian and N. D. Georganas, “A coverage-preserving node
scheduling scheme for large wireless sensor networks,” in Pro-
ceedings of the 1st ACM International Workshop on Wireless
Sensor Networks and Applications (WSNA ’02), pp. 32–41, At-
lanta, Ga, USA, September 2002.
[3] A. Gallais, J. Carle, D. Simplot-Ryl, and I. Stojmenovic, “Local-
ized sensor area coverage with low communication overhead,”
in Proceedings of the 4th Annual IEEE International Conference
on Pervasive Computing and Communications (PerCom ’06),
pp. 328–337, Pisa, Italy, March 2006.
[4] J. Carle, A. Gallais, and D. Simplot-Ryl, “Preserving area cover-
age in wireless sensor networks by using surface coverage relay
dominating sets,” in Proceedings of the 10th IEEE Symposium
on Computers and Communications (ISCC ’05), pp. 347–352,
Murcia, Cartagena, Spain, June 2005.
[5] E. M. Royer and C K. Toh, “A review of current routing proto-
cols for ad hoc mobile wireless networks,” IEEE Personal Com-
munications, vol. 6, no. 2, pp. 46–55, 1999.
[6] O. Dousse and P. Thiran, “Connectivity vs capacity in dense
ad hoc networks,” in Proceedings of the 23rd Annual Joint
Conference of IEEE Computer and Communications Societies
(INFOCOM ’04), vol. 1, pp. 476–486, Hongkong, March 2004.
[7] O. Dousse, P. Thiran, and M. Hasler, “Connectivity in ad-hoc
andhybridnetworks,”inProceedings of the 21st Annual Joint
Conference of IEEE Computer and Communications Societies
(INFOCOM ’02), vol. 2, pp. 1079–1088, New York, NY, USA,
June 2002.
[8] P. Gupta and P. R. Kumar, “The capacity of wireless networks,”
IEEE Transactions on Information Theory,vol.46,no.2,pp.
388–404, 2000.
[9] P. Gupta and P. R. Kumar, “Crtical power for asymptotic con-
nectivity in wireless networks,” in Stochastic Analysis Control
Optimization and Applications, W. M. McEneany, G. Yin, and
Q. Zhang, Eds., pp. 547–566, Birkhauser, Boston, Mass, USA,
1998.
[10] Y C. Cheng and T. G. Robertazzi, “Critical connectivity phe-
nomena in multihop radio models,” IEEE Transactions on
Communications, vol. 37, no. 7, pp. 770–777, 1989.
[11] P. Piret, “On the connectivity of radio networks,” IEEE Trans-
actions on Information Theory, vol. 37, no. 5, pp. 1490–1492,
1991.
16 EURASIP Journal on Wireless Communications and Networking
[12] P. Santi, “The critical transmitting range for connectivity in
mobile ad hoc networks,” IEEE Transactions on Mobile Com-
puting, vol. 4, no. 3, pp. 310–317, 2005.
[13] M. Desai and D. Manjunath, “On the connectivity in finite ad
hoc networks,” IEEE Communications Letters, vol. 6, no. 10,
pp. 437–439, 2002.
[14] C. Bettstetter, “On the minimum node degree and connectiv-
ity of a wireless multihop network,” in Proceedings of the 3rd
ACM International Symposium on Mobile Ad Hoc Networking
and Computing (MobiHoc ’02), pp. 80–91, Lausanne, Switzer-
land, June 2002.
[15] C. Bettstetter, “On the connectivity of ad hoc networks,” The
Computer Journal, vol. 47, no. 4, pp. 432–447, 2004.
[16] A. P. Jardosh, E. M. Belding-Royer, K. C. Almeroth, and S. Suri,
“Real-world environment models for mobile network eval-
uation,” IEEE Journal on Selected Areas in Communications,
vol. 23, no. 3, pp. 622–632, 2005.
[17] N. Sadagopan, F. Bai, B. Krishnamachari, and A. Helmy,
“PATHS: analysis of PATH duration statistics and their im-
pact on reactive MANET routing protocols,” in Proceedings of
the 4th ACM International Symposium on Mobile Ad Hoc Net-
working and Computing (MobiHoc ’03), pp. 245–256, Annapo-
lis, Md, USA, June 2003.
[18] M. Takai, R. Bagrodia, K. Tang, and M. Gerla, “Efficient wire-
less network simulations with detailed propagation models,”
Wireless Networks, vol. 7, no. 3, pp. 297–305, 2001.
[19] G. Zhou, T. He, S. Krishnamurthy, and J. A. Stankovic, “Mod-
els and solutions for radio irregularity in wireless sensor net-
works,” ACMTransactionsonSensorNetworks,vol.2,no.2,pp.
221–262, 2006.
[20] I. Stojmenovic, A. Nayak, and J. Kuruvila, “Design guidelines
for routing protocols in ad hoc and sensor networks with a re-
alistic physical layer,” IEEE Communications Magazine, vol. 43,
no. 3, pp. 101–106, 2005.
[21] C. Bettstetter and C. Hartmann, “Connectivity of wireless
multihop networks in a shadow fading environment,” Wireless
Networks, vol. 11, no. 5, pp. 571–579, 2005.
[22] R. Hekmat and P. van Mieghem, “Study of connectivity in
wireless ad-hoc networks with an improved radio model,” in
Proceedings of the 2nd Workshop on Modeling and Optimiza-
tion in Mobile, Ad Hoc and Wireless Networks (WiOpt ’04),pp.
1–10, Cambridge, UK, March 2004.
[23] D. Miorandi and E. Altman, “Coverage and connectivity of ad
hoc networks presence of channel randomness,” in Proceedings
of the 24th Annual Joint Conference of the IEEE Computer and
Communications Societies (INFOCOM ’05), vol. 1, pp. 491–
502, Miami, Fla, USA, March 2005.
[24] J. Zhang and S. C. Liew, “Capacity improvement of wireless ad
hoc networks with directional antennae,” in Proceedings of the
63rd IEEE Vehicular Technology Conference (VTC ’06), vol. 2,
pp. 911–915, Melbourne, Australia, May-July 2006.
[25] C. Bettstetter, C. Hartmann, and C. Moser, “How does ran-
domized beamforming improve the connectivity of ad hoc
networks?” in IEEE International Conference on Communica-
tions (ICC ’05), vol. 5, pp. 3380–3385, Seoul, South Korea, May
2005.
[26] O. Dousse, F. Baccelli, and P. Thiran, “Impact of interferences
on connectivity in ad hoc networks,” IEEE/ACM Transactions
on Networking, vol. 13, no. 2, pp. 425–436, 2005.
[27] H. Karvonen, Z. Shelby, and C. Pomalaza-Raez, “Coding for
energy efficient wireless embedded networks,” in Proceedings
of the International Workshop on Wireless Ad-Hoc Networks
(IWWAN ’04), pp. 300–304, Oulu, Finland, May-June 2004.
[28] Y. Sankarasubramaniam, I. F. Akyildiz, and S. W. McLaugh-
lin, “Energy efficiency based packet size optimization in wire-
less sensor networks,” in Proceedings of the 1st IEEE Interna-
tional Workshop on Sensor Network Protocols and Applications
(SNPA ’03), pp. 1–8, Anchorage, Alaska, USA, May 2003.
[29] M. Franceschetti, L. Booth, M. Cook, R. Meester, and J. Bruck,
“Continuum percolation with unreliable and spread-out con-
nections,” Journal of Statistical Physics, vol. 118, no. 3-4, pp.
721–734, 2005.
[30] A. Neskovic, N. Neskovic, and G. Paunovic, “Modern ap-
proaches in modeling of mobile radio systems propagation en-
vironment,” IEEE Communications Surveys & Tutorials, vol. 3,
no. 3, pp. 2–12, 2000.
[31] S. R. Saunders, Antennas and Propagation for Wireless Com-
munication Systems, John Wiley & Sons, New York, NY, USA,
1999.
[32] Z. Wang and G. B. Giannakis, “A simple and general
parametrization quantifying performance in fading channels,”
IEEE Transactions on Communications, vol. 51, no. 8, pp. 1389–
1398, 2003.
[33] F. Ye, G. Zhong, S. Lu, and L. Zhang, “GRAdient broadcast: a
robust data delivery protocol for large scale sensor networks,”
Wireless Networks, vol. 11, no. 3, pp. 285–298, 2005.
[34] M. Haenggi and D. Puccinelli, “Routing in ad hoc networks: a
case for long hops,” IEEE Communications Magazine, vol. 43,
no. 10, pp. 93–101, 2005.